'AMZN' what happened now? Hello friends !
Today we will see AMZN
So far we have protests, epidemics, interest rates and other things that are telling us not to invest anywhere.
I agree with everything!!
let's get some trades though and leave the future to the wizards
the stock seems to want to climb up again, although will meet some resistance at first
because of the holidays .. I think we will have a rise and then it will fall again.
Let's see!
This will be a Christmas present..
If you liked this idea or if you have your own opinion about it, write in the comments.
Thanks for reading!
Fractalstrategy

FRACTAL: LTC Litecoin LOVES Decembers ⬆Hi Traders, Investors and Speculators 📈📉
Ev here. Been trading crypto since 2017 and later got into stocks. I have 3 board exams on financial markets and studied economics from a top tier university for a year. Daytime job - Math Teacher. 👩🏫
Historically, December is a bullish month for Litecoin, with the price often going parabolic and increasing more than 100 % ! Previously, 4 out of 5 Decembers, the price of LTCUSDT has increased exponentially. A quick look at a fractal that played out during 2020 from this exact support zone that we are currently trading on ($68) shows a whopping 168% increase.
While you're here 👀 Here's a guide to risk reward ratios and how to setup the perfect position :
_______________________
📢Follow us here on TradingView for daily updates and trade ideas on crypto , stocks and commodities 💎Hit like & Follow 👍
We thank you for your support !
CryptoCheck

bitcoin fractal closer viewcloser look for idea linked below
See the falling broadening wedge playing very similar as last week.

lets see if this bitcoin fractal plays outthat fractal can get BTC to around 17650, with resistance starting to show around 17936.
I wld be watching this very carefully as there is potential for a big dump around 18k.
if we are to maintain bullish momentum it won't drop much below current levels
There is potential to drop as low as 16k and maintain bullish, as long as we don't make significant new lower lows since 11/21
bears sound big and scary... but honestly I just don't think will drop to 12k.. thats possible.. still in the cards, but not what I'm seeing
tho I think there is a good trade coming up with this move up then down to retest lows

Multi-Year Ascending Scallop on DXYDuring the DXY run-up this past year, I noticed repeated ascending scallop patterns that were continually validated by breakouts. These were often on the 5 to 15 min timeframe, but If you look at the ascent even on the hourly chart, you'll notice the pattern reveals itself repeatedly. If you're a believer in using fractals in your trading strategy, you won't be surprised to see that a clear ascending scallop appears to be developing on the longer time frame. I was initially looking for this pullback to find support at former resistance, but it has possibly regained its support from 2018-20. Given the repeated validations on shorter time frames, I'm looking for a break out above the Sept high (114.778) in early 2023 - if not sooner.

INSANE XRP vs BTC Chart Comparisonyou can't make this sh*t up.
XRP(2022) vs BTC(2015) Chart Comparison
Notice the strikingly similar draw-down percentages between the local tops vs the proceeding local bottoms.
*show me the charts, and I'll tell you the news*

S&P500 Hypothetical fractal for the bottomHypothetical scenario with potential fractal of Fisher Transform oscillator for the bottom price region.

[10/27] Beast Trading _ Today's Bitcoin Analysis Beast Trading _ Today's Bitcoin Analysis
Today, we're going to analyze Bitcoin from a different perspective.
I can see it from this perspective. Please understand that~
The first picture is in January 2021.
Bitcoin is located near $29,000
Low (28.2k) -> High (42k) If you draw Fibonacci,
You can see that the "0.94 (28.9k)" section has reached its lowest point, and there has been a big increase since then.
At that time, a lot of people saw a 28.2k low renewal, but it went close to the low, but it didn't renew, and then a big rise came out.
The second picture is in June 2021.
Bitcoin is located near $29,000
Low (28.8k) -> High (36.6k) If you draw Fibonacci,
You can see that the "0.94 (29.3k)" section has reached its lowest point, and there has been a large increase since then.
Likewise, at this time, many people thought of renewing the low point, and many held short positions. Eventually, it got close to the bottom, but it didn't renew and then a big rise came out.
This is the most important current picture.
Low (17.6k) -> High (25.2k) If you draw Fibonacci,
The "0.94 (18.1k)" section, which looks like a low point, is accurately captured.
Then suddenly, a strong rise is starting to emerge.
This analysis is called a fractal analysis.
Bitcoin is expected to rise more than 100% (double) against the low point if it flows in a similar pattern to the past movement.
*The global economic situation (fundamental analysis) is completely different from those two branches.
*There is a technical analysis of this viewJust know that much!

Final Equilibrium of BTC Entropy states It appears that #BTC is nearing is entropies' final state and about to embark on slow harmonic rise with lower volatility cycles as evident from historical data analysis.

DOT fractal 2020#DOT/USDT
$DOT #fractal
at the end of 2020 we had the same consolidation moves with 16 weekly candles, then price broke out with a master candle in 17 weekly candle.
🐮 now price is in 16th week of consolidation, so if history repeat this move, we can expect a new rally at next week.

Bitcoin Dead Cat Bounce???I suspect that there are similarities between the bitcoin fractal in the 2019 - 2020 range and its fractal in the 2021 range to today.
If examined more carefully, its fractals pattern forms a big descending triangle pattern, where the last upward rally in that pattern begins with a double bottom. However, there are high uncertainties regarding how accurate the shape of the triangle might be. Therefore, I feel if
we can map each support - resistance level at that last rally up, we can minimize the trading risks.
Note: I would like to declare that this is not a financial advice. Any presented informations should be regarded as sharing opinion of my trading strategy.
Best Regards
El Suneo

+275% 😲 OMG 😲 Look at that FRACTALHi Traders, Investors and Speculators 📈📉
Ev here. Been trading crypto since 2017 and later got into stocks. I have 3 board exams on financial markets and studied economics from a top tier university for a year. Daytime job - Math Teacher. 👩🏫
OMGUSDT is looking extremely bullish after a period of consolidation. The last time after OMGUSDT consolidates around the support zone and OMG touches this price level, it was a literal OMG moment and the price went parabolic to $9.92 !
I think a big bounce on this zone is likely, and a 275% increase seems more likely than a 600% increase during this point of the market cycle.
The potential at this level is confirmed by HIGH volume the previous two times that the price traded around this level. A quick look at OMGBTC also shows bullish price action is most likely after a long period of consolidation against BTC :
_______________________
📢Follow us here on TradingView for daily updates and trade ideas on crypto , stocks and commodities 💎Hit like & Follow 👍
We thank you for your support !
CryptoCheck

[09/13] Beast Trading _ Today's Bitcoin AnalysisBitcoin has been on a steady rise in recent days and has already risen to 22k.
Although most of the auxiliary indicators indicate a decline, it seems that the characteristics of the upward trend are shown in terms of continuing the rise and rising without any adjustment, the shape and angle of the rise.
I compared it to last year's chart because it felt similar to when it renewed its low point and fell near the low point and then rose.
1. Renew low point
2. Rise for a momentarily
3. Lowering near the low without renewing the low
4. Strong rise without adjustment
5. Falling from the reporting point, briefly falling due to resistance
6. Since then, it has surpassed the downward trend and has risen strongly
1. Renew low point
2. Rise for a momentarily
3. Lowering near the low without renewing the low
4. Strong rise without adjustment (appearing)
5. ?
I analyzed it from the perspective of Fractal.
I don't think there's a possibility of the current movement, so if you keep these scenarios in mind, it will be more helpful for risk management.
Finally, the cpi announcement is scheduled today.
It is expected that the fluctuation will be very strong during the cpi announcement, and whether it is up or down, the direction will be very big.
I hope you all manage your risks well and have a great fight today!

$BETA : A Potential 15x Gain$BETA fractals repetition suggest a big move up before a drop to its unknown demand zone.

Gold looking like it may make new highs, The yellow metal have been very weary of present times, covid-19, news, energy prices, fuel prices, Russia/Ukraine conflict and other relative influential circumstances effecting it's trend, as well as other forex pairs, (USD a major factor), that said 1688 has held it's ground well over the previous months, I see no reason for it to break through now having held 5 times, (1700 may be the new 1400), my chart does show the possible break, but I consider it unlikely. My chart is based in most part on fractal historical behaviour, Gold I see it as not making it's highest high yet, there are more factors I based my idea on, but I also have seen the precious metal make moves that the major information bodies don't see, (or just don't let us know), like Reuters, fxstreet and kitco ect.
Area's to look for bull wise: 1728, 1788, 1802, 1872 and 2K
Area's to look for bear wise: 1688 and 1610

BTC/USDT : Possible similaritiesBINANCE:BTCUSDT
Hello everyone 😃
Before we start to discuss, I'll be so glad if you share your opinion on this post's comment section and hit the like button if you enjoyed it!
$BTC has gets rejected from the range's high and the rejection has caused fractal similarities between the current structure and early August's range above.
Based on the data we have, 5 points make the fractal valid and the current formation has shown 4 of them.
So, There can be only one more fractal point to follow and it can initiates more buy triggers into the 4H Demand if $BTC sweep below the Swing Lows | Equal Lows.
Also, If the current movement follows the inversed fractal, $BTC might have a double convergence into the 4H Demand and then takes off to retest the S/R line zone, and the bearish basement formed on $23400.
Although, If $BTC manages to break below the 4H Demand, Then we can expect more bearish momentum to come...
Hope you enjoyed the content I created, You can support us with your likes and comments!
Attention: this isn't financial advice we are just trying to help people with their vision.
Have a good day!
@Helical_Trades

BTC fractal 2019#BTC/USD
$BTC #Fractal from swing low of first of 2019.
⚡️ If BTC closes a weekly candle above 0.5 fib level of last daily swing low, like the swing of 2019 I showed in the chart, price may have repeat that fractal and rise toward 0.5 fib level of the whole swing down around $42k
If you use "Bars Pattern" tool you can understand the similarities better.

$BTC is about to fall...Hi, this is my contextual and price action analysis on why BTC is most likely to fall than create a massive bull run
We have more reasons to short this coin rather than to long and I laid out facts in the chart and my
data interpretation of those facts to conclude this forecast
What do you guys think?
Let me know in the comments section! :)

BTC fractal to $16k#BTC/USDT
$BTC broke down from support zone and ascending trend line.
🐻 after pullback to broken support zone to confirm it as resistance, price can follow weekly fractal from Jan 17 to May 16, and drop to $16k.

Gold could likely close its June Candle in red ?!Hello,
Sorry for those who believe strongly in inflation index and Macro economics that Gold could be safe heaven during the recession.
Two times, Gold did create a fake breakout (Fake BO), and you did see how PA behaved afterward. My short-term target in Gold is 1807-1790 ( probability: 80% for short, 20% Gold will find some support around 1820).
Market structure:
This is a very tricky question, it depends mostly in which timeframe you are in your trade. I share with you here the 8h candles TF. Personally, I trade with 1H and 8H TF:
Major flow: Bearish ( from 0, 1, 2, 3, 4, 5, 6,7 >>> clearly bearish consolidation) you can say we have a bearish flag, triangle form etc.
Minor flow: Consolidation, weak buying pressure and THERE IS NO STRONG SUPPORT before the 1808-1790 level.
Thus, It is highly probable that we have a short setup, at least 1:3 or even 4 risks: reward ratio.
Cheers and bye for now.

BTCUSDT potential fractalPotential fractal predicting with Fibonacci time frames based on Fisher Transform oscillator fractals. I'm expecting a retest to upper trendline @ 29.7k before the potential dump. It's require patience for 2D more. On Ehlers Stochastic CG we can see a bullish momentum to wait.

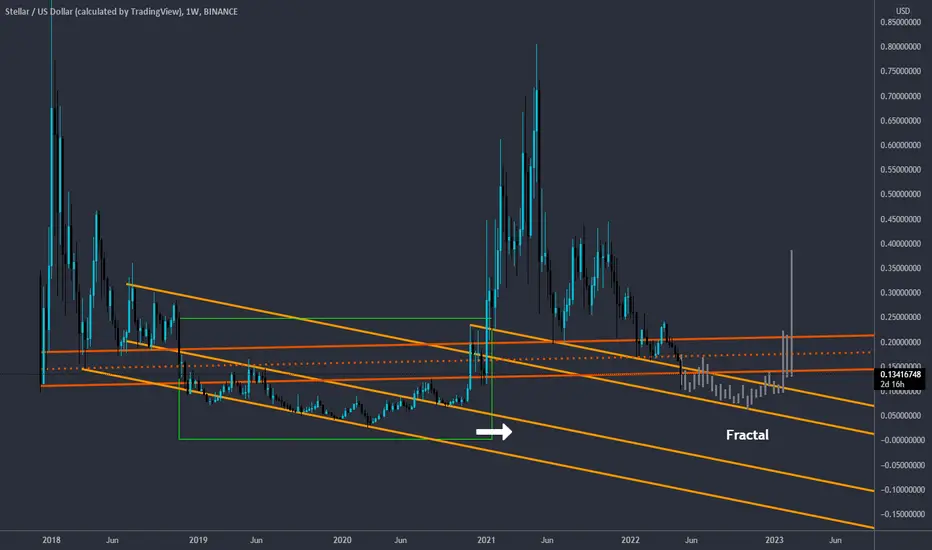
XLM fractal#XLM/USDT
$XLM fractal from end of 2018 can be repeat if weekly candle close below $0.13.
#GRT The Graph 1D Chart Breakout ready?The Graph (GRT) is one of the top 100 cryptos but it has been on a downward trend within a triangle pattern for many months. It seems we are near the apex of the triangle.
Taking the flagstaff from the last pump and moving it to the breakout area, it seems that the 1.618 fib may be reachable.
Also considering the fractal pattern from when GRT launched, we may be able to see massive gains.
Coinmarketcap on GRT: coinmarketcap.com
What are your thoughts? Comment below and hit the like please. Thank you!
Disclosure: This is just my opinion and not any type of financial advice. I enjoy charting and discussing technical analysis . Don't trade based on my advice. Do your own research! #cryptopickk #bitcoin #altcoins
