EURYEN BUY SCALP TRADE Eurjpy will be heading to it’s upside in order to fill in on its price gaps that were left untouched , the prices to be looking at is
(185.500-185.6+)
Freetrade

Q1 | D19 | W3 | Y26 GBPUSD — FRGNT DAILY CHART FORECAST📅 Q1 | D19 | W3 | Y26
📊GBPUSD — FRGNT DAILY CHART FORECAST
🔍 Analysis Approach
I’m applying a developed version of Smart Money Concepts, with a structured focus on:
• Identifying Key Points of Interest (POIs) on Higher Time Frames (HTFs) 🕰️
• Using those POIs to define a clear and controlled trading range 📐
• Refining those zones on Lower Time Frames (LTFs) 🔎
• Waiting for a Break of Structure (BoS) as confirmation ✅
This process keeps me precise, disciplined, and aligned with market narrative, rather than reacting emotionally or chasing price.
💡 My Motto
“Capital management, discipline, and consistency in your trading edge.”
A positive risk-to-reward ratio, combined with a high-probability execution model, is the backbone of any sustainable trading plan 📈🔐
⚠️ On Losses
Losses are part of the mathematical reality of trading 🎲
They don’t define you — they are necessary, expected, and managed.
We acknowledge them, learn, and move forward 📊➡️
🙏 I appreciate you taking the time to review my Daily Forecast.
Further context and supporting material can be found in the Links section.
Stay sharp 🧠
Stay consistent 🎯
Protect your capital 🔐
— FRGNT 🚀📈
FX:GBPUSD

NZD/CAD: This Hard As Stone Support Area Will Be Our Next TargetHere is my 4H NZD/CAD chart, this will be my third time to enter from this area of support. If u take a closer look u will see how strong and stubborn this support area and it pushes the price very high each time it comes near it, so I will enter a buy trade once the price is near it and it gives me a bullish price action. I will be targeting from 100 to 150 pips in this trade.

GOLD: Great Breakout Will Give Us A Close Buy TradeHere is My 2H Gold Chart , and here is my opinion , the price going up very hard without any correction so we should move with it and we have a 4H Candle closure above it And Perfect Breakout and this give us a very good confirmation , so we have a good confirmation now to can buy after the price go back to retest the broken area 3790.00, and we can be targeting 100 to 200 pips . if we have a daily closure below this area this mean this idea will not be valid anymore .
Reasons To Enter :
1- Perfect Touch For The Area .
2- Clear Bullish Price Action .
3- Bigger T.F Giving Good Bullish P.A .
4- The Price Take The Last High .
5- Perfect 2H Closure .

EUR/USD: Full Analysis + Possible Sell SetupHere is my 2H EURUSD chart, as you can see the price is moving in a decent down trend and the price now is around a critical resistance area that will happen to be touching the trendline at the same time. to enter this trade will need to see a good bearish price action around the res area and the trend line. i will be targeting 100 to 150 pips in this trade and if i have a daily candlestick closure above this res area this analysis will not be vailed.

GBP/CAD : Full Analysis With Great Sell Setup!Her is my 4H GBP/CAD, The price is suffering around this area of resistance. and if you take a historical look u will see multiple wicks refering to the strength of this area. this can be a good indicator to sell this pair again around this area . i will be targeting 100 to 150 pips.

EUR/NZD Creating H&S Pattern , Buy Setup Is Valid Now !Here is my 4H Chart On EUR/NZD , The price creating a very clear reversal pattern ( Reversed head and shoulders pattern ) and the price made a very good bullish price action now from a good support area above my neckline. so we can enter a buy trade now if you are an aggressive trader or u can wait for a 4H retest for My Neckline and then u can enter your buy trade. For this trade we can be targeting from 100 : 150 pips with a decent stop loss.

GBP/USD Full Analysis: Can W e Break Through This Resistance!Price has been moving around a very strong area of resistance and as shown on the on the chart u will see multiple wicks trying to push through this res and failed completely. my prediction for this pair is that USD on the index is struggling to move to the upside and the maid direction is down, also if we combine fundamentals too i believe strongly that USD will continue melting.
for GBP/USD pair i will wait for a daily candle stcik closure above this area of resistance. if i get this then entering a buy trade will be the best and low risk setup

Tweezer Top Candlestick Formation Is Great Win SELL Now!on the daily , 4H and 1H time frame we can detect a very strong resistance that pushes the price incredibly to the downside. and right now the price is standing at it. if we took a closer look on the 4h timeframe we will see a very good bearish price action which is ( tweezer top ) candlestick formation which indicates an upcoming bearish movement if it came around a good resistance.
so i believe we have a great sell setup on GBPCAD right now. u can enter with a nice stop loss around 50-70 pips. your target can be all the way to 1.84300. i will keep u guys posted on how this trade will go with. if u have thought on this setup share it with me now in the comments.

GBP/AUD : Lets Make Crazy Money From This Sideway Movement!This is GBP/AUD chart on the daily timeframe. if u take a close look you will see that the price is moving perfectly in a sideway between absolutely 2 strong resistance and support no break for months so far.
Trading the sideway if very fun for me because i know the price boundaries and the stronger these boundaries are the less risk you take in trading the sideway movement.
in the GBP/AUD case i will enter a buy trade @ 2.04600 u can wait and enter directly or you can sell a limit order just like me to make sure that u enter the trade even if you are sleeping.
regarding the target usually the space between the support and the resistance is your target but for me taking between 300 to 400 pips will be enough i can't wait longer that this :)

Tips And Trick On How to Trade The Flag Pattern With Perfection!Hey Everyone, in this chart we have a very clear pattern FLAG on the 4H timeframe and on the 1h timeframe. this pattern consists of three sides:
1- the trend line side:
if this side is broken then we will have to wait for a nice retest and then enter our trade which will be in the opposite direction of the trendline ( in our EURUSD it will be a sell trade).
2- the resistance area:
it is a very strong area that pushes the price very hard to the downside, once this area is broken we can enter an easy buy trade directly or we can wait for a good confirmation and a nice retest for the area.
3- the target side :
in most of the chart patterns these patterns gives you an indication of the amount of pips you are waiting for. the third side of the FLAG pattern is actually your target for the trade, try to take between 20 to 50 pips less than what is showed on this side.
so as a conclusion of the EURUSD analysis we are waiting for a good break to the trendline or the resistance area and then we can determine what our next step and if we will enter a buy or sell trade
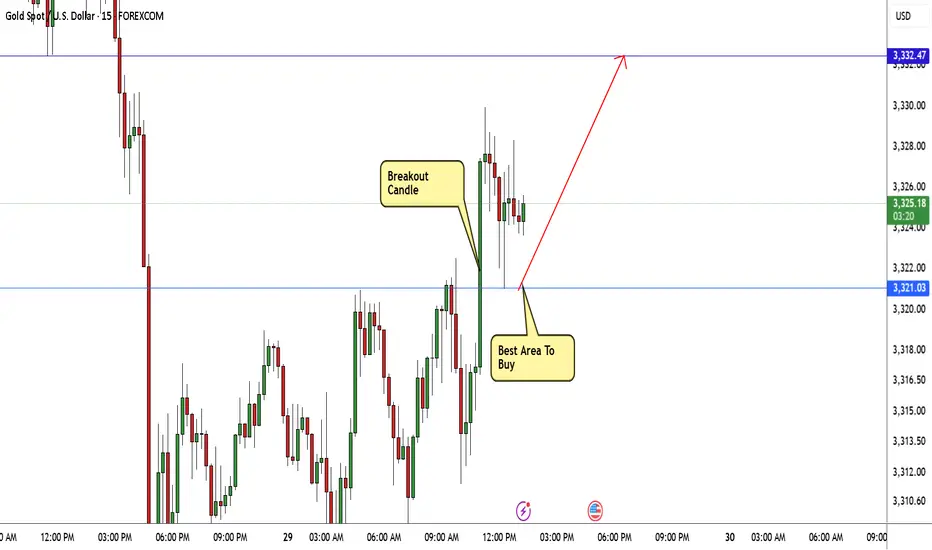
GOLD Breakout Done , Long Setup Valid To With Great ProfitHere is My 15 Mins Gold Chart , and here is my opinion , we finally above 3321.00 and we have a 15 Mins Candle closure above this strong res , so I'm waiting the price to go back and retest this res and new support and give me a good bullish price action to can enter a buy trade , and if we have a 4H Closure Above This res this will increase the reasons for buyers , just wait the price to back a little to retest it and then we can buy it . if we have a daily closure below it this idea will not be valid anymore .
EUR/USD Will Continue Melting Be Sure To Be Part Of That!Here is my thought of EURUSD chart today. I think that this pair can go down further more specially after breaking this strong area of support and old resistance. as shown on the chart we can wait for the price to come back again and retest this area once and then this will be the best place to enter a sell trade. I am targeting around 250n pips in this trade. as I said I will wait for a retest and a good bearish price action and from there I will enter a sell trade.

CHZ 50x plus tradeTraders,
Here we are again pointing out an amazing trade idea for you, the solicitors 👧🏿 and dealers 🙍🏿♂️who will likely end up transacting all of your winnings with! CHZ a great wagering project that will make you a killing this run. This one is cut and dry, we have a wedge pattern along with a possible flag that will likely play our by the end of this year!
We hope you enjoy the free trades that we have been sharing from the VIP group and look forward to seeing you enjoy these gains year round if you come check us out!
As always, stay profitable folks!
Savvy!

Fil Crypto Signal, we just make trading easier!Traders,
Here is the type of trade we like to give to our followers. Aside from the teaching of the allocation someone would take in this trade and understanding the risk management we teach or you learn about in trading this is how trades should be set up to best explain what to do, when to do it and how to do it so you can have the least risk and most gain as possible.
We will be giving all of our signals our moving forward like this to help our followers to maximize on a trade and minimize losses on the few signals that we post.
If you have any question about this signal or other feel free to shoot us a DM and we would be happy to break it down for you. You can also leave us a comment if it is related to this exact signal.
P.S. If you would like a specific analysis on any coin shoot us a DM with the ticker as we are giving out free analysis on any crypto or traditional assets for the rest of this week! Its going to be a great year, keep your eyes on the chart, your head out of the clouds and do not let the news outlets alter your knowledge of the charts. It seems like they work for the market maker if you ask me..... Op's!!!!
Stay Profitable,
Savvy

Million dollar trade plan. Risk: $1000
Leverage: 5x
Risk to reward ratio: 219.94/1
Full Target % gains: 2761.69%
Strategy: Risk it for the biscuit!
Total profit full target: $1,095,000
Please see trade for entry, stop loss and TP.

Why I Have A Naked Charts + Free Trade i share with u some of my secrets why i use naked charts and also a free trade on GBPUSD

EUR/USD Very Simple Trade And Setupvery simple setup and trade i share with u the entry reason watch now

GBP/CAD Full Analysis + Free Trade With Full Detailsi explain in the video the full analysis of this pair and i also included a free trade and her i sthe details for it
Buy Limit Order On
GBPCAD @ 1.78750
SL: 1.78150
TP: 1.81250

USD/CAD Hit A Bouncing Support Lets Buythe area around 1.36000 - 1.36300 is an absolute strong support and a very resilient block that the price touched over 8 time and failed completely to break.
now tha price came back again to it after being pushed by a historical resistance.
the 4h price action was very promising showing a really good bullish price action. based on all these reasons u can enter a buy trade now with me and the chart shows all the trade details

NZD/CHF Reversed Head And Shoulders Will Change The trend Soonon the 4H timeframe we are witnessing a reversal pattern that might change the game for NZDCHF. according to the chart u will see that the neckline is close to a trendline we need to wait and see a 4H candlestick close above that neckline to confirm the reversal movement in this chart.
once we get the confirmation we can enter a buy trade directly or wait for a nice retest to confirm the upside movement.

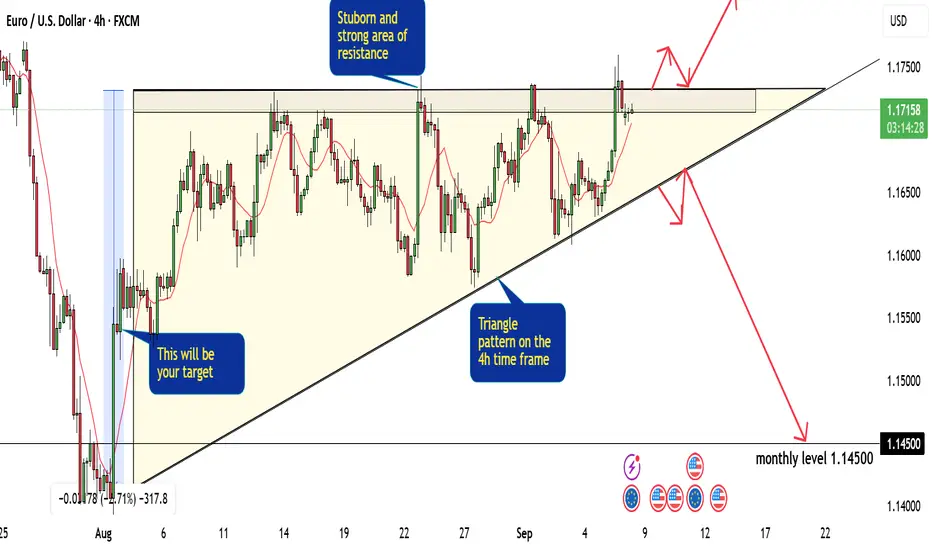
How To Identify Fake Breakout Trading Triangle Pattern TutorialIn this video i will be sharing with u how to avoid fake signals around trading patterns.
also i share with u a free trade on NZDCAD here are the details:
Sell Limit On
NZD/CAD @ 0.82700
SL: 0.83300
TP: 0.80700

AUD/CAD Is Preparing Itself To Fly be readyi believe this i a very strong buy setup check the entry reasons in the video
