Weekly analysis 26th-30th January 2026In this video, we present a weekly market outlook for USD, EUR, and Ethereum (ETH) covering the period 26th–30th January 2026.
The analysis focuses on key technical levels, market structure, and momentum across major currency pairs and the crypto market. We break down recent price action, identify critical support and resistance zones, and discuss potential scenarios that may shape market movements during the week ahead.
Ethereum, USD, EUR, SPX500, FTSE100, CAC40, DAX40.
FTSE

Ethereum Going Crazy [12-16 Jan,m 2026]Weekly analysis for the markets focusaing on the Ethereum, also include:
EURUSD
GBPUSD
GBPNZD
NZDUSD
BTC
S&P500
FTSE100
CAC40
SUI40

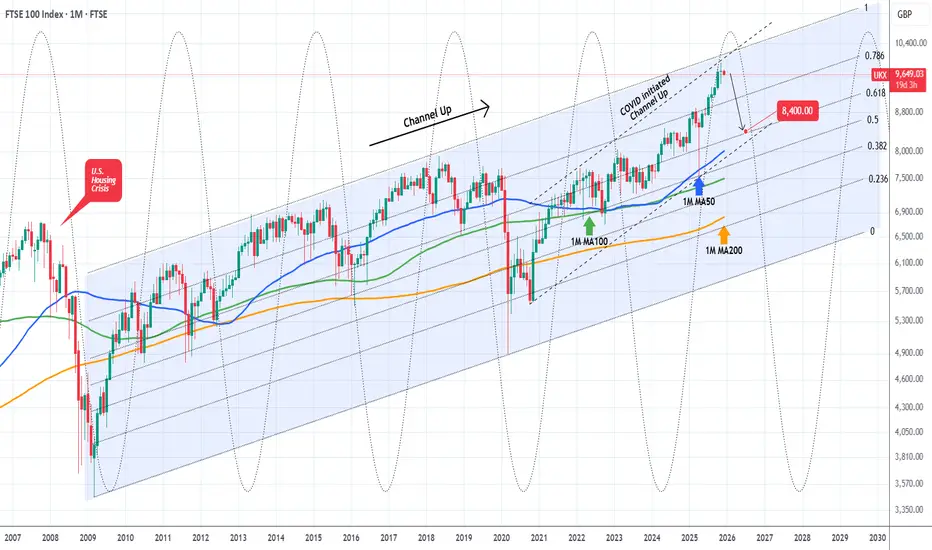
FTSE 100 Is starting a brutal 2026 Bear Cycle.Last time we looked at FTSE 100 (UK100) was 3 months ago (September 19, see chart below) where we gave a strong buy signal at the bottom of its 7-month Channel Up, which methodically hit our 9700 Target:
This time we are switching to the longest time-frame possible, the monthly (1M) as a key development has taken place. We switch our long-term stance to bearish as the index almost hit last month the top of its 16-year Channel Up, which started at the bottom of the 2008 U.S. Housing Crisis, and closed a very volatile November candle flat.
The use of the Sine Waves make the picture even clearer as they point out almost exactly every major Cycle Top since the 2008 Housing Crisis (5 such Cycle including that). And we are on one of them.
At the same time, the index also hit the top of the 5-year Channel Up that started shortly after the COVID crash bottom. Every correction (Bear Cycle/ Bearish Leg) within this pattern hit the 1M MA50 (blue trend-line) and rebounded. With the exception of the COVID flash crash which even broke below its 1M MA200 (orange trend-line), every other Bear Cycle since June 2012, hit the 1M MA100 (green trend-line) and rebounded.
As a result, we are expecting 2026 to be a strong Bear Cycle for FTSE, hitting at least its 1M MA50 at 8400, which is the bottom of the COVID Channel Up as well as the 0.618 Fibonacci retracement level of the post 2008 Channel Up.
---
** Please LIKE 👍, FOLLOW ✅, SHARE 🙌 and COMMENT ✍ if you enjoy this idea! Also share your ideas and charts in the comments section below! This is best way to keep it relevant, support us, keep the content here free and allow the idea to reach as many people as possible. **
---
💸💸💸💸💸💸
👇 👇 👇 👇 👇 👇
A big week for the UK, and $EWUIts a big week for the UK, due to the long awaited Autumn Statement on Wednesday. Chancellor Reeves decided to put back the date as long as feasibly possible. I presume that she hoped she'd have better numbers out of the economy to help her position? That her great plan for renewed growth would bare fruit? If so, then that plan has backfired quite badly. Furthermore it has allowed more time for everyone to pass commentary on a) the economy, b) the budget, and c) Reeves's performance. None of which has been complimentary. (By all means feel free to show me evidence to the contrary).
Despite all the shenanigans the FTSE has until recently) continued to march North, based on the back of a) anti-Trump rotation and b) the weakening of GBP helping those companies global profits look ore impressive.
However when we take a look at the daily chart of EWU - the ishares ETF for the UK we can see that the strong move above the Daily 50MA has reversed. Whereas it acted as strong dynamic support these last 6 months or so now leads us to consider: will it now flip to become dynamic resistance? Is that an indication of a move lower for EWU, the FTSE, and the UK in general? All will be revealed this week I believe.

FTSE about to break higher?Yesterday we highlighted the potential for a bullish breakout on the FTSE as it coiled inside converging trend lines. Today it was trying to stage a breakout as it tests the resistance trend of this pattern and a key level around 9270. A clean above this level could see the index aim for new all-time highs. The trend is bullish and so we wouldn't bet against it.
By Fawad Razaqzada, market analyst with FOREX.com

FTSE 100 Perfect Channel Up buy opportunity.FTSE 100 (UK100) has been trading within a 5-month Channel Up and right now finds itself within its 4H MA50 (red trend-line) and 1D MA50 (blue trend-line). The 1D MA50 has been intact as a Support since May 02 and initiated its previous Bullish Leg on June 25.
We expect a similar rally towards the 2.382 Fibonacci extension, targeting 9700.
-------------------------------------------------------------------------------
** Please LIKE 👍, FOLLOW ✅, SHARE 🙌 and COMMENT ✍ if you enjoy this idea! Also share your ideas and charts in the comments section below! This is best way to keep it relevant, support us, keep the content here free and allow the idea to reach as many people as possible. **
-------------------------------------------------------------------------------
💸💸💸💸💸💸
👇 👇 👇 👇 👇 👇

DAX, FTSE Update: Bears Regain ControlMomentum has finally come my way, which has seen bears reclaim control of the DAX and FTSE 100. And I suspect they'll retain control for a while longer. Today I update my levels and outlook for both markets.
Matt Simpson, Market Analyst at City Index and Forex.com (part of StoneX).

DAX, FTSE 100 Futures OutlookI've been monitoring the FTSE and DAX for potential swing highs in recent days. And I suspect they may be close, if not seen, already.
Matt Simpson, Market Analyst at City Index and Forex.com (StoneX)

DAX, FTSE 100 Technical OutlookThe DAX is on the ropes and considering a break of support. If bears succeed, it could signal a deeper pullback for the FTSE 100.
Matt Simpson, Market Analyst at City Index

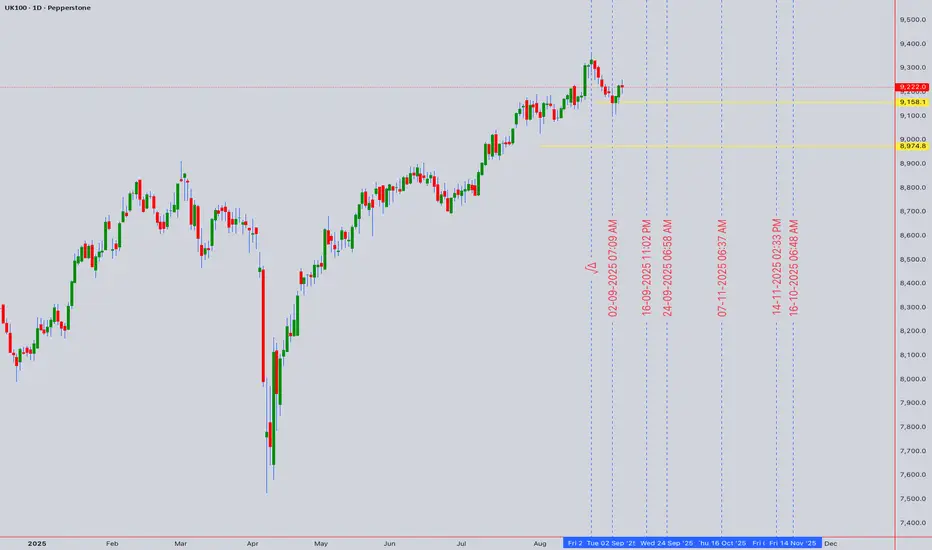
FTSE Challenges Key Resistance - Breakout or False Dawn?UK100 Technical Analysis: 🇬🇧 FTSE Challenges Key Resistance - Breakout or False Dawn? 🌅
Asset: UK100 (FTSE 100 Index CFD)
Analysis Date: September 5, 2025
Current Closing Price: 9,222.0 (as of 11:54 PM UTC+4)
Timeframes Analyzed: 1H, 4H, D, W
Executive Summary & Market Outlook 🧐
The UK100 is testing a critical technical and psychological resistance zone between 9,200 and 9,250. 🚧 This level has acted as a significant barrier in the past. The index is in a near-term uptrend but remains in a broader multi-month consolidation phase. A decisive breakout above 9,250 could signal the start of a new bullish leg, while a rejection here would reinforce the range-bound narrative and trigger a pullback. This analysis provides a clear roadmap for intraday 🎯 and swing traders 📈 navigating this pivotal level.
Multi-Timeframe Technical Analysis 🔍
1. Trend Analysis (Daily & 4-Hour Chart):
Primary Trend: 🟡 Range-Bound (Neutral). Price is trapped within a larger consolidation rectangle between ~8,800 and 9,250.
Short-Term Trend: 🟢 Bullish. The recent rally from the 9,000 support has been strong, bringing price to the upper boundary of the range.
2. Key Chart Patterns & Theories:
Range-Bound Consolidation 📊: The dominant pattern is a large rectangle. The current test of the range high (~9,250) is a make-or-break moment. A breakout would be significant, while a rejection is a classic range-trading signal.
Elliott Wave Theory 🌊: The move off the recent low looks corrective (3 waves), suggesting it may be a B-wave or part of a larger consolidation pattern within the range. This reinforces the importance of the 9,250 resistance.
Ichimoku Cloud (H4/D1) ☁️: Price is trading just above the Cloud on the daily chart, indicating a tentative bullish bias. However, the Cloud is relatively flat, reflecting the lack of a strong trend. A clear break above 9,250 would see price move decisively above the Cloud.
Wyckoff Method: The price action could be interpreted as part of a potential re-accumulation phase near the top of the range. A breakout on increasing volume would confirm this.
3. Critical Support & Resistance Levels:
Resistance (R1): 9,220 - 9,250 (Key Range High & Technical Ceiling) 🚨
Resistance (R2): 9,400 (Projected Target if breakout occurs)
Current Closing Price : ~9,222
Support (S1): 9,100 - 9,150 (Immediate Support & 21-period EMA) ✅
Support (S2): 9,000 - 9,050 (Major Range Support - Must Hold) 🛡️
Support (S3): 8,800 (Ultimate Range Low & 200-day EMA)
4. Indicator Consensus:
RSI (14-period on 4H/D): Reading is near 62, in bullish territory but not yet overbought. This suggests there is room for further upside if buyers can maintain control. A bearish divergence here would be a strong sell signal.
Bollinger Bands (4H) 📏: Price is pressing against the upper band, a sign of strong short-term momentum. A rejection here could see price move back towards the middle band.
Moving Averages: The 50 and 200-day EMAs are flat, confirming the range-bound nature. The 21-period EMA on the 4H chart is key short-term dynamic support.
Volume & VWAP: A breakout above 9,250 needs to be confirmed with a significant increase in volume to be trusted. Low-volume breakouts are often false.
Trading Strategy & Forecast 🎯
A. Intraday Trading Strategy (5M - 1H Charts):
Bearish Scenario (Range Rejection Play) ⬇️: This is a classic range trade. Fade the resistance with a short position.
Entry: On clear rejection signals at 9,240-9,250 (e.g., bearish pin bar, engulfing pattern).
Stop Loss: Tight, above 9,270.
Target: 9,150 (TP1), 9,100 (TP2).
Bullish Scenario (Breakout Play) ⬆️: If price breaks out with conviction, wait for a pullback for a better entry.
Entry: On a pullback to re-test 9,220-9,230 as new support.
Stop Loss: Below 9,200.
Target: 9,350 (TP1), 9,400 (TP2).
B. Swing Trading Strategy (4H - D Charts):
Strategy: RANGE TRADING OR BREAKOUT WAIT. The most logical play is to trade the range until it breaks.
Ideal Long Zone: Near the 9,000 - 9,050 support area. ✅
Ideal Short Zone: Near the 9,220 - 9,250 resistance area. ✅
Breakout Strategy: A daily close above 9,270 would be a strong buy signal targeting 9,400+. A daily close below 8,950 would be a strong sell signal.
Risk Management & Conclusion ⚠️
Key Risk Events: UK economic data (GDP, CPI, BoE decisions) and GBP volatility are key drivers. 🔥 As a heavily international index, the FTSE is also highly sensitive to global risk sentiment and commodity prices (particularly oil and mining stocks).
Position Sizing: Trading within a range requires tight stop losses. Ensure your position size allows for a stop placed just outside the range boundaries without incurring excessive risk.
Conclusion: The UK100 is at a critical juncture. ⚖️ The battle between the bulls and the bears is concentrated at the 9,220-9,250 resistance wall. Until a decisive break occurs, the range-bound strategy is favored. Swing traders should be patient for entries near support or a confirmed breakout. Intraday traders can fade the range extremes. The next major move will be dictated by the resolution of this level. 📊
Overall Bias: 🟢 Bullish above 9,270 | 🔴 Bearish below 8,950 | 🟡 Neutral/Range-Bound between 9,000-9,250
For individuals seeking to enhance their trading abilities based on the analyses provided, I recommend exploring the mentoring program offered by Shunya Trade. (Website: shunya dot trade)
I would appreciate your feedback on this analysis, as it will serve as a valuable resource for future endeavors.
Sincerely,
Shunya.Trade
Website: shunya dot trade
⚠️Disclaimer: This post is intended solely for educational purposes and does not constitute investment advice, financial advice, or trading recommendations. The views expressed herein are derived from technical analysis and are shared for informational purposes only. The stock market inherently carries risks, including the potential for capital loss. Therefore, readers are strongly advised to exercise prudent judgment before making any investment decisions. We assume no liability for any actions taken based on this content. For personalized guidance, it is recommended to consult a certified financial advisor.
FTSE100 is at critical pointFTSE100 of the 1H is at critical point. We have said before that once the price breaks the trend line is going to be reversl, that has to be adjusted a little a bit. but we have to consider the MAs on the 4H chart.
Good luck to you all,
MarketsTitan

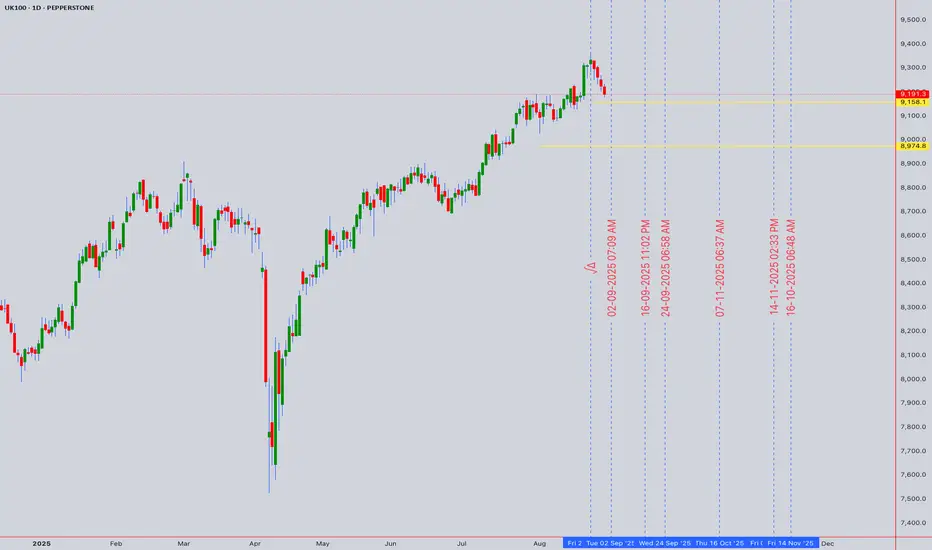
FTSE 100 UK100 Technical Analysis: Weekly Forecast# FTSE 100 UK100 Technical Analysis: Advanced Multi-Timeframe Trading Strategy & Weekly Forecast
Current Price: 9,191.30 (As of August 30, 2025, 11:54 AM UTC+4)
Asset Class: UK100 / FTSE 100 Index
Analysis Date: August 30, 2025
---
Executive Summary
The FTSE 100 Index (UK100) continues to demonstrate resilient performance, trading at 9,191.30 points with solid fundamental support from recent Bank of England policy accommodation. Recent market data shows the GB100 reached 9,199 points on August 29, 2025, maintaining a monthly gain of 0.68% and an impressive 9.82% year-over-year advance. Our comprehensive technical analysis reveals the index is positioned for potential continuation toward the 9,525.47 analytical target by year-end 2025, supported by dovish monetary policy and improving technical confluence across multiple timeframes.
---
Multi-Timeframe Technical Analysis
Elliott Wave Analysis
The FTSE 100 exhibits a complex corrective structure within a larger degree impulse sequence:
Primary Count: Completing Wave 5 of (3) within an extended bull market cycle
Alternative Count: ABC corrective completion transitioning to new impulse
Immediate Target: 9,300-9,400 (Wave 5 extension)
Extended Target: 9,525-9,600 (Major wave completion zone)
Invalidation Level: Break below 8,950 (Wave 4 low)
Long-term Projection: 10,200-10,500 potential by mid-2026
Wyckoff Market Structure Analysis
Current price action demonstrates characteristics of a Wyckoff Re-accumulation Phase:
Phase: Late Stage Re-accumulation with signs of Markup beginning
Volume Analysis: Institutional absorption evident on declines below 9,100
Price Action: Narrowing consolidation ranges with higher low formation
Composite Operator Activity: Smart money accumulation at support levels
Market Structure: Building energy for next major upward movement
W.D. Gann Comprehensive Analysis
Square of 9 Analysis:
- Current price 9,191.30 positioned near significant Gann resistance level
- Next major Gann square: 9,409 (180-degree rotation from recent low)
- Time and price convergence: September 15-22, 2025 (Autumn Equinox influence)
- Critical Gann levels: 9,216, 9,409, 9,604 (geometric progressions)
Angle Theory Application:
- 1x1 Rising Angle Support: 9,050-9,100 (primary trend support)
- 2x1 Accelerated Angle: 9,300-9,400 (next resistance cluster)
- 1x2 Support Angle: 8,850-8,950 (major correction boundary)
- 1x4 Long-term Support: 8,500-8,600 (secular bull market support)
Time Cycle Analysis:
- 84-day cycle completion anticipated: Mid-September 2025
- Seasonal Gann Pattern: September-October historically bullish for UK markets
- Major time window: October 8-18, 2025 (next significant turning point)
- Annual cycle: Year-end strength typically supports FTSE performance
Price Forecasting & Time Harmonics:
- Immediate resistance: 9,240-9,280
- Primary target: 9,350-9,400
- Extended projection: 9,525-9,600
- Time harmony suggests acceleration after September 18, 2025
---
Japanese Candlestick & Harmonic Pattern Analysis
Recent Candlestick Formations (Daily Chart)
Bullish Engulfing: August 26-27 showing strong buying pressure
Piercing Pattern: August 28-29 confirming support at 9,150 level
Long Lower Shadows: Multiple occurrences indicating accumulation
Volume Validation: Increasing volume on up days, declining on down days
Harmonic Pattern Recognition
Bullish Gartley Completion: 9,050-9,150 zone (recent successful test)
ABCD Pattern Active: Targeting 9,375-9,425 completion zone
Potential Butterfly Formation: Monitoring for completion at 9,500-9,600
Fibonacci Confluence: 1.618 extension projects to 9,387 from August low
Advanced Harmonic Analysis
Three Drives Pattern: Currently developing third drive toward 9,400+
Cypher Pattern Potential: Reversal consideration at 9,550-9,650
Deep Crab Formation: Long-term pattern suggesting 9,800+ targets
AB=CD Equality: Multiple time and price relationships converging
---
Ichimoku Kinko Hyo Analysis
Current Cloud Structure (Daily Chart)
Price Position: Above Kumo cloud indicating bullish trend continuation
Tenkan-sen (9-period): 9,167 (short-term dynamic support)
Kijun-sen (26-period): 9,124 (medium-term trend baseline)
Senkou Span A: 9,146 (leading span A - immediate support)
Senkou Span B: 9,087 (leading span B - key cloud support)
Chikou Span: Positioned above historical price action (bullish confirmation)
Future Kumo Analysis (26 periods ahead):
- Ascending cloud formation supporting continued bullish bias
- Future support zone: 9,200-9,300 (forward-looking cloud support)
- Kumo thickness increasing, suggesting strengthening trend
Ichimoku Trading Signals
TK Cross: Tenkan above Kijun (active bullish signal)
Price vs Cloud: Sustained positioning above cloud
Chikou Span Clear: No interference with historical price levels
Cloud Breakout: Recent bullish breakthrough confirmed
---
Technical Indicators Comprehensive Analysis
RSI (Relative Strength Index) Multi-Timeframe
Daily RSI: 62.4 (healthy bullish momentum, room for expansion)
Weekly RSI: 58.7 (positive trend with upside potential)
4H RSI: 65.8 (approaching but not yet overbought)
RSI Divergence Analysis: No bearish divergence detected, momentum intact
Bollinger Bands Analysis
Current Position: Price approaching upper band (9,220 level)
Band Width: Contracting after recent expansion (consolidation phase)
%B Indicator: 0.72 (strong positioning without extreme reading)
Squeeze Indicator: Preparing for next volatility expansion
VWAP Analysis (Volume Weighted Average Price)
Daily VWAP: 9,154 (key dynamic support level)
Weekly VWAP: 9,089 (intermediate support zone)
Monthly VWAP: 9,067 (major trend support)
Volume Profile: Significant acceptance above 9,100 level
Moving Average Structure Analysis
10 EMA: 9,158 (immediate dynamic support)
20 EMA: 9,136 (short-term trend support)
50 SMA: 9,087 (intermediate trend support)
100 SMA: 9,023 (key trend support)
200 SMA: 8,934 (major secular support)
Moving Average Alignment:
- Perfect bullish alignment across all timeframes
- Golden Cross pattern firmly established (50/200 SMA)
- Price trading above all major moving averages
---
Support & Resistance Analysis
Primary Resistance Levels
1. R1: 9,240-9,280 (immediate Gann resistance cluster)
2. R2: 9,350-9,400 (2x1 Gann angle and harmonic completion)
3. R3: 9,525-9,600 (Major Elliott Wave target and analytical forecast)
4. R4: 9,750-9,800 (Long-term harmonic projection)
5. R5: 10,000-10,200 (Psychological and secular targets)
Primary Support Levels
1. S1: 9,124 (Kijun-sen and recent swing support)
2. S2: 9,050-9,100 (1x1 Gann angle and harmonic support)
3. S3: 8,950-9,000 (Elliott Wave invalidation boundary)
4. S4: 8,850-8,900 (1x2 Gann angle and 100 SMA confluence)
5. S5: 8,750-8,800 (Major correction target zone)
Volume-Based Price Levels
High Volume Node: 9,050-9,150 (institutional accumulation zone)
Low Volume Gap: 9,200-9,300 (potential rapid movement area)
Volume Resistance: 9,400+ (historical distribution levels)
POC (Point of Control): 9,125 (maximum volume acceptance)
---
Multi-Timeframe Trading Strategy Framework
Scalping Strategy (5M & 15M Charts)
5-Minute Timeframe Methodology:
Entry Criteria: Pullbacks to 20 EMA with RSI <30 oversold
Profit Targets: 25-40 points per scalping trade
Stop Loss Parameters: 15-20 points maximum risk exposure
Volume Confirmation: Above-average volume required on breakouts
Optimal Time Windows: 8:00-10:00 AM and 2:00-4:00 PM GMT
15-Minute Scalping Framework:
Range Identification: Current consolidation 9,150-9,220
Breakout Methodology: Volume spike confirmation above 9,220
Mean Reversion: Fade extreme moves beyond 2 standard deviations
Risk Management: Maximum 3 positions simultaneously, 1:1.5 minimum R:R
Intraday Trading Strategies (30M, 1H, 4H)
30-Minute Chart Approach:
Trend Following: Long positions above EMA confluence (9,140)
Pattern Recognition: Flag and pennant completions near resistance
Target Methodology: Initial 9,280, extended 9,350-9,400
Risk Parameters: 50-70 point stops, 2:1 reward-to-risk minimum
1-Hour Chart Strategy:
Momentum Confirmation: MACD histogram expansion on bullish crossovers
Support Trading: Long entries from 9,100-9,150 support zone
Breakout Management: Monitor 9,240 level for continuation signals
Session Focus: London session volatility (8:00 AM - 4:30 PM GMT)
4-Hour Swing Framework:
Cloud Strategy: Long positions on successful Ichimoku cloud bounces
Elliott Wave Guidance: Ride Wave 5 extensions toward major targets
Fibonacci Utilization: 38.2% and 61.8% retracements for optimal entries
Position Duration: 2-7 days typical holding period for swing trades
Swing Trading Strategy (Daily, Weekly, Monthly)
Daily Chart Methodology:
Breakout Strategy: Long on sustained breaks above 9,240 with volume
Accumulation Zones: Build positions on tests of 9,050-9,150
Target Sequence: 9,350 → 9,525 → 9,750 progressive profit-taking
Position Management: Scale entries across multiple time frame confirmations
Weekly Chart Perspective:
Primary Trend: Strongly bullish above 8,950 weekly support
Swing Objectives: 9,525-9,600 zone for major profit realization
Risk Assessment: Weekly closes below 8,850 signal trend reversal
Monthly Chart Analysis:
Secular Trend: Multi-year bull market structure intact
Long-term Targets: 10,500-11,000 by 2026-2027 projections
Major Support: 8,200-8,500 (unlikely to test in current cycle)
---
Daily Trading Plan: September 2-6, 2025
Monday, September 2, 2025
Market Status: Full UK trading session
Technical Setup:
Resistance Levels: 9,240, 9,280, 9,320
Support Levels: 9,150, 9,100, 9,050
Expected Range: 9,120-9,260
Trading Strategy:
Morning Session (8:00-12:00 GMT): Monitor for overnight gap analysis
Afternoon Session (12:00-16:30 GMT): Focus on US market correlation
Primary Setup: Long 9,140-9,170 targeting 9,240-9,280
Alternative Setup: Fade any move above 9,280 without volume confirmation
Risk Considerations:
- Bank of England policy speculation impact
- End-of-month institutional flows
- Brexit-related news sensitivity
Tuesday, September 3, 2025
Market Outlook: Post-Labor Day momentum with full global participation
Key Events & Strategy:
UK Economic Data: Manufacturing PMI and construction data releases
Technical Focus: 9,240 breakout attempt with volume validation
Entry Strategy: Long 9,180-9,220 on consolidation completion
Target Areas: 9,300-9,350 on successful breakout scenarios
Risk Management:
- Reduced position sizes due to data event risk
- Monitor GBP/USD correlation for confirmation signals
- Prepare for potential volatility around PMI releases
Wednesday, September 4, 2025
Market Outlook: Mid-week consolidation with building momentum
Strategic Framework:
Technical Pattern: Monitor for bull flag or pennant completion
Volume Analysis: Require institutional participation for sustained moves
Support Testing: Strength of 9,150-9,180 zone crucial for continuation
Momentum Signals: MACD and RSI alignment for directional bias
Trading Approach:
Range Strategy: Buy support, sell resistance until breakout
Breakout Preparation: Position for 9,240+ level clearance
Risk Assessment: Political developments and central bank communications
Thursday, September 5, 2025
Market Outlook: Pre-weekly close positioning dynamics
Key Considerations:
Technical Levels: 9,300-9,350 resistance cluster testing
Institutional Activity: Pension fund rebalancing flows
Pattern Development: Harmonic pattern completion monitoring
Global Correlation: Monitor S&P 500 and DAX for confirmation
Execution Strategy:
Momentum Continuation: Above 9,280 favors 9,400 target
Profit-Taking Zones: Scale out at 9,320, 9,380, 9,425
Risk Management: Tighten stops as resistance approaches
Friday, September 6, 2025
Market Outlook: Weekly close significance and weekend positioning
Final Session Strategy:
Weekly Close Target: Above 9,200 maintains bullish structure
Profit Preservation: Secure gains from successful breakout trades
Gap Risk Management: Prepare for weekend news flow impact
Position Review: Maintain swing positions with appropriate stops
Critical Levels:
Weekly Bullish: Close above 9,220
Weekly Neutral: 9,150-9,220 range
Weekly Bearish: Close below 9,150
---
Macroeconomic & Policy Analysis
Bank of England Policy Impact
The Bank of England's recent monetary policy decisions significantly influence FTSE 100 performance. The Committee voted to reduce Bank Rate to 4% in August 2025, representing continued accommodation that supports equity valuations and corporate profitability across the index.
Interest Rate Environment
The next Bank Rate decision is due on September 18, 2025, with economists and markets expecting at least one more rate cut in 2025. This dovish policy trajectory provides fundamental support for equity market performance.
Economic Growth Outlook
The UK economic environment presents improving conditions with downside domestic and geopolitical risks around economic activity remaining, although trade policy uncertainty has diminished somewhat. This stabilization supports continued FTSE 100 outperformance.
Inflation Dynamics
The Bank of England predicted that inflation would follow a bumpy path and expects it to rise to around 4% in September, but this increase should be only temporary, and inflation should fall back to 2%.
Key Risk Factors
1. Monetary Policy Uncertainty: Timing and magnitude of future rate cuts
2. Global Trade Relations: Post-Brexit trade relationship developments
3. Currency Impact: GBP strength/weakness affecting multinational earnings
4. Energy Sector Exposure: Oil price volatility impacting major components
5. Political Stability: Government policy consistency and business confidence
---
Sector Analysis & FTSE 100 Component Review
Sector Performance Dynamics
Financial Services: Benefiting from interest rate normalization process
Energy Sector: Oil majors providing dividend yield attraction
Consumer Goods: Defensive characteristics supporting index stability
Technology: Limited exposure compared to global peers, potential upside
Healthcare: Pharmaceutical giants providing stability and growth
Dividend Yield Analysis
The FTSE 100's attractive dividend yield continues to support international investor interest, with share buybacks remaining a significant component of shareholder returns supported by robust cash generation of these companies.
Valuation Assessment
There's little doubt that the UK's blue-chip index is undervalued compared with overseas peers, providing fundamental support for continued outperformance and multiple expansion potential.
---
Multi-Asset Correlation Analysis
Currency Relationships
GBP/USD Impact: Inverse correlation with multinational earnings (0.65 negative)
EUR/GBP Influence: European trade relationship effects (0.45 positive)
USD Strength: Dollar appreciation pressures on international revenues
Global Index Correlations
S&P 500 Relationship: Moderate positive correlation (0.58)
DAX Connection: Strong European correlation (0.74)
Nikkei Influence: Asian market sentiment transmission (0.42)
Commodity Exposure
Oil Price Sensitivity: Energy sector weighting creates positive correlation
Gold Relationship: Limited direct exposure, inverse correlation during risk-off
Base Metals: Industrial exposure through mining components
---
Risk Management Comprehensive Framework
Position Sizing Methodology
Scalping Operations: 0.5-1% account risk per individual trade
Intraday Positions: 1-2% maximum account risk exposure
Swing Positions: 2-3% account risk per established position
Maximum Portfolio Exposure: 7% total UK100-related risk allocation
Stop-Loss Implementation
Scalping Stops: 15-25 points maximum loss per trade
Intraday Stops: 50-75 points based on volatility conditions
Swing Trading Stops: Below key support levels (9,050 for current longs)
Technical Invalidation: Elliott Wave and pattern breakdown levels
Profit-Taking Strategy
Scaling Method: Take 30% at first target, 40% at second target, hold 30%
Trailing Stops: Implement after achieving 2:1 favorable risk-reward
Time-Based Exits: Close before major BoE announcements and data releases
Pattern-Based Exits: Honor harmonic and Elliott Wave completion zones
Risk Monitoring Systems
Daily Risk Assessment: Maximum drawdown tolerance 3%
Weekly Risk Review: Position correlation and concentration analysis
Monthly Performance Evaluation: Strategy effectiveness and adjustment needs
Stress Testing: Scenario analysis for major market disruptions
---
Weekly Outlook Probability Matrix
Bullish Scenario (Probability: 70%)
Primary Catalysts:
- Bank of England maintains accommodative policy stance
- UK economic data shows continued stability/improvement
- Technical breakout above 9,240 with volume confirmation
- Global risk-on sentiment supporting equity markets
Price Objectives:
- Initial Target: 9,300-9,350
- Extended Target: 9,400-9,525
- Optimistic Scenario: 9,600+
Supporting Factors:
- Dividend yield attraction for international investors
- Undervaluation relative to global peers
- Technical momentum building across timeframes
Neutral/Consolidation Scenario (Probability: 20%)
Characteristics:
- Range-bound trading between 9,100-9,280
- Mixed economic signals and policy uncertainty
- Technical indecision at key resistance levels
- Reduced trading volumes and institutional activity
Trading Parameters:
- Upper Range: 9,250-9,280
- Lower Range: 9,100-9,150
- Strategy Focus: Range trading and volatility contraction plays
Bearish Scenario (Probability: 10%)
Risk Catalysts:
- Unexpected hawkish shift from Bank of England
- Significant deterioration in UK economic indicators
- Major geopolitical shock or financial system stress
- Technical breakdown below critical support at 9,050
Downside Objectives:
- Initial Target: 8,950-9,000
- Extended Target: 8,800-8,850
- Stress Scenario: 8,600-8,750
---
Advanced Trading Techniques & Market Microstructure
Order Flow Analysis
Institutional Activity: Large block trades above 9,150 indicate accumulation
Retail Sentiment: Contrarian indicator showing excessive bearishness
Options Market: Put/call ratio neutral, no extreme positioning detected
ETF Flows: Consistent inflows into UK equity ETFs supporting demand
High-Frequency Trading Considerations
Algorithmic Support: 9,150-9,180 zone shows HFT buying interest
Liquidity Zones: Deep liquidity above 9,200 and below 9,100
Speed of Execution: Critical during London market open and close
Spread Dynamics: Tightening spreads indicating improving liquidity
Options Market Intelligence
Gamma Exposure: Positive gamma above 9,180, negative below 9,100
Key Strike Concentrations: 9,200 calls and 9,100 puts high open interest
Implied Volatility: Currently underpriced relative to realized volatility
Options Skew: Slight put premium indicating modest hedging activity
---
Seasonal & Cyclical Analysis
Historical Seasonal Patterns
September Performance: Historically mixed, average +0.8% monthly return
Q4 Seasonality: Strong fourth quarter performance, average +4.2%
Year-End Effects: Portfolio rebalancing typically supports FTSE 100
Dividend Calendar: Major distributions in Q1 and Q3 affecting flows
Economic Cycle Positioning
Current Phase: Late cycle expansion with monetary accommodation
Sector Rotation: Value sectors outperforming growth in current environment
Interest Rate Cycle: Declining rate environment supporting equity multiples
Credit Cycle: Stable credit conditions supporting corporate expansion
---
Technology & Innovation Impact
Fintech Integration
Digital Banking: Major FTSE components adapting to digital transformation
Payment Systems: Evolution affecting traditional banking models
Regulatory Technology: Compliance costs and operational efficiency factors
Cryptocurrency Influence: Limited direct exposure, regulatory developments
ESG Considerations
Environmental Standards: Increasing focus on sustainability metrics
Social Governance: Stakeholder capitalism trends affecting valuations
Regulatory Compliance: ESG reporting requirements and investment flows
Transition Risks: Energy transition affecting traditional sector weights
---
Conclusion & Strategic Outlook
The FTSE 100 Index (UK100) presents a compelling technical and fundamental investment case with multiple confluences supporting continued upside momentum toward the analytical forecast target of £9,525.47 by the end of 2025. The combination of accommodative Bank of England policy, attractive dividend yields, and constructive technical patterns creates a favorable risk-reward environment.
Critical Success Factors:
1. Monetary Policy Support: Continued BoE accommodation through 2025
2. Technical Breakout Confirmation: Sustained move above 9,240 with volume
3. Economic Stability: UK data showing resilience and gradual improvement
4. Global Risk Environment: Maintained risk-on sentiment supporting equities
Key Monitoring Priorities:
1. September 18 BoE Decision: Next policy rate announcement impact
2. Technical Level Behavior: Price action at 9,240-9,280 resistance cluster
3. Volume Patterns: Institutional participation in breakout attempts
4. Global Correlation Changes: Relationship dynamics with major indices
Strategic Recommendation:
Maintain constructive bias with tactical flexibility, emphasizing disciplined risk management while positioning for probable continuation of the multi-year bull market in UK equities. The September 15-22 Gann time window represents a critical juncture for intermediate-term directional confirmation.
The confluence of technical, fundamental, and policy factors suggests high probability for achieving the 9,400-9,525 target zone within the forecast timeframe, while downside risk appears well-contained above the 9,050 support complex.
---
*This comprehensive analysis is provided for educational and informational purposes only. It does not constitute investment advice, and readers should conduct their own research and consult with qualified financial professionals before making investment decisions. Always implement appropriate risk management strategies and position sizing methodologies.*
---
For individuals seeking to enhance their trading abilities based on the analyses provided, I recommend exploring the mentoring program offered by Shunya Trade. (Website: shunya dot trade)
I would appreciate your feedback on this analysis, as it will serve as a valuable resource for future endeavors.
Sincerely,
Shunya.Trade
Website: shunya dot trade
Disclaimer: This post is intended solely for educational purposes and does not constitute investment advice, financial advice, or trading recommendations. The views expressed herein are derived from technical analysis and are shared for informational purposes only. The stock market inherently carries risks, including the potential for capital loss. Therefore, readers are strongly advised to exercise prudent judgment before making any investment decisions. We assume no liability for any actions taken based on this content. For personalized guidance, it is recommended to consult a certified financial advisor.
FTSE SHORTThere is an ABCD pattern on M30
All timeframes are overbought on RSI
There are multiple tops on all timeframes with divergence
Great resistance at this level
Stoploss above 9200

Potential Buy Zone on FTSEI have several swing trade zones marked up on the FTSE, here's one of them.
Potential Buy Zone for the FTSEI have several swing trade zones marked up on the FTSE, here's one of them.

Two reasons to sell FTSE Right NOWWe are seeing some reasons to sell FTSE right now.
1) The daily trend is down.
2) H4 is pointing down, but the price is above the MA
3) There are two patterns to sell at the current level
4) 8165 is the last weeks high that will be a good resistance
Hoping for a test of last week's lows.

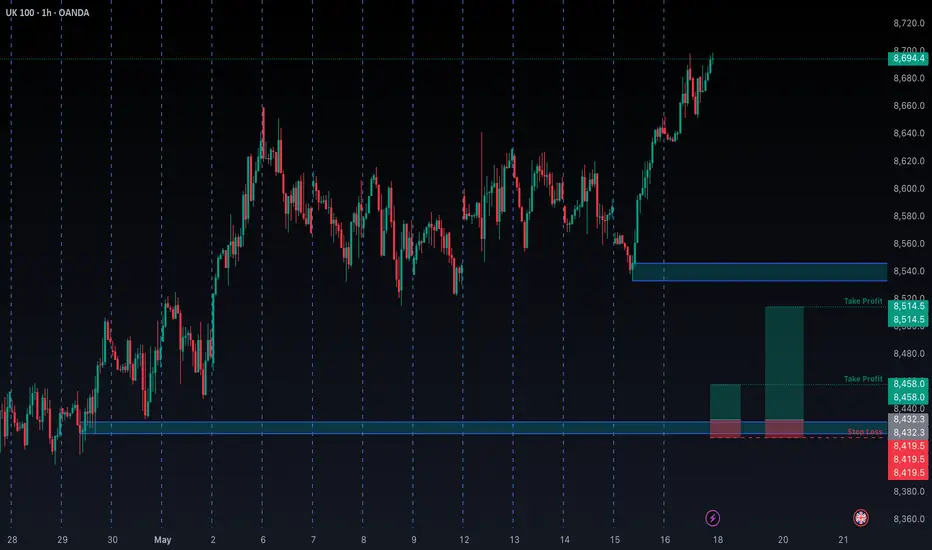
FTSE UK100 Rebound: Navigating Fragile Markets & Resistance Zone📊 FTSE 100 Recovery in Focus: The FTSE 100 has bounced back 📈 after a sharp sell-off, showing signs of recovery. Here's a breakdown of the key points to consider:
📉 Recent Performance: After a steep 4.4% drop on Monday, the FTSE 100 rebounded by 1.9% (+144.29 points) to 7846.37. This recovery mirrors improved global market sentiment 🌏, with indices like the Nikkei 225 surging 6% 🚀 (source: Evening Standard).
🌍 Market Sentiment: Analysts warn that the recovery remains fragile ⚠️, with risks of volatility stemming from geopolitical tensions and trade concerns. However, bargain-hunting investors 🛒 have supported the rebound by targeting undervalued stocks.
📈 Technical Levels: The FTSE 100 is climbing from multi-month lows, with momentum suggesting a potential test of resistance levels. But the rally's sustainability hinges on broader market sentiment and key economic data 📊 (source: Saxo Group).
🧐 Analyst Views: While the recovery is promising, some experts caution it could be a "dead cat bounce" 🐱, where the rally fizzles out if negative news arises. This makes short-term trading decisions highly dependent on intraday developments.
💡 Trade Setup: With the current momentum, a buying strategy for a day trade 🎯 targeting resistance levels may be more favorable than selling at the current level. However, traders must closely monitor intraday sentiment and technical indicators to manage risks effectively.

IAG Additional Price Levels • LSE • Airlines Group Stock • FTSE⚠️ IAG Going to plan, looks like it's a TRUMP DUMP 🤣
Now is the TIME TO HUNT the stocks for your PORTFOLIO.
ℹ️ When TRUMP causes a DUMP I accumulate SIT BACK and just WAIT fornthe PUMP...🚀
These additional price levels will be used as an additional filter to TIME an ENTRY ONLY IF the BIDS come in 🟢SeekingPips🟢 NEEDS to see some VOLUME🚀🚀🚀

IAG Airlines Group what next? $261 Reached & Breached! $172?🤔 IAG Airlines Group what next?
ℹ️ $261 Reached & Breached!
Will the $261 be regained and start to offer some support or is $172 NEXT?❓️❔️❓️
🌍 To be completely transparent I have no horse in this race at the moment BUT I really would like a serious flush to try and accumulate a long-term POSITION.
🟢SeekingPips🟢 is not interested at current price at all unless we start to see some SERIOUS VOLUME START TO COME IN TO PLAY

IAG Stock Took some heat! Is there anything to take here?🟢SeekingPips🟢 has this on the radar.
⭐️ Have your levels ready and wait for your A+⭐️ Setup.
ℹ️ Our levels are here marked out.
I have ZERO interest in taking a position here however a deeper sell-off and I will start paying attention.❗️
⚠️ ALERTS set and LEVELS marked.
🟢Now go away and ENJOY your WEEKEND and lets HURRY UP AND WAIT and lets see what NEXT WEEK has for us👍

FTSE 100: Can April's Seasonal Surge Overcome Fiscal Tightening?🌸 April: A Historically Bullish Month for the FTSE 100 📈
Over the past 25 years, April has consistently been the strongest month for the FTSE 100, delivering an average return of 2.28% and boasting a 76% win rate. 🌟 This seasonal strength is driven by several key factors:
📊 Earnings Season Momentum: April is a pivotal month for corporate earnings, with many FTSE 100 companies benefiting from a post-first-quarter earnings boost. 💼
💷 Fiscal Year-End Flows: UK-based funds often adjust their portfolios at the end of the tax year in early April, leading to a reallocation into equities. 🔄
💸 Dividend Reinvestment: As a high-dividend-yielding index, the FTSE 100 typically experiences dividend reinvestment flows in April, further supporting stock prices. 📈
Despite the challenging macroeconomic environment, these seasonal drivers suggest that the FTSE 100 could maintain its historical trend of strong April performance. Notably, even in years with intra-period declines of up to 6.88%, the index has managed to deliver positive returns during this period. 💪
🇬🇧 UK Fiscal Policy and Market Implications 💡
This year, the bullish seasonal trend for the FTSE 100 coincides with significant fiscal developments. On March 26, UK Chancellor Rachel Reeves delivered the Spring Statement, outlining measures to stabilize public finances amidst mounting economic pressures. 📜 According to the Office for Budget Responsibility (OBR), the UK is at risk of missing key fiscal targets, prompting the government to model spending cuts of up to 11%. Welfare programs and green investments 🌱 are expected to bear the brunt of these reductions.
Additionally, the Bank of England's stance on inflation remains a critical factor. 📉 Persistent inflation risks could lead to a more hawkish monetary policy, potentially weighing on rate-sensitive sectors within the FTSE 100. However, the index's strong seasonal pattern, driven by earnings momentum, fiscal year-end flows, and dividend reinvestments, provides a counterbalance to these headwinds. ⚖️
🔮 Outlook for April 2025 🌟
As of late March 2025, the FTSE 100 has shown resilience, with sectors such as energy ⚡ and homebuilders 🏠 leading gains ahead of the Spring Statement. While fiscal tightening and inflationary pressures present challenges, the historical strength of April, combined with supportive seasonal factors, suggests that the FTSE 100 could still deliver positive returns this month. 📅 Investors will closely monitor the impact of fiscal policy adjustments and the Bank of England's monetary stance as they navigate this critical period. 🧐
Not Financial Advice.

World-wide Bull Markets StartingI just wanted to share some of the major markets outside the US are starting major bull markets. Especially we should highlight Japan and the Nikkei is set to break and run from it's 1989 all time high. UK's FTSE is also also breaking above the range it's been in for almost the last 30 years. It's quite exciting! I would expect China to eventually follow suit and break it's two decade long range.
Good luck!

FTSE reacts to upbeat UK Retail Sales dataThe FTSE (UK100) index price action sentiment appears bullish, supported by the longer-term prevailing uptrend. UK Equity index is digesting upbeat retail sales, hot inflation, and strong wage growth data.
The key trading level is at 8648, a swing low. A corrective pullback from the current levels and a bullish bounce back from the 8648 level could target the upside resistance at 8750 followed by the 8800 and 8850 levels over the longer timeframe.
Alternatively, a confirmed loss of 8648 support and a daily close below that level would negate the bullish outlook opening a way for a further retracement and a retest of 8590 support level followed by 8495.
This communication is for informational purposes only and should not be viewed as any form of recommendation as to a particular course of action or as investment advice. It is not intended as an offer or solicitation for the purchase or sale of any financial instrument or as an official confirmation of any transaction. Opinions, estimates and assumptions expressed herein are made as of the date of this communication and are subject to change without notice. This communication has been prepared based upon information, including market prices, data and other information, believed to be reliable; however, Trade Nation does not warrant its completeness or accuracy. All market prices and market data contained in or attached to this communication are indicative and subject to change without notice.
