FTT MEGA BULLISH1. FTT/BTC breaking all time highs
2. FTT/USDT above the major resistance/pivot point
3. Breaking of the ichimoku will 100% confirm the moonshot
4. Probably IPO soon lol
WAGMI
-Nav
FTTUSD

FTT profit 30% after 4h BULL signal - time to short? Please Like or Follow if you enjoyed this content.
UPDATE: The price pumped 30% after Bull signal. Currently on the verge of breaking support at 43.50 USDT. If support doesn't hold, 42 USDT is next support.
This analysis is made with my "Supertrend Ninja" indicator. When the background of the candlestick closes green (vertical line). It indicates a possible bullish (up)trend. A red background indicates a possible bearish downtrend. Currently FTT is still in a downtrend.
Supports and Resistances are highlighted as grey blocks. Profits can be taken at each grey block. Supports and resistances are automatically drawn using my indicator "Yo Show Me Some Support - and Resistances". Pun intended.
Thank you for reading.
Namasté 🙏
What Indicators Do I Use:
In the chart I am using my "Supertrend Ninja - indicator", which is a trend-following indicator (Green and red vertical line with arrows). When the background of the candlestick closes green (vertical line) with an upwards pointing pink arrow. It indicates a possible bullish (up)trend.
With each trade proper risk management is essential. Either by using my script "Trailing Stoploss Bottom Activation indicator", visible as grey dots below the candles. Which sends an alert, when current price goes below the previous candle low. Or using my "HA Trailing Stoploss Activation", the indicator below with green and red blocks. Or third option, exit when the Supertrend Ninja indicator displays a vertical red line with a downwards pointing black arrow. Remember, the first stop(loss) is always the cheapest stop.
Disclaimer: Ideas are for entertainment purposes only. Not financial advice. Your own due diligence is highly advised before entering trades. Past performance is no guarantee of future returns.

FTTUSDT, We started new rallyHello everybody
FTT is one of the most popular exchange tokens in the world.
According to the chart you can see the price was moved in correction-downward trend to recover the last upward wave that was made.
At this time according you can see on chart, the correction wave was moving in downward trend and because of the reaching to the PRZ level we think the wave C was completed and we are making wave 1 of 5 in elliott and in price action.
We need some pullback (a little) because of the momentum, and then the price is ready to move upwards and to the new target and new ATH.
You can take position and buy in pullback then wait until the price reach to the top of the channel and its ready to move more upwards.
If you wanna learn technical & fundamental in professional level send us messages in private. ( You can take our id from profile )
Good Luck
Abtin

Bullish Divergence on FTT!This chart is in the linear form! However, FTT just broke bearish trend line in the candlestick chart.
If we close the daily above that trendline, We can expect FTT to target higher prices.
Next targets:
$48, $53 and $59.
Let me know what you think. Please follow me and like this post!

FTT/USDT 1DFTT/USDT 1D
Breaking throw a resistance line
------------
--------
------
-----
-
-
-
-
-
-
-

FTT/USDT - Potential 64% SetupHello Traders!
FTT corrected together with the market, the price came to the buyers' interest zone of $34.60 - $41.90
After exiting from correction, it is possible to count on the high-grade rebound.
We can consider an entry into the position in the range of $40.00 - $41.90
Closing of a position using a stop-loss can be considered in case of price leaving under the level of $33.00
The targers will be price levels of
$54,00
$61,40
$65,75
Good luck and watch out for the market
P.S. This is an educational analysis that shall not be considered financial advice

buy FTT in 2 StepEnter the first step weaker
Enter the second step stronger
Stop Loss is your best friend

Nearly done the third waveMy angle, I see the third wave is not hit 1.618 Fib of the first wave. So I think FTX:FTTUSD is still in the third wave.
After that, a pullback to the fourth wave.


Long or short, up to youOn daily chart, we have the complete impulse wave at $85.
Easily, we can see FTX:FTTUSD which has been going down to $36 and pull back.
Why not the correction wave ABC, because wave C is over 1.236 Fib wave A. So that is the third wave.
Conclusion, we are waiting for the fourth and fifth wave.
-----
Open long order or short order, up to you.
Wait and see!
Leave a comment


FTT uptrend lineFTT / USDT
FTX TOKEN try to find some support here around the uptrend line
As long as price hold support priority is bullish
Keep your eye on it

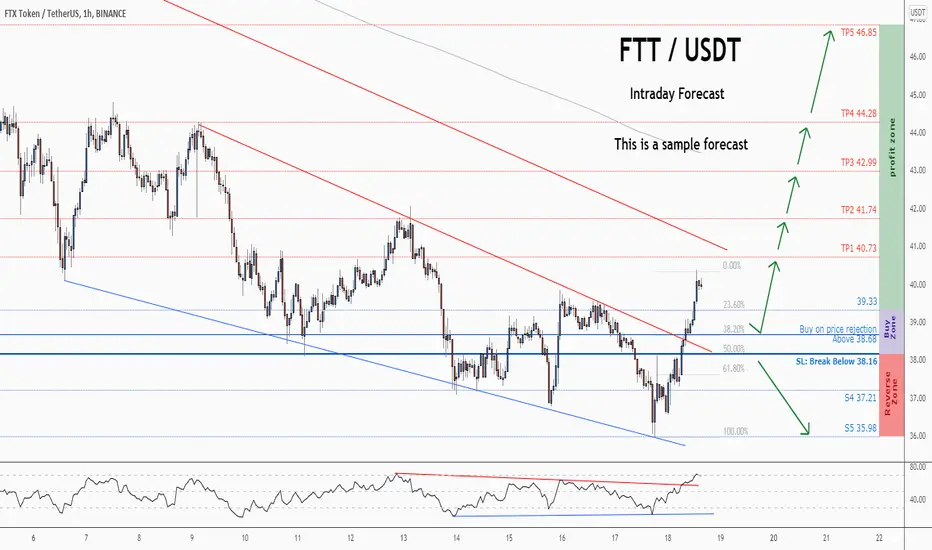
💡Don't miss the great buy opportunity in FTTUSD @FTX_OfficialTrading suggestion:
". There is a possibility of temporary retracement to the suggested support line (38.68).
. if so, traders can set orders based on Price Action and expect to reach short-term targets."
Technical analysis:
. FTTUSD is in a range bound, and the beginning of an uptrend is expected.
. The price is below the 21-Day WEMA, which acts as a dynamic resistance.
. The RSI is at 68.
Take Profits:
TP1= @ 40 .73
TP2= @ 41.74
TP3= @ 42.99
TP4= @ 44.28
TP5= @ 46.85
SL= Break below S2
❤️ If you find this helpful and want more FREE forecasts in TradingView
. . . . . Please show your support back,
. . . . . . . . Hit the 👍 LIKE button,
. . . . . . . . . . Drop some feedback below in the comment!
❤️ Your support is very much 🙏 appreciated!❤️
💎 Want us to help you become a better Forex / Crypto trader?
Now, It's your turn!
Be sure to leave a comment; let us know how you see this opportunity and forecast.
Trade well, ❤️
ForecastCity English Support Team ❤️
💡Don't miss the great buy opportunity in FTTUSD @FTX_OfficialTrading suggestion:
". There is a possibility of temporary retracement to the suggested support line (38.68).
. if so, traders can set orders based on Price Action and expect to reach short-term targets."
Technical analysis:
. FTTUSD is in a range bound, and the beginning of an uptrend is expected.
. The price is below the 21-Day WEMA, which acts as a dynamic resistance.
. The RSI is at 68.
Take Profits:
TP1= @ 40.73
TP2= @ 41.74
TP3= @ 42.99
TP4= @ 44.28
TP5= @ 46.85
SL= Break below S2
❤️ If you find this helpful and want more FREE forecasts in TradingView
. . . . . Please show your support back,
. . . . . . . . Hit the 👍 LIKE button,
. . . . . . . . . . Drop some feedback below in the comment!
❤️ Your support is very much 🙏 appreciated! ❤️
💎 Want us to help you become a better Forex / Crypto trader ?
Now, It's your turn !
Be sure to leave a comment; let us know how you see this opportunity and forecast.
Trade well, ❤️
ForecastCity English Support Team ❤️


FTTBTCIt was long wave for correction wave and there is triangle back trend with divergence, i think its last wave of triangle of wave A and after that the price can back to up.it can affect on FTTUSDT

sam ponzi to 126sam's original ponzi is going to benefit from solana's bonanza, as solana is just the unofficial ponzi of ftx and alameda research. buy this ponzi, it's well baked to make it yum yum

Is FTT going to $90 ?If BTC stays calm...
If the blue channel breaks out up ($50), its going to $60.
If it comes to $60, that is mean the orange triangle will break out up, the price would be $90 around.

BNB 10x CZ gang or SAM GANG 20xBNB 10x CZ gang or SAM GANG 20x
Sam gang whatup
So will FTT do what BNB did in 17? yeh prob.
Also this is one of those MUCH SAFER 10-20x than your favorite s&*^coin.
seems my last idea with this theory in mind was a bit early. i tend to do that.
LFG

💡FTTUSDT ANALYSIS💡HELLO FRIENDS
Technically, when we look at the chart in 4 hours, the butterfly bull formation ( Bullish Butterfly ) has been formed.
It is very risky to enter the trade before the voluminous momentum comes. Risk money management is very important in such transactions.
There are technical levels on the chart.
TP1: 60.78
TP2: 70.09
Trade entry level:51.20 (at the closing of the 4-hour candle)
Stop loss: 43.18 (based on my own money management)
IT IS NOT INVESTMENT ADVICE. IF YOU
BENEFIT FROM ANALYSIS, DON'T FORGET
TO LIKE AND FOLLOW 👍👍👍👍 IF THERE IS SOMETHING WRONG WITH THE FORMATION, YOU CAN ALSO BE AWARE.
📗📗EDUCATIONAL PURPOSES📗📗
Butterfly BOG Formation ( Bullish Butterfly )
D levels to the level of retraction, the leg should be 127,2's% of X or a rate of 161.8%.
• Point D must be below point X.
• Moving from point A to point D, a valid ABCD pattern should be observed.
• Triangles XAB and BCD must be proportional in time. Ideally, the time spent in the formation of these two triangles should be equal.
This is true if it is not BCD Renders the triangle in terms of time when xab UCG 61.8% with 161.8% can be between

FTTUSDT-LONGThere is a long position in FTTUSDT
Futures-Spot FTTUSDT FTX Token
🔵Long Now or set on Key Level 50.60
🟢Target 1 52.90
🟢Target 2 55.25
❌Stop loss 49.20
#K_Level

FTT LONG 20211020Signal: Red -> Green
Confirmation: Break Through the Resistance Line
DISCLAIMER
This is only a personal opinion and does NOT serve as investing NOR trading advice.
Please make your own decisions and be responsible for your own investing and trading Activities.

FTT/USDTesting/tracking elliot wave theory. Please do not trade off idea without S/L. Not financial advice.
