NZD/JPY - Triangle Breakout (23.06.2025)The NZD/JPY Pair on the H1 timeframe presents a Potential Selling Opportunity due to a recent Formation of a Triangle Breakout Pattern. This suggests a shift in momentum towards the downside in the coming hours.
Possible Short Trade:
Entry: Consider Entering A Short Position around Trendline Of The Pattern.
Target Levels:
1st Support – 86.35
2nd Support – 86.00
🎁 Please hit the like button and
🎁 Leave a comment to support for My Post !
Your likes and comments are incredibly motivating and will encourage me to share more analysis with you.
Best Regards, KABHI_TA_TRADING
Thank you.
Disclosure: I am part of Trade Nation's Influencer program and receive a monthly fee for using their TradingView charts in my analysis.
Fundamental-analysis

XAUU-USD chart it will go back upwardXAUUSD Buy Setup Active 🟢💰
Gold is holding strong above key support – currently trading at 3355. We’ve entered a Buy position expecting continued bullish momentum in the market.
📍 Entry: 3355
🎯 Targets: 3420 – 3450 – Final Target 3400
🛑 Stop Loss: 3325 (below recent structure low)
With global uncertainty and technical strength aligning, this move could push gold higher in the coming sessions.
Stay alert, manage risk, and follow the trend until reversal confirmation. 🧭📈
#XAUUSD #GoldTrade #ForexTrading #BuySetup #TradingViewAnalysis #MarketUpdate

XAUUSD – Are the Bulls Back? Key Reversal Zone in PlayXAUUSD – Are the Bulls Back? Key Reversal Zone in Play
Gold has been consolidating in a tight range for several sessions, but both macro and technical indicators are pointing to a potential breakout. With volatility expected to rise, traders should keep a close eye on these high-probability zones.
🌍 Macro Overview – Is the Tide Turning for Gold?
📉 The Fed remains hawkish, but market sentiment has shifted, with over 65% probability priced in for a rate cut in September. This adds pressure on the dollar and offers upside potential for gold.
💸 10-year US Treasury yields are stabilizing, reducing the opportunity cost of holding gold and reigniting interest from risk-averse investors.
⚠️ Ongoing geopolitical risks in the Middle East and Eastern Europe continue to fuel demand for safe-haven assets.
🏦 Central banks, especially in China and India, are steadily increasing their gold reserves — a bullish long-term signal for the market.
📊 Technical Outlook – Watch the Fair Value Gap (FVG)
The 3325–3327 support zone aligns with an unfilled FVG on H1-H4 charts, providing a key area for bullish momentum to resume.
Sustained price action above this level may open a path toward 3360 and beyond.
Conversely, if price reaches the 3398–3400 resistance area and shows signs of exhaustion, it could trigger a short-term pullback.
✅ Trade Setup
🟢 BUY ZONE: 3327 – 3325
SL: 3320
TP Targets: 3330 → 3335 → 3340 → 3345 → 3350 → 3355 → 3360 →
🔴 SELL ZONE: 3398 – 3400
SL: 3405
TP Targets: 3395 → 3390 → 3386 → 3380 → 3375 → 3370 → 3360
⚠️ Final Thoughts
The gold market is approaching a decision point... With the PCE and US GDP data due this week, traders should expect a potential volatility spike.
Risk management remains key — wait for confirmation at key levels, stick to your plan, and don’t let emotions override discipline. This week could offer strong directional moves for gold, but only for those prepared.

Fundamental Market Analysis for June 23, 2025 EURUSDThe EUR/USD exchange rate fell to around 1.14900 at the start of the Asian session on Monday. The US dollar is strengthening against the euro (EUR) amid US President Donald Trump's decision to join Israel's war against Iran, which has sharply escalated the conflict. Traders will closely monitor developments surrounding the conflict in the Middle East.
Over the weekend, the US entered the conflict between Israel and Iran when American military aircraft and submarines struck three Iranian targets in Iran, Fordow, Natanz, and Isfahan. Trump said Iran's key uranium enrichment facilities had been “totally destroyed” and warned of “much more severe” strikes if Iran did not agree to peace. The rise in tensions following the US bombing of Iranian nuclear facilities is contributing to the rise in safe-haven currencies such as the US dollar and is having a negative impact on the major currency pair.
Earlier this month, the European Central Bank (ECB) cut interest rates for the eighth time this year to support the eurozone's sluggish recovery, but made it clear that there would be a pause in July. ECB President Christine Lagarde said that rate cuts are coming to an end, as the central bank is now “well positioned” to deal with the current uncertainty. The ECB's hawkish tone may help limit the euro's losses in the near term.
Trading recommendation: BUY 1.15000, SL 1.14600, TP 1.15800

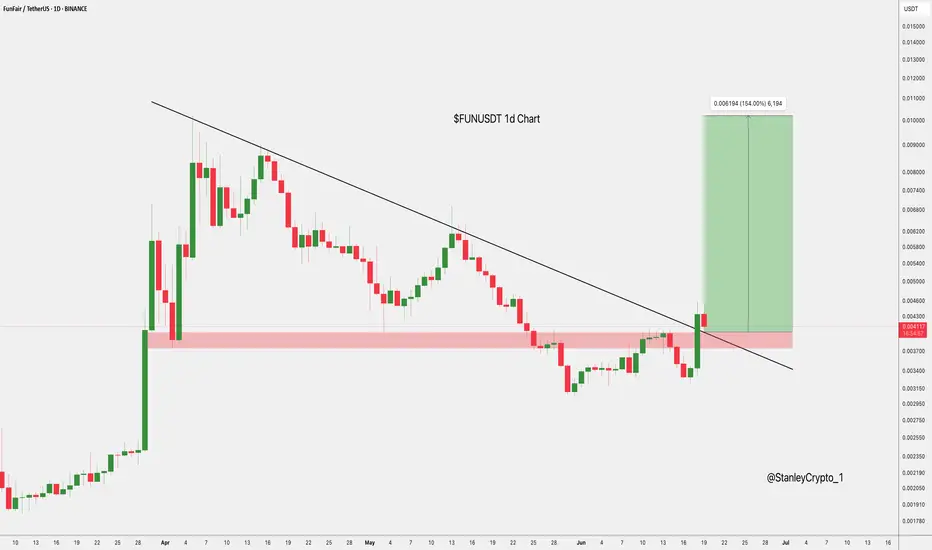
$FUNUSDT Breakout Setup NYSE:FUN has broken out of a long-term downtrend with strong bullish momentum.
It’s now retesting the breakout zone, which also aligns with a key support area.
If this level holds, the next target is 0.010199, a potential 154% move.
Clean breakout-retest setup in play.
DYRO, NFA
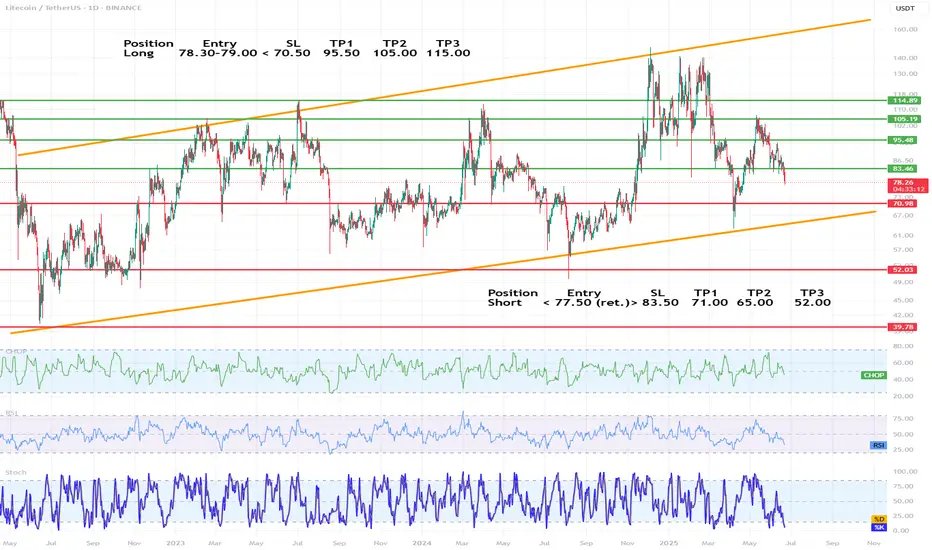
LTC/USDT chart technical analysis (1D)🔷 1. Trend and market structure
🔺 Main channels:
The chart is moving in an ascending channel (orange lines), the lower and upper limits of which have been respected since mid-2022.
The current price (around 78.3 USDT) is in the middle range of the channel, with a downward trend in recent weeks.
🔁 Market phase:
The price is in consolidation in a broader uptrend.
The last upward swing did not break through the previous peak (~135 USDT), which may indicate weakening momentum.
🔷 2. Key horizontal levels (support/resistance)
✅ Resistance levels (green lines):
83.46 USDT – the nearest resistance, currently being tested from below.
95.48 USDT – strong resistance from March-April 2024.
105.19 USDT – a level tested many times in the past.
110.00 USDT – a psychological level.
115.83 USDT – a local high from December 2023.
🛑 Support levels (red lines):
78.30 USDT – currently tested support level.
70.98 USDT – a key defensive level for bulls.
52.03 USDT – strong historical support.
39.78 USDT – the last line of defense, consistent with the lows from 2022.
📐 Dynamic support (orange line):
The lower boundary of the ascending channel – currently falls around 65 USDT and increases over time.
🔷 3. Technical indicators
📊 CHOP (Choppiness Index)
Oscillates near the lower values → the market is starting to leave the consolidation phase.
Potential directional movement soon, most likely downward (due to momentum).
📉 RSI (Relative Strength Index)
RSI below 50, currently around 40–45 → supply advantage.
Not oversold yet, but momentum is downward.
🔄 Stochastic
Well below 20, i.e. in the oversold zone.
Potential for a short-term bounce, but it can also go lower with a stronger sell-off wave.
🔷 4. Technical scenarios
🟢 Growth scenario (long):
Condition: Defending the level of 78.3 USDT and a quick return above 83.46.
Targets:
TP1: 95.48
TP2: 105.19
TP3: 115.83 (upper border of the channel)
SL: below 70.98 USDT
🔴 Bearish scenario (short):
Condition: Break 78.3 and retest as resistance.
Targets:
TP1: 70.98
TP2: 65 (lower channel line)
TP3: 52.03 (large accumulation zone)
SL: return above 83.46
🔷 5. Swing strategy proposal
Long
Entry 78.30–79.00
SL < 70.50
TP1 95.50 TP2 105.00 TP3 115.00
Short
Entry < 77.50 (ret.)
SL > 83.50
TP1 71.00 TP2 65.00 TP3 52.00
🔷 6. Additional comments
It is worth observing the price reaction at 70.98 USDT - this could be a capitulation level or a strong rebound.
The formation on the daily chart resembles a head and shoulders (H&S) - a warning signal for bulls.
BTC/USD (4-hour interval)📈 BTC/USD
🕒 Interval: 4H
1. General trend
We are observing a medium-term downtrend.
Since June 10 (middle vertical line), the price has been systematically creating lower highs and lower lows.
Current price: approx. USD 102.625.
2. Formation and Price Action
🔻 Left side of the chart (May 20 - June 10):
Volatility, no clear direction, but local highs are formed in the area of USD 111,000 - 112,500.
Consolidation from May 27 to June 2.
🔻 Right side of the chart (after June 10):
A clear breakout from the consolidation downwards.
A potential correction or continuation of the downward movement is currently forming.
The last candles suggest a strong downward impulse, and the current candle has a long lower shadow – a possible demand reaction.
3. Technical levels
📉 Resistance:
$112,400 – local peak from June 10.
$109,000 – $109,500 – area of previous consolidations.
$107,000 – lower limit of previous support.
📈 Support:
$102,000 – currently tested level.
$100,000 – psychological support level.
$97,000 – potential range of further declines.
4. Stochastic RSI (oscillator at the bottom of the chart)
The indicator currently shows the intersection of the %K and %D lines in the oversold zone.
This may suggest a short-term upward rebound – but in the context of a downtrend, this may just be a correction.
5. Candles and price action
The last candle has a long lower shadow and a close close to the maximum – this may indicate buyer pressure in this zone.
No confirmation of a reversal – only the closing of a bullish candle and a breakout above USD 103,500–104,000 may give a signal of a larger rebound.
6. Scenarios
✅ Bullish scenario (short-term):
Rebound from the USD 102,000 zone.
Test of USD 103,500–104,000 (local resistance).
If broken – a move towards USD 107,000 is possible.
❌ Bearish scenario (continuation):
Breakout of support at USD 102,000.
Movement towards the psychological level of 100,000 USD.
Possible escalation of declines on increased volume.
7. Signals to watch
Price behavior in the area of 102k USD - a key place to react.
Volume indicators (not visible here) could confirm the direction of the movement.
Will stochastic RSI give a full buy signal? (%K line above %D, both coming out of the oversold zone).

USDCHF 15M ANALYSISThe analysis of my next trade works like this
Our entry is: BULLISH
(1) The 4H trendline broke
(2) We retested the 4H support
(3) We wait for a break and retest of our most recent 15 minute support
(4) We comfirm the bullish direction with our volume indicator (we want to see big volume that surprasses the 20 ema that is included in the volume indicator) and a bullish candlestick close.
IF YOU LIKED THE ANALYSIS PLEASE DROP A FOLLOW

BTCUSD – At a Make-or-Break LevelBTCUSD – At a Make-or-Break Level: Will Bitcoin Rebound or Slide Further?
Bitcoin continues to hover near a critical support level after last week's sharp drop. With rising macro uncertainty, shifting institutional flows, and growing interest in crypto regulation, BTCUSD is showing signs of a potential reversal — but traders should proceed with caution.
🌐 Macro Outlook – Debt Pressure, ETFs & Election Talk Fuel Uncertainty
US fiscal stress is building: Analysts warn that the United States could see interest payments exceed $1 trillion in 2025 — more than its defense or healthcare budget. This puts pressure on the Federal Reserve to consider fiscal tightening instead of rate cuts.
Spot Bitcoin ETF inflows are slowing: After a strong start in early 2024, institutional flows into spot BTC ETFs have cooled down recently. Hedge funds and asset managers are waiting for more clarity on economic policy.
Pro-crypto narratives gaining traction in US politics: With elections approaching, political figures are floating proposals to use Bitcoin as a strategic reserve asset and encourage crypto-based financial infrastructure.
Meanwhile, the US Dollar Index (DXY) remains volatile. A weaker dollar could support crypto, but stronger-than-expected inflation data may fuel further caution.
📉 Technical Analysis (BTCUSD – H1 to H4)
BTC is currently trading within a medium-term descending channel, and has recently tested the key support zone near 103,108.
A potential V-recovery pattern is forming. If buyers can hold this zone and break above 104,184, the price may target 106,047 and eventually 107,586.
However, EMA clusters (50–100–200) on the H1 chart are still pressing downward. A confirmed bullish reversal would require a breakout above 105,200 with strong volume.
✅ Suggested Trade Plan
🟢 BUY ZONE: 103,100 – 103,300
Entry: On price reaction with confirmation candlestick
SL: 102,600
TP: 104,184 → 106,047 → 107,586
🔴 SELL ZONE: 107,500 – 107,800
Entry: Only if price rejects resistance at upper channel
SL: 108,200
TP: 106,000 → 104,500
⚠️ Avoid aggressive shorting in the current range to reduce false breakout risk.
💬 Final Thoughts for Indian Traders
The current market is caught between macroeconomic caution and long-term crypto optimism. Bitcoin is holding near its lower range — a zone that historically triggers upward momentum.
For Indian traders, the key is to wait for clear structural confirmation and respect technical levels. Let price and macro alignment guide your decisions, not emotion or hype.
Plan the trade. Trade the plan. Protect your capital.

EUR/USD - H4 - Triangle Formation (31.05.2025)The EUR/USD pair on the H4 timeframe presents a recent Formation of a Triangle Pattern.
1. Wait for Breakout with Good Volume
2. Conformation in short Timeframe Must
🎁 Please hit the like button and
🎁 Leave a comment to support for My Post !
Fundamental Updates :
Dollar mixed on tariff uncertainty, U.S. President Donald Trump to battle a U.S. trade court ruling that blocked most of his proposed tariffs.
Your likes and comments are incredibly motivating and will encourage me to share more analysis with you.
Best Regards, KABHI_TA_TRADING
Thank you.
Disclosure: I am part of Trade Nation's Influencer program and receive a monthly fee for using their TradingView charts in my analysis.

Energy giants surge: Top 5 stocks to watchJune 2025 was marked by heightened volatility across the global energy sector . Amid fluctuating oil prices, geopolitical uncertainty, and ongoing industry transformation, major oil and gas companies delivered mixed results. Let’s break down the key drivers behind the moves in Shell, TotalEnergies, BP, Chevron, and Exxon Mobil.
Here are the five leaders that set the tone this June :
1. Shell: Steady growth driven by strategic adjustments . The stock climbed 7% thanks to a pragmatic dividend policy and a $3.5B share buyback plan. LNG Canada project developments also boosted investor confidence.
2. TotalEnergies: Strong performance backed by green energy push . Shares rose 5.5% after the acquisition of a renewable energy portfolio and a dividend increase. Conservative production forecast (+3% for 2025) and investment in clean energy kept demand strong.
3. BP: Recovery supported by oil price rebound . BP added around 7% on oil market stabilization and a new share buyback program. Although production declined due to asset sales, higher profitability in the oil segment offset the drop.
4. Chevron: Notable gains fueled by new projects . Chevron advanced 7.5% following the launch of the Ballymore field in the Gulf of Mexico. Expanded buyback and dividend plans further attracted investors.
5. Exxon Mobil : Stable upward momentum from production expansion. Shares jumped nearly 10% as Q1 profits reached $7.7B. Liquefied natural gas development and output growth targets energized traders.
FreshForex analysts believe the rally in energy majors may continue in the near term. Shell, TotalEnergies, BP, Chevron, and Exxon Mobil remain strong picks for active investors.

Gold on the Edge: Will US Debt Fears Spark a Breakout?XAUUSD – Gold on the Edge: Will US Debt Fears Spark a Breakout?
After weeks of muted movement, gold is coiling within a bearish channel — but a fresh warning from Goldman Sachs may be the trigger that changes everything. With concerns mounting over America’s fiscal future, gold could be preparing for a decisive shift.
🌐 Macro View – Goldman Sachs Sounds the Alarm
🔺 Goldman Sachs recently issued a critical warning:
US national debt is expected to exceed WWII levels, with interest payments topping $1 trillion by 2025, outpacing spending on defense and healthcare.
If urgent fiscal reforms aren’t implemented, the US could face a tightening cycle that slows GDP growth without reducing the debt-to-GDP ratio.
The root causes? Excessive spending, rising interest rates, and deep political gridlock.
📌 For global investors, this type of uncertainty is often bullish for gold — especially as a hedge against both inflation and US dollar instability.
📉 Technical Outlook (Updated – M30 to H1)
Gold is still trading inside a well-defined descending channel, with sellers firmly in control.
Price is currently hovering around the pivot zone at 3,338.42, with a possible short-term bounce toward 3,368.04, the upper edge of the channel.
EMA ribbons (13–200) are sharply aligned to the downside, signaling strong bearish momentum.
If the price fails to break above 3,368, the next key support zones lie at 3,325.78, and potentially 3,309.25, where unfilled fair value gaps (FVG) await.
✅ Trade Plan
🟢 BUY ZONE: 3310 – 3308
Stop-Loss: 3303
Targets: 3314 → 3318 → 3322 → 3326 → 3330 → 3340 → 3350 → 3360 →
🟢 BUY SCALP: 3325 – 3323
Stop-Loss: 3318
Targets: 3330 → 3334 → 3338 → 3342 → 3346 → 3350 → 3360 → 3370 →
🔴 SELL ZONE: 3418 – 3420
Stop-Loss: 3424
Targets: 3414 → 3410 → 3405 → 3400 → 3396 → 3390 → 3385 → 3380
🔻 SELL SCALP: 3396 – 3398
Stop-Loss: 3403
Targets: 3392 → 3388 → 3384 → 3380 → 3375 → 3370
💬 Closing Thoughts – A Volatile End to the Week?
With US markets returning from a bank holiday and macro pressure rising, volatility could spike to close the week.
✅ Stick to disciplined SL/TP levels. Avoid premature entries and let price confirm direction.
Gold remains technically bearish — but the global debt narrative could turn this market on its head.
Prepare. Observe. Strike only when the structure aligns.

Fundamental Market Analysis for June 20, 2025 USDJPYThe Japanese yen (JPY) strengthened slightly against the US dollar during Friday's Asian session and moved away from the monthly low reached the day before. Data released by the Japanese government showed that the annual consumer price index (CPI) in May remained well above the Bank of Japan's (BoJ) target of 2%. This confirms market expectations that the BoJ will raise interest rates again and is a key factor driving the moderate growth of the JPY.
Meanwhile, ongoing trade uncertainty and further escalation of geopolitical tensions in the Middle East continue to weigh on investor sentiment, further strengthening the JPY's status as a safe haven. In addition, the moderate decline in the US dollar (USD) is pulling the USD/JPY pair back towards the psychological level of 145.000. However, expectations that the BoJ may keep rates unchanged until the first quarter of 2026, as well as the Federal Reserve's (Fed) hawkish pause earlier this week, may limit the pair's losses.
Market participants are paying extra attention to upcoming economic releases from the US, including inflation and labor market data, which could influence the Fed's monetary policy trajectory. If the statistics prove strong, this could strengthen the dollar and put pressure on the yen. However, the continuing weakness in the global economic recovery and high Japanese inflation continue to support expectations of a gradual tightening of BoJ policy, creating an ambiguous outlook for the USD/JPY exchange rate in the short term.
Trading recommendation: SELL 145.400, SL 145.700, TP 144.300

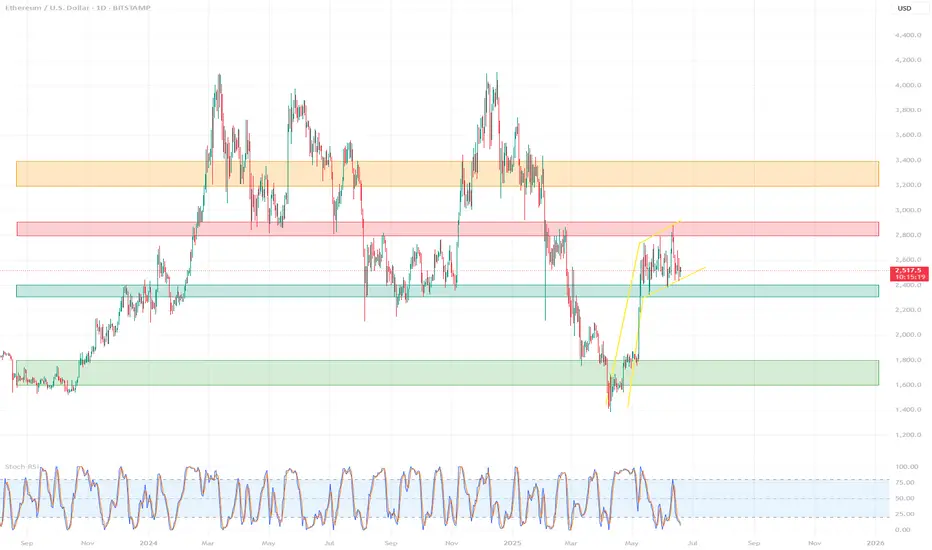
Detailed technical analysis of the ETH/USD chart🧭 General Context (1D, Long-Term):
The chart covers the period from approximately September 2023 to June 2025.
ETH/USD has gone through a complete cycle: growth → decline → correction → potential consolidation/accumulation.
🔹 Market Structure (Price Action)
🔸 Trends:
November 2023 – March 2024: strong uptrend, ETH reaches highs around $4,000+
March 2024 – February 2025: clear downtrend ending with a local low around $1,600
February 2025 – May 2025: dynamic rebound – probable trend change (new higher low + higher high)
May – June 2025: currently consolidating between ~$2,400–2,800
📉 Key Support and Resistance Levels
Type Level Notes
🔴 Resistance ~2,800 – 2,900 Local high, many candles with shadows rejected from above
🟡 Resistance ~3,200 – 3,400 Beginning of strong declines from 2024
🟢 Support ~2,300 – 2,400 Local lows in June 2025
🟢 Strong support ~1,600 – 1,800 Final market low of March 2025 (possible accumulation phase)
📊 Technical indicators
✅ Stochastic RSI (at the bottom of the chart):
Currently in the oversold zone (~0–20) → may signal a potential bottom / buying opportunity
Red-blue lines are starting to wrap upwards → possible rebound
Recent crossovers of the indicator corresponded to local price movements
🔍 Technical formations
⚠️ Possible formations:
Double Bottom: February–March 2025 → classic trend reversal formation
Rising Channel: from March 2025 to present – prices are moving in a slightly rising channel
Current consolidation may be a bull flag (continuation after the increase)
📌 Summary – scenarios
🟢 Bullish scenario:
Breakout of resistance ~2,800 → possible test of levels 3,200 – 3,400 USD
Confirmation of a higher low → continuation of the uptrend
Stochastic RSI in the oversold zone → potential for an uptrend
🔴 Bearish scenario:
Drop below 2,300 USD → possible return to the area of 1,800–1,600 USD
Breakout of the structure of higher lows
Confirmation that the increase was only a correction
🧠 Final conclusions
Currently, ETH/USD is in a key decision zone: after a strong rebound, the market is resting.
Stochastic RSI suggests a potential upside impulse, but requires confirmation by a breakout of resistance.
For traders: 2,800 (resistance) and 2,300 (support) are worth watching.
For investors: 1,600–1,800 could be considered a long-term accumulation zone.
$FET 4Hr Time frame DUMP before PUMP? $1 Recovery!FET/USDT – 4H Time Frame Analysis
Pattern Formation: A rounding top is clearly visible, suggesting weakening bullish momentum and potential trend reversal.
Trend Structure: Price is forming lower highs and lower lows, confirming a bearish trend.
Key Zones:
Supply Zone: $0.85 – $0.975
Demand Zone: $0.35 – $0.45
Neckline Support: Price is approaching a critical neckline level. A break below this could trigger strong downside movement.
Weekly FVG & Fib Confluence:
Below the neckline lies a weekly Fair Value Gap (FVG).
The 0.618 Fibonacci retracement aligns with this zone, forming a golden pocket — a key support area.
Scenario 1 – Bullish Reversal:
If price holds above the golden pocket, a bounce could push it back toward psychological levels (e.g., $0.70 and $0.80)
Scenario 2 – Bearish Continuation:
If price fails to hold the FVG/GP zone, this invalidates bullish setups.
Expect a breakdown targeting the $0.35–$0.45 demand zone.

Gold Breaks the Range: Trend Reversal or Just a Fakeout?XAUUSD – Gold Breaks the Range: Trend Reversal or Just a Fakeout?
After several days of sideways action, gold has finally broken out of its consolidation channel — but not upward. The price action signals uncertainty, while underlying global risks suggest a larger move may be brewing. With US markets closed for a bank holiday, low liquidity could lead to sharp, unexpected spikes — traders, stay alert.
🌍 Macro & Fundamental Outlook
📌 As widely expected, the Federal Reserve held rates steady, but Fed Chair Powell maintained a hawkish tone, warning that inflation risks remain due to ongoing geopolitical instability and rising commodity costs.
🔥 The gold market now hinges on two major geopolitical scenarios in the Middle East:
If the US intervenes diplomatically to ease tensions between Iran and Israel, gold may continue to correct further — possibly into the 3,325 – 3,300 range or lower.
However, if reports are accurate that Trump is coordinating with Israel for potential strikes on Iran, gold could spike aggressively as safe-haven demand surges toward 3,417 – 3,440.
📊 Technical Breakdown (M30 – H1)
Price has broken below the range-bound structure, suggesting a potential momentum shift to the downside.
The EMA cluster (13–34–89–200) is sloping downward, confirming bearish short-term pressure.
The 3,345 level has acted as support, but if it gives way, 3,325 becomes a critical liquidity zone where buyers may step in.
✅ Trading Plan
🟢 BUY ZONE 1: 3,325 – 3,328
Entry: Only after a clear bullish reversal (pin bar / bullish engulfing candle)
SL: Below 3,320
TP: 3,345 → 3,360 → 3,373 → 3,384
🟢 BUY ZONE 2: 3,345 – 3,348
Entry: On price retest and bullish confirmation
SL: Below 3,340
TP: 3,360 → 3,373 → 3,384 → 3,403
🔴 SELL ZONE: 3,417 – 3,440
Entry: If price rallies into resistance with no supporting fundamentals
SL: Above 3,445
TP: 3,403 → 3,384 → 3,360 → 3,345
💬 Final Thoughts
Gold is at a pivotal point. While today’s break could indicate a new leg down, we’ve seen countless false breakouts during low liquidity sessions. Only trade on confirmation — not emotion. Watch for geopolitical headlines and let price action guide your risk-adjusted decisions.
Stay patient. Stay sharp. Let the market prove itself before you do.

GBP/USD - For FOMC & Fed Interest RateThe GBP/USD pair on the M30 timeframe presents a Potential Buying Opportunity due to a recent Formation of a Channel Pattern. This suggests a shift in momentum towards the upside and a higher likelihood of further advances in the coming hours.
Possible Long Trade:
Entry: Consider Entering A Long Position around Trendline Of The Pattern.
Target Levels:
1st Resistance – 1.3567
2nd Resistance – 1.3682
🎁 Please hit the like button and
🎁 Leave a comment to support for My Post !
Your likes and comments are incredibly motivating and will encourage me to share more analysis with you.
Best Regards, KABHI_TA_TRADING
Thank you.
Disclosure: I am part of Trade Nation's Influencer program and receive a monthly fee for using their TradingView charts in my analysis.

Smart Money Zones Revealed (XAUUSD) Is Gold Just Breathing or Breaking? Smart Money Zones Revealed (XAUUSD)
🔍 Macro & Sentiment Overview
Gold faced a sharp correction after a strong Asian session rally, which caught many traders off guard...
While the US Dollar gained 0.7% due to safe-haven flows and Fed anticipation, gold's dip seems more like a liquidity sweep than a structural reversal...
🌍 Rising geopolitical tensions — especially Iran–Israel and Trump’s comments about Tehran — keep the fear premium alive…
🛢️ Meanwhile, oil prices are surging, and institutional funds might be rotating capital between commodities and equities...
📝 All eyes are now on the Fed’s rate decision and the US retail sales report — a potential "horror print" that could shock rate expectations and trigger high volatility across markets.
📉 Technical Breakdown (M30 Perspective)
Price pulled back sharply after an overextended bullish move from Asian FOMO…
EMAs (13, 34, 89, 200) show early signs of potential crossover — signaling caution for buyers…
Liquidity gaps (FVG zones) below current price indicate a magnet for institutional fills…
🎯 Trade Setup
🔵 BUY ZONE: 3345 – 3343
Stop-Loss: 3339
Take Profits:
3350 → 3354 → 3358 → 3362 → 3366 → 3370 → 3380 → 3400 → ???
🧠 Look for confirmation through price action and rejection candles during London/NY sessions before entering.
🔴 SELL ZONE: 3442 – 3444
Stop-Loss: 3448
Take Profits:
3438 → 3434 → 3430 → 3425 → 3420 → 3410 → 3400
⚠️ Only short upon clean rejection and strong bearish confirmation patterns — avoid blind entries in this volatile phase.
🧠 Final Thoughts
Gold is moving within a smart money playbook — triggering stop hunts and liquidity grabs. With macro uncertainty ahead, patience and precision matter more than ever.
Let price come to your zones. Don’t chase. Let volatility serve you — not shake you.
📌 Follow this idea for live updates during the Fed press conference and NY session.

Fundamental Market Analysis for June 18, 2025 EURUSDEvent to pay attention to today:
12:00 EET. EUR - Consumer Price Index
15:30 EET. USD - Unemployment Claims
21:00 EET. USD - FOMC Rate Decision
Declining confidence in the US economy amid trade policy is undermining the US Dollar (USD) against the Euro (EUR). Data released by the US Census Bureau on Tuesday showed that US retail sales fell 0.9% m/m in May, compared to a 0.1% decline (revised from +0.1%) recorded in April. The figure was weaker than estimates of -0.7%. Meanwhile, US industrial production in May declined 0.2% m/m vs. 0.1% previously (revised from 0%), worse than expectations of 0.1%.
Traders expect the US Federal Reserve to leave borrowing costs unchanged at its June meeting on Wednesday. Markets now estimate a nearly 80% chance that the Fed will cut rates in September and then another in October, according to Reuters.
The mood of European Central Bank (ECB) policymakers is supportive of the common currency. ECB President Christine Lagarde said that rate cuts are coming to an end as the central bank is now in a “good position” to deal with the current uncertainty.
Meanwhile, investors will keep an eye on geopolitical risks. Israel is set to step up strikes on Tehran, while the US is considering expanding its role amid rising tensions between Israel and Iran.
Trade recommendation: SELL 1.1460, SL 1.1560, TP 1.1260

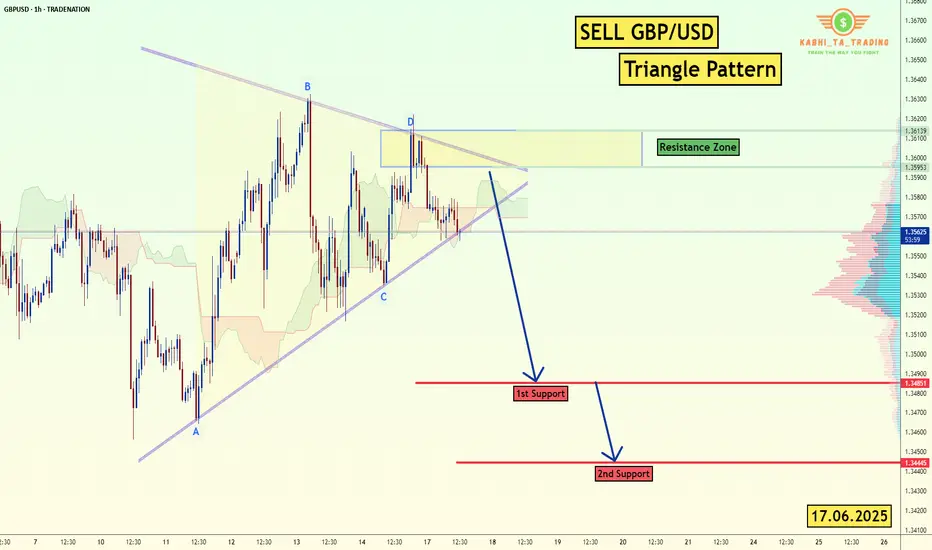
GBP/USD - H1-Triangle Breakout (17.06.2025)The GBP/USD Pair on the H1 timeframe presents a Potential Selling Opportunity due to a recent Formation of a Triangle Breakout Pattern. This suggests a shift in momentum towards the downside in the coming hours.
Possible Short Trade:
Entry: Consider Entering A Short Position around Trendline Of The Pattern.
Target Levels:
1st Support – 1.3485
2nd Support – 1.3444
🎁 Please hit the like button and
🎁 Leave a comment to support for My Post !
Your likes and comments are incredibly motivating and will encourage me to share more analysis with you.
Best Regards, KABHI_TA_TRADING
Thank you.
Disclosure: I am part of Trade Nation's Influencer program and receive a monthly fee for using their TradingView charts in my analysis.
Oil Rises, Canadian Yields Surge: Can USD/CAD Rebound?USDCAD 17/06 – Oil Rises, Canadian Yields Surge: Can USD/CAD Rebound?
After a significant drop to the 1.355x area, USD/CAD is showing early signs of recovery. However, the pair remains influenced by strong macro headwinds—particularly oil prices and Canadian monetary policy signals.
🌐 Macro & Sentiment Overview
WTI crude oil is rising due to ongoing tensions between Israel and Iran, which increase the risk of global supply disruptions. This supports the Canadian Dollar (CAD) as a commodity-linked currency.
Canada’s 10-year bond yields have reached their highest levels in 5 months (~3.4%), reinforcing expectations that the BoC may remain hawkish in the near term.
USD weakens slightly as traders await more clarity from the Federal Reserve about the next rate cut timeline, potentially in Q3.
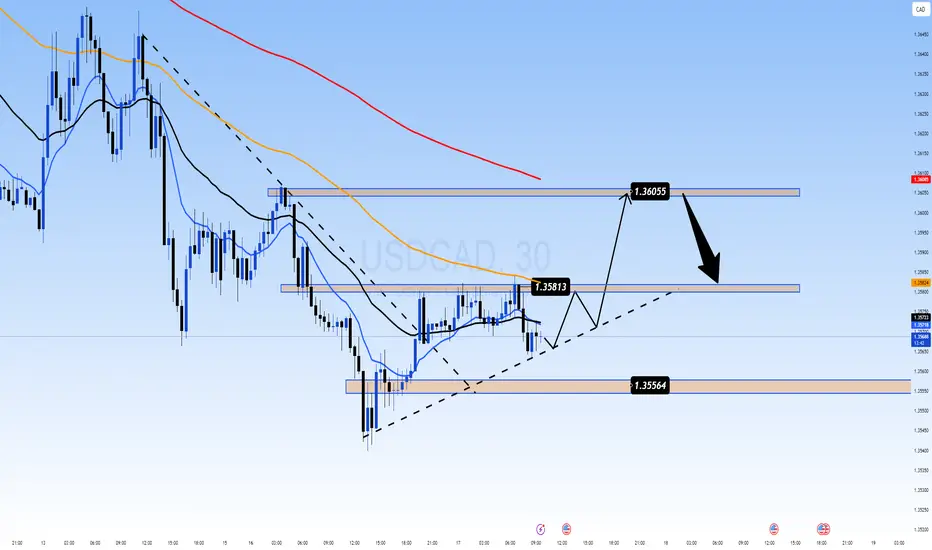
📊 Technical Analysis (M30 Chart)
Price is printing higher lows above the key trendline.
EMAs 13–34–89 are tightening → sign of sideways pressure before breakout.
Short-term bullish channel still intact.
Key resistance zones: 1.3581 and 1.3605.
🎯 Trade Setup Scenarios
📈 Long Scenario
Entry: 1.3556 – 1.3560 (trendline bounce)
Stop Loss: 1.3535
Take Profits: 1.3581 → 1.3605
✅ Wait for M30/H1 confirmation like bullish engulfing or price-action breakout.
📉 Short Scenario
Entry: 1.3605 (if price rejects resistance)
Stop Loss: 1.3630
Take Profits: 1.3581 → 1.3556
⚠️ Trigger only on bearish rejection with strong candle and volume at resistance.
📌 Strategic Outlook
USD/CAD is caught in a tug-of-war: stronger Canadian fundamentals (oil + yields) vs. cautious USD movement post-FOMC. If oil prices and Canadian yields continue to climb, CAD may remain in favor. However, short-term technical rebounds toward 1.3600 remain valid if price structure holds.
Squeeze in Progress: Will BOJ Trigger the Next Breakout?USDJPY 17/06 – Squeeze in Progress: Will BOJ Trigger the Next Breakout?
The USDJPY pair is currently consolidating just below the key 144.650 resistance, stuck within a tightening triangle structure. As markets await more clarity from both the Bank of Japan (BOJ) and the Fed, price action is showing signs of indecision — but pressure is building.
🌐 Macro & Sentiment Overview
BOJ maintains a neutral stance: Despite growing speculation of a hawkish shift, the BOJ held rates steady, providing no strong forward guidance. Markets remain cautious.
US Dollar remains resilient amid stable bond yields and expectations that the Fed may delay rate cuts, adding short-term support to USDJPY.
Geopolitical risk is on the rise: Ongoing Middle East tensions are fueling safe-haven demand for JPY, capping bullish momentum.
🔍 Technical Setup (M30 Chart)
Price is trapped inside a symmetrical triangle, tightening between 144.652 resistance and 143.126 support.
EMA 13/34/89 are aligned bullishly, but EMA 200 (red) is acting as a dynamic ceiling near 144.300.
Key support zones:
144.071: Minor structural level and trendline test.
143.126: Major liquidity zone and untested demand.
🎯 Trade Scenarios
📉 Scenario 1 – Sell on Rejection at 144.652
Entry: 144.650–144.700
Stop Loss: 145.250
Take Profit: 144.071 → 143.600 → 143.126
Ideal if BOJ shifts tone or USD weakens post-Fed comments.
📈 Scenario 2 – Buy on Bullish Reaction at 143.126
Entry: 143.100–143.150
Stop Loss: 142.700
Take Profit: 143.600 → 144.071 → 144.650 → 145.200
Valid only with clear bullish confirmation on M15–M30 structure.
🧠 Final Thoughts
USDJPY is coiling tightly ahead of a potential breakout. Macro uncertainty from central banks, geopolitical instability, and upcoming CPI data make this week highly volatile. Instead of chasing, let price come to your zones and react accordingly.
🔔 Focus on structure, confirm with price action, and avoid emotional trades. Patience and discipline are key in this compression phase.

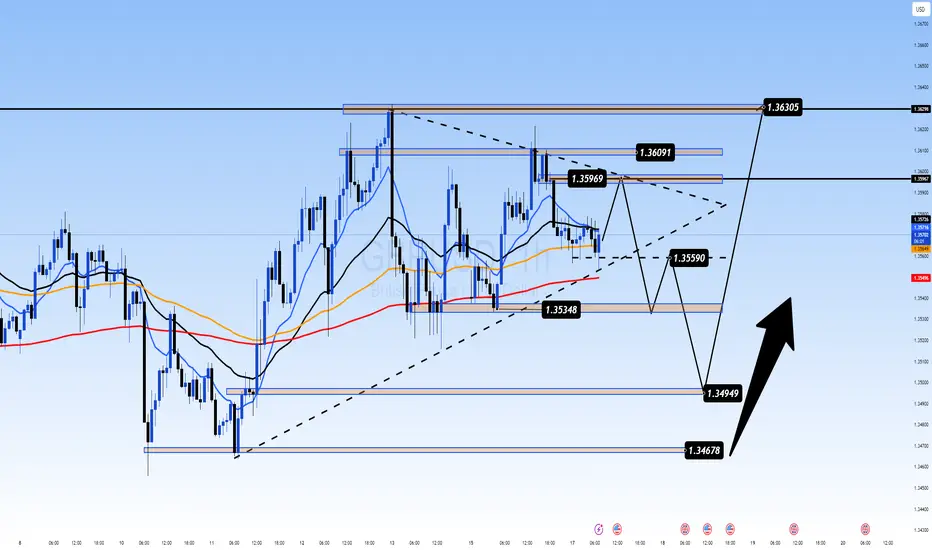
The Calm Before the Storm: All Eyes on UK CPI & Central BanksGBPUSD 17/06 – The Calm Before the Storm: All Eyes on UK CPI & Central Banks
The GBPUSD pair is coiling in a tight range near the mid-1.3500s as traders brace for two high-impact events: UK CPI data on Wednesday and interest rate decisions from both the Fed and BoE this week. Price remains supported above the 200 EMA and is compressing within a symmetrical triangle – typically a precursor to a major breakout.
📊 Macro & Fundamental Outlook
🔹 Federal Reserve (FOMC): Expected to hold rates steady, but growing anticipation of a dovish tilt toward September is weighing slightly on the USD.
🔹 Bank of England (BoE): Markets are pricing in deeper rate cuts following recent UK GDP weakness, pressuring the GBP in the short term.
🔹 Geopolitical Risks: Rising Middle East tensions are fuelling demand for USD as a safe haven, reinforcing its strength ahead of data events.
📝 Bottom Line: The CPI release could be the first trigger to shift GBPUSD’s current consolidation. A hot inflation print might push GBP higher; a miss could fuel further downside.
🔧 Technical Analysis (H1 Chart)
Price is ranging between 1.3535 (support) and 1.3609 (resistance)
EMAs 13/34 crossing below EMA 89 → signal of potential bearish continuation
Uptrend line from 1.3467 is still intact and acting as dynamic support
Break below 1.3559 may lead to a move toward 1.3495 and 1.3467
A confirmed breakout above 1.3609 opens the door to 1.3630+
🎯 Trade Scenarios
Scenario 1 – Buy from Trendline Support
Buy Zone: 1.3495 – 1.3467
Stop Loss: 1.3440
Targets: 1.3535 → 1.3559 → 1.3596 → 1.3630
🟢 Best setup if price prints a bullish engulfing or hammer candle on key support + UK CPI surprise.
Scenario 2 – Sell on Resistance Rejection
Sell Zone: 1.3609 – 1.3630
Stop Loss: 1.3660
Targets: 1.3590 → 1.3559 → 1.3535 → 1.3495
🔴 Only valid with strong rejection signals + softer UK data or hawkish Fed tone.
💡 Market Sentiment
Retail traders are trapped in a waiting zone – expecting a breakout
Institutions may push price into one direction pre-data to collect liquidity
Risk appetite is fragile, and traders are cautious ahead of back-to-back central bank announcements
📌 Final Thoughts
GBPUSD is preparing for volatility. Instead of chasing moves, let the market come to your key zones and react with discipline. The 1.3467–1.3495 support area could be crucial for the next directional move.
Stay patient. Wait for confirmation. Respect your risk.