Fundamental Market Analysis for May 6, 2025 GBPUSDGBPUSD:
The GBP/USD pair started the new week on a subdued note and is fluctuating in a narrow trading range around 1.3260-1.3265, near the one-week low reached during the Asian session.
The US Dollar (USD) remains on the defensive below multi-week highs amid heightened economic uncertainty amid US President Donald Trump's tariff plans and is a key supportive factor for the GBP/USD pair. Furthermore, the prospect of more aggressive policy easing by the Federal Reserve (Fed) is further undermining the US Dollar.
Despite a better than expected US non-farm payrolls report on Friday, investors seem convinced that the US central bank will resume its rate-cutting cycle in June and reduce borrowing costs by 100 basis points by the end of this year. This, along with optimism about a potential de-escalation of the trade war between the US and China, is reducing demand for the safe-haven dollar.
However, traders seem reluctant to make new bullish bets on GBP/USD and prefer to wait for this week's key event - the Bank of England's (BoE) monetary policy meeting on Thursday. The UK central bank is expected to cut interest rates by 25bps and take a somewhat soft stance amid downside risks to growth from the trade war.
In addition, this week traders will face the publication of the FOMC meeting minutes, which will affect the USD price dynamics and give a meaningful impetus to the GBP/USD pair.
Trading recomendation: SELL 1.3280, SL 1.3290, TP 1.3180
Fundamental-analysis

Week ahead analysis May 4th to 11th**Week Ahead Analysis (May 5 – May 11, 2025)**
### **Baseline: Market Expectations**
- **Tariffs & Fed Policy:** Trump's tariff announcement has heightened concerns about economic slowing, prompting bond markets to price in up to four Federal Reserve rate cuts this year.
- **Trade Talks & Sentiment Shift:** Reports suggest China may restart trade negotiations, boosting risk sentiment. However, China insists the U.S. must first remove all unilateral tariffs, adding uncertainty to the discussions.
- **Market Reaction:** Risk assets—equities and high-beta currencies like AUD, NZD, and CAD—are climbing as volatility cools. Meanwhile, safe havens such as JPY, CHF, and gold are facing selling pressure, though overall risk sentiment remains cautious.
### **Potential Surprise Scenarios**
- **Trade Deal Secured:** A deal would likely send equities higher, strengthen risk-sensitive currencies, and drive safe havens lower.
- **No Deal Reached:** In contrast, safe havens could gain while risk assets retreat.
### **Big Picture Outlook**
Regardless of the immediate outcome, the market's medium-term trajectory hinges on the broader effects of trade policy. If tariffs persist, economic uncertainty may sustain the Fed’s dovish stance. A successful trade deal, however, could restore confidence, shifting expectations back toward growth stabili

TMG Holding Fundamental and Chart AnalysisTMG Holding trend has recently taken an upward trend between the support line 46.873 and the resistance line 54.511, up by 0.78%. It is expected to keep rising till breaking the 1st resistance line at 54.115 and then the 2nd one at 54.423 points because of positive fundamental analysis. On one hand, the CBE's decision about cutting the interest rate by 2.25% would lead to positive impact on corporates because of the current reasons behind the economic activity, decreasing interest rate will lead to a decrease in the cost of borrowing, which will decrease the cost of production and will increase the corporates' profit and their monetary value. Accordingly, this will lower the products' price and individuals will have a higher will to diversify their investments and increase their purchasing power. On the other hand, besides the current annual advertisements about SouthMed and the summer getting closer, there is news on Reuters about an advanced stage of negotiations for a new large-scale mixed-use project in Iraq. This project is estimated to generate total sales vicinity of $17 Billion and annual recurring income exceeding $1.5 Billion.

BTC HAVE A HIGH PROBABILITY TO FALL DOWN!!!The BTC starts looking weak and it's perfect time to long for a short. We are almost at the top of this run from last weeks and we can see that BTC made a perfect divergence pattern. My indicator shows me also that we are entering a mid-term bearish trend and there is a high chance that we are gonna fall much deeper than in last weeks. My target is clear and I'm holding my strategy so I wait for the price to hit my SMA line like it was in the last days but now I wait for the price to hit the SMA line at 4H chart because we didn't hit it since 2 weeks so in this moment we can see even in a few candles that the price is gonna touch it. I am actually in the short and waiting for the price to go for my target, we also have a weekend so the price will be probably slow but everything can happen. In my opinion next week are gonna be red and the price should touch my target. I recommend to watch a 1H and 2H chart and looking when price will hit the SMA line on these timeframes because my target is set in a 4H chart but we can book profits even when the price will hit the SMA at 1H and at 2H chart. Be careful and stay focused.
EUR/USD - Channel Breakout (02.05.2025) FX:EURUSD The EUR/USD pair on the M30 timeframe presents a Potential Buying Opportunity due to a recent Formation of a Breakout Pattern. This suggests a shift in momentum towards the upside and a higher likelihood of further advances in the coming hours.
Possible Long Trade:
Entry: Consider Entering A Long Position around Trendline Of The Pattern.
Target Levels:
1st Resistance – 1.1387
2nd Resistance – 1.1430
🎁 Please hit the like button and
🎁 Leave a comment to support for My Post !
Your likes and comments are incredibly motivating and will encourage me to share more analysis with you.
TVC:DXY
Best Regards, KABHI_TA_TRADING
Thank you.

CAD/JPY at Key Decision Zone: Breakout or Rejection?🕵️♂️ Chart Overview:
Instrument: CAD/JPY
Chart Type: Candlestick
Time Frame: Appears to be intraday (possibly 1H or 4H)
EMAs Used:
50 EMA (Red): 102.814
200 EMA (Blue): 102.710
📊 Key Zones Identified:
1. Immediate Zone (103.30 - 103.50)
Marked as: “Resistance + Support”
This is a key decision zone. Price has tested this region multiple times, showing it holds dual roles — a flip zone.
Price is currently testing this zone again. A break and retest above could confirm bullish momentum.
2. Upper Resistance Zone (104.80 - 105.50)
A broader supply area where previous strong selling pressure occurred.
This is the next logical target if price breaks and holds above 103.50.
3. Lower Support (101.29)
Strong horizontal support, clearly defined from previous lows.
If the price fails to break above the current zone, a rejection could lead to a move back down toward this support.
📈 Bullish Scenario:
Break above 103.50, with a successful retest confirming new support.
Momentum could carry price toward the 105.00–105.50 resistance.
Supported by 50 EMA crossing above 200 EMA (early sign of bullish crossover — Golden Cross).
📉 Bearish Scenario:
Rejection from the 103.30–103.50 zone could signal continuation of range-bound or bearish pressure.
Break below 102.00, followed by momentum towards 101.29 key support.
Would invalidate short-term bullish structure.
📌 Additional Technical Notes:
The chart shows consolidation between 102.00 and 103.50 — likely accumulation or re-accumulation phase.
EMAs are tightening, indicating a potential volatility expansion move is near.
Volume is not visible but would be useful to confirm breakout strength.
📍Conclusion:
CAD/JPY is currently at a critical decision zone. The next few candles will be key. Monitor:
Breakout direction
Retest confirmations
Momentum and volume indicators (if available)

Gold on Edge – Will NFP Trigger the Next Big Move?🚨 Gold at a Crossroads – Will NFP & White House Comments Trigger a Volatility Spike? ⚡
🧭 Macro Overview
Gold enters the US session with a mild rebound after a sharp selloff, following its historic climb to $3,500/oz. The recent drop was driven less by fundamentals and more by aggressive profit-taking, especially from retail flows in Asia, notably China.
Rather than a trend reversal, this correction looks like a healthy technical reset, just ahead of two major catalysts:
1️⃣ US Non-Farm Payrolls (May edition)
2️⃣ White House remarks on tariffs and trade strategy
These two factors will likely define gold’s direction heading into next week — either toward deeper support zones or a potential recovery rally into resistance.
📊 DXY & Macro Market Lens
The US Dollar Index (DXY) has bounced off its base near 98.xx, currently testing the 100.00 level. Whether the dollar strengthens further depends largely on today’s labour data and fiscal signals from Washington.
Traders should remain tactically neutral, relying on intraday timeframes like H1/H2 and respecting key price structure.
🔺 Key Resistance Levels
3,260
3,275
3,285
3,312
🔻 Key Support Levels
3,244
3,230
3,215
3,200
🎯 Trade Plan – Friday 3rd May, 2025
🔵 BUY ZONE A:
Entry: 3,232 – 3,230
SL: 3,226
TP: 3,236 → 3,240 → 3,244 → 3,248 → 3,252 → 3,256 → 3,260
🔵 BUY ZONE B:
Entry: 3,214 – 3,212
SL: 3,208
TP: 3,218 → 3,222 → 3,226 → 3,230 → 3,235 → 3,240
🔴 SELL ZONE:
Entry: 3,276 – 3,278
SL: 3,282
TP: 3,272 → 3,268 → 3,264 → 3,260 → 3,250
⚠️ Final Notes
Volatility may spike sharply during the NY session as NFP and political news collide.
This is the kind of session where traders can either capitalize massively or get caught offside — stay disciplined.
Avoid emotional entries — let price come to you, wait for confirmation, and stick to your TP/SL.
📣 Conclusion
We’re likely in a calm-before-the-storm scenario. Gold hasn’t made its real move yet — but when it does, it’ll be swift.
Prepare. Execute. Protect your capital.

Fundamental Market Analysis for May 2, 2025 EURUSDThe EUR/USD pair attracted moderate buying interest during the Asian trading session on Friday and demonstrates a desire to consolidate above the psychologically important level of 1.13000. At the moment, spot quotes seem to have broken a three-day series of declines, reaching a two-week low near 1.12650, recorded on Thursday, amid repositioning of market participants awaiting the publication of key macroeconomic indicators from the Eurozone and the United States.
Representatives of the European Central Bank (ECB) earlier expressed concern over the risks of lower inflationary pressures in the region. In this regard, market participants are waiting with special attention for the preliminary data on the consumer price index (CPI) in the eurozone. Indicators that turned out to be lower than forecasts may strengthen expectations of the ECB key interest rate reduction by 25 basis points following the results of the meeting in July. Such a development could put pressure on the single European currency and contribute to the resumption of the EUR/USD corrective movement from the level of 1.1575 - the maximum since November 2021, recorded last month.
In the United States of America, investors' attention is focused on the upcoming Non-Farm Payrolls report (NFP), according to forecasts of which the US economy could create only 130 thousand new jobs in April, which is significantly lower than the March value of 228 thousand. At the same time, the unemployment rate, according to preliminary estimates, will remain at 4.2%. These data may have a significant impact on expectations of further monetary policy steps by the Federal Reserve (Fed), which, in turn, will affect the dynamics of the US dollar and determine the short-term trajectory of EUR/USD.
Additionally, the persistent expectations of a looser monetary policy of the Federal Reserve System (FRS) restrain the potential for strengthening of the US dollar, despite its three-day rise to local highs. In particular, market participants have increased expectations for four 25 basis point interest rate cuts before the end of this year, after recently released statistics pointed to an unexpected contraction in US GDP - for the first time since 2022. As a result, the dollar bulls' positions remain limited, which provides support to the EUR/USD pair.
Trading recommendation: BUY 1.13100, SL 1.27500, TP 1.14200

XAU/USD (Gold) H1 Breakout (29.04.2025)The XAU/USD Pair on the H1 timeframe presents a Potential Selling Opportunity due to a recent Formation of a Breakout Pattern. This suggests a shift in momentum towards the downside in the coming hours.
Possible Short Trade:
Entry: Consider Entering A Short Position around Trendline Of The Pattern.
Target Levels:
1st Support – 3158
2nd Support – 3025
🎁 Please hit the like button and
🎁 Leave a comment to support for My Post !
Your likes and comments are incredibly motivating and will encourage me to share more analysis with you.
Best Regards, KABHI_TA_TRADING
Thank you.

Fundamental Market Analysis for March 01, 2025 USDJPYThe USD/JPY pair is trading with small losses, hovering around the mid-143.00s after disappointing US economic growth data and weak Japanese economic reports caused a divergence in sentiment between the two currencies. The US economy contracted 0.3 per cent in the first quarter of 2025, the first contraction since 2022, missing growth expectations and highlighting the impact of rising imports and government spending cuts. At the same time, Japan released weaker-than-expected industrial production and retail sales data, limiting the yen's gains even as global risk appetite declined.
On the macroeconomic front, the US Bureau of Economic Analysis reported that real GDP contracted 0.3% in Q1, missing the market forecast for a 0.4% increase and slowing sharply from the 2.4% growth in Q4 2024. The contraction was primarily driven by a 41 per cent rise in imports and lower government spending. Meanwhile, core PCE inflation, the Fed's preferred measure of inflation, fell to 2.3 per cent year-on-year, in line with expectations and below February's 2.5 per cent. Other data showed a slowdown in job creation, with the ADP report showing just 62,000 new jobs in April against expectations of 108,000.
Despite the softer data, personal spending remained flat in March, rising 0.7%, while incomes rose 0.5%. However, market sentiment turned cautious, with the Dow Jones Industrial Average falling more than 200 points to stagnate around 40,300.
In Japan, the yen weakened 0.5% against the dollar as industrial production and retail sales data disappointed, highlighting the fragility of the domestic economy.
Trade recommendation: BUY 144.20, SL 144.00, TP 145.00

Gold Regains Momentum Key Trading Setups Ahead of Volatile Week📌 Gold Regains Momentum – Key Trading Setups Ahead of Volatile Week 🔥📊
📈 Technical Overview
Gold (XAU/USD) started the week with a strong recovery after last week’s sharp drop. Price is currently stabilizing near the major support zone around 3,274 – 3,292, forming a fresh consolidation range that could lead to a bullish continuation — if key support holds.
Last week’s weaker-than-expected US employment data weakened the Dollar Index (DXY), supporting a rebound in gold. However, the market remains cautious ahead of today’s ADP Non-Farm Employment release, which could serve as a directional catalyst.
So far, gold is trading sideways, with mild corrective pullbacks, waiting for clear confirmation from upcoming data.
🔍 Key Support & Resistance Levels
Resistance: 3,336 – 3,352 – 3,357 – 3,366
Support: 3,305 – 3,292 – 3,274
🎯 Trade Setups for Today
🔵 BUY ZONE
Entry: 3,274 – 3,276
SL: 3,270
TP: 3,284 → 3,291 → 3,301 → 3,336
📝 A deeper dip into the 3,274 area could offer another long opportunity, but confirmation is key before entering.
🔴 SELL ZONE 1
Entry: 3,350 – 3,352
SL: 3,356
TP: 3,346 → 3,342 → 3,338 → 3,334 → 3,330 → 3,320
📝 Watch for rejection near 3,350. If price fails to break above, this zone could offer a solid intraday short.
🔴 SELL ZONE 2
Entry: 3,366 – 3,368
SL: 3,372
TP: 3,362 → 3,358 → 3,354 → 3,350 → 3,345 → 3,340
📝 If price is unable to hold above 3,366 resistance, look for sell opportunities targeting a drop back to 3,350 and below.
⚠️ Important Notes
Today’s session may be volatile due to ADP Non-Farm Employment expectations.
Geopolitical tension in Asia may also impact gold, so remain alert to surprise headlines.
Apply strict SL/TP risk management as markets prepare for Friday’s NFP release.
✅ Conclusion
We’re entering a pivotal session where gold is testing key zones just ahead of critical employment data. Use tight stops and clear confirmations for all trades.
🚨 Trade with discipline — stay patient, and be prepared for volatility.
💬 What’s your setup for today’s gold session? Watching for a breakout or fading the highs? Drop your view below! 👇👇👇

Fundamental Market Analysis for April 30, 2025 GBPUSDThe GBP/USD pair continues to fall for the second consecutive session, hovering near 1.3390 during Asian trading on Wednesday. The pair has been under pressure as the US dollar has strengthened amid renewed optimism over trade developments between the US and China. Traders are now turning their attention to the upcoming release of the March Personal Consumption Expenditure (PCE) price index, which is a key inflation gauge for the Federal Reserve.
The U.S. Dollar Index (DXY), which measures the dollar's exchange rate against six major currencies, remains above 99.00, suggesting U.S. Treasury yields are rising. The 2-year and 10-year US bond yields broke a four-day losing streak and were trading around 3.66 per cent and 4.17 per cent respectively at the time of writing.
On the data front, the JOLTS US job openings report released on Tuesday showed a decline in the number of open positions to 7.19 million in March - the lowest level since September 2024 - indicating a cooling in labour demand. The figure fell short of expectations and emphasised growing economic uncertainty.
Adding to GBP/USD's decline are rising expectations that the Bank of England (BoE) will cut rates at its May meeting. Lower inflation expectations in the United Kingdom (UK) and increasing global economic factors favour a rate hike.
Bank of England Governor Megan Green recently stated that tariffs proposed by US President Donald Trump could lead to lower inflation in the UK, although significant uncertainties remain over the broader economic impact and recent tax hikes for employers.
Trading recommendation: SELL 1.3390, SL 1.3420, TP 1.3300

Gold in Focus: Tight Range Before Major US Data 🌐 Gold in Focus: Tight Range Before Major US Data – Time to Prepare for the Storm?
Gold (XAU/USD) is currently trapped within a narrow consolidation zone, with traders across global markets awaiting critical economic events in the second half of this week. The bounce from the 3290–3270 support zones confirms strong buying interest, yet bulls seem cautious ahead of the ADP employment report today and the all-important Nonfarm Payrolls (NFP) on Friday.
Despite dovish signs from recent labor data and declining US bond yields, gold has not been able to regain strong upward momentum. This hesitance is attributed to mixed market sentiment fueled by ongoing US-China trade negotiations, potential interest rate outlook shifts from the Fed, and end-of-month positioning across major asset classes.
💼 What’s happening behind the scenes?
US 10Y yields dropped, signaling weaker inflation outlooks — usually bullish for gold.
DXY remains fragile but still attracts safe-haven inflows amid global political tensions.
Investors are cautious ahead of back-to-back economic events and might delay large trades until Friday.
With a bank holiday looming in Asia and Europe tomorrow, liquidity could tighten and amplify volatility. Gold might continue trading in a compressed range between 3274–3357 until NFP injects a fresh directional impulse.
🔍 Technical Roadmap:
🔺 Resistance Levels to Monitor:
3328
3336
3352
3357
3366
🔻 Support Levels to Watch:
3305
3292
3274
📌 Trade Strategy (30m–1H timeframe bias)
🔵 BUY ZONE A
📍 Entry: 3292 – 3290
🎯 SL: 3287
🎯 TP: 3295 → 3300 → 3304 → 3308 → 3315 → 3320
🔵 BUY ZONE B
📍 Entry: 3275 – 3273
🎯 SL: 3268
🎯 TP: 3280 → 3284 → 3286 → 3290 → 3300
🔴 SELL ZONE A
📍 Entry: 3350 – 3352
🎯 SL: 3356
🎯 TP: 3345 → 3340 → 3336 → 3332 → 3320
🔴 SELL ZONE B
📍 Entry: 3365 – 3367
🎯 SL: 3371
🎯 TP: 3361 → 3357 → 3352 → 3347 → 3340
📣 Final Thoughts:
We are in the "calm before the storm" phase. Price is coiling in tight ranges with declining volume and momentum. Today's ADP report could trigger intraday volatility, but major players may still remain on the sidelines until Friday's NFP.
As it’s also the last day of the month, be alert for liquidity grabs and potential stop hunts. Stick to your risk management plan and avoid revenge trades in volatile setups.
🛡️ Stay patient. Trade smart. Let the market reveal the direction.

GBP/JPY Bullish Flag (29.04.2025)The GBP/JPY pair on the M30 timeframe presents a Potential Buying Opportunity due to a recent Formation of a Breakout Pattern. This suggests a shift in momentum towards the upside and a higher likelihood of further advances in the coming hours.
Possible Long Trade:
Entry: Consider Entering A Long Position around Trendline Of The Pattern.
Target Levels:
1st Resistance – 192.18
2nd Resistance – 192.70
🎁 Please hit the like button and
🎁 Leave a comment to support for My Post !
Your likes and comments are incredibly motivating and will encourage me to share more analysis with you.
Best Regards, KABHI_TA_TRADING
Thank you.

Fundamental Market Analysis for April 29, 2025 EURUSDEUR/USD is down to 1.14150 in the early Asian session on Tuesday. The euro (EUR) is weakening against the US dollar (USD) amid rising bets for further rate cuts by the European Central Bank (ECB) in June. Investors expect further US trade policy developments ahead of the release of the much-anticipated US Non-Farm Payrolls (NFP) data on Friday.
US President Donald Trump said progress is being made and he has spoken to Chinese President Xi Jinping, although Beijing denies that trade talks are underway. U.S. Treasury Secretary Scott Bessent said he spoke with Chinese authorities last week but did not mention tariffs.
On Monday, Bessent said the U.S. government is in contact with China, but it is up to Beijing to take the first step to de-escalate the tariff fight with the U.S. over the trade imbalance between the two countries. Investors will be keeping a close eye on the US-China relationship. Trump's chaotic trade policies have undermined faith in US assets and the common currency has become an alternative destination for investors' cash. Any signs of an escalating trade war between the US and China could have a negative impact on the US dollar and serve as a tailwind for EUR/USD.
On Saturday, Reuters reported that ECB policymakers are increasingly confident of cutting interest rates in June as inflation continues to fall. On Monday, ECB chief Olli Rehn said the central bank may cut interest rates below the neutral level that keeps the economy in balance.
Trading recommendation: SELL 1.13800, SL 1.14000 , TP 1.13000

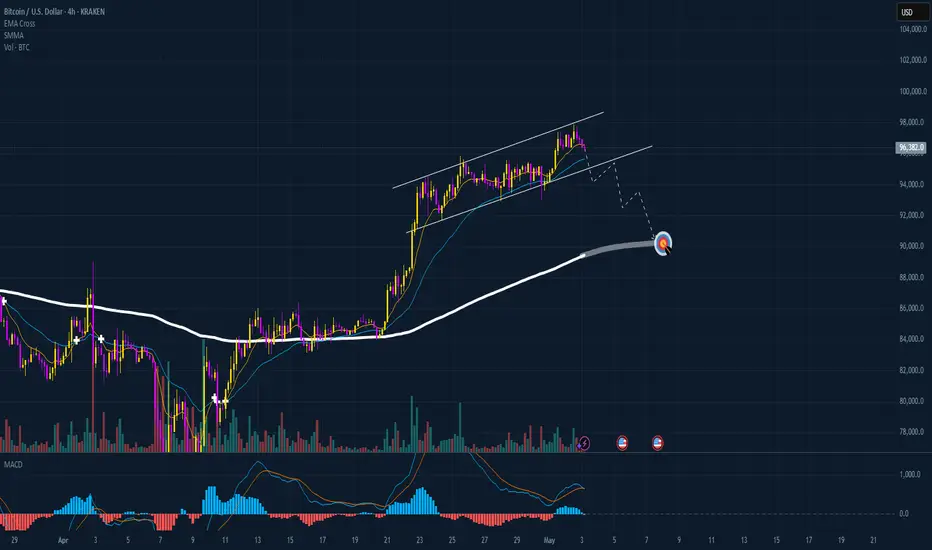
Bitcoin surpasses Google: Why BTC rallied to $94,000In April 2025, Bitcoin once again captured the spotlight by breaking above $94,000, reaching a market capitalization of $1.86 trillion. This surge pushed BTC ahead of Alphabet (Google’s parent company), making it the fifth-largest asset in the world.
The impressive rally in Bitcoin this year has been fueled by a combination of macroeconomic factors and developments within the crypto space itself. New financial instruments, political shifts, and technological advancements have made Bitcoin more appealing and accessible to a wide range of investors.
5 key drivers behind Bitcoin’s growth in 2025:
1. Approval of spot Bitcoin ETFs in the U.S.: For the first time, the SEC greenlit spot Bitcoin ETFs, allowing major institutional players to gain exposure through regulated investment products. This triggered a significant inflow of capital into the crypto market.
2. Weakening dollar and stock market declines: As global economic growth slowed and the U.S. dollar lost ground, Bitcoin emerged as a hedge asset — often compared to gold — with investors seeking safer alternatives to traditional markets.
3. Pro-crypto political climate in the U.S.: The new U.S. administration has adopted a supportive stance on crypto, easing regulations and even announcing plans to build national crypto reserves. This strengthened investor confidence across the market.
4. Bitcoin’s growing role as ‘Digital Gold’: The perception of Bitcoin as a long-term store of value continues to rise. More large investors and corporations are now including BTC in their asset diversification strategies.
5. Technological advancements: The rollout of second-layer solutions like the Lightning Network has made Bitcoin transactions faster and cheaper. This has improved real-world usability and expanded the global user base.
In 2025, Bitcoin continues to gain momentum, breaking new records and cementing its role as one of the world’s most important financial assets. The combination of spot ETF approvals, political backing, macroeconomic shifts, and ongoing tech innovation has created fertile ground for its growth. With each passing day, BTC becomes increasingly attractive to both institutional and retail investors — setting the stage for further gains in the coming years.
Still, Bitcoin’s future will depend on how crypto regulations evolve, the pace of technological breakthroughs, and global economic conditions.

[TechnoFunda]IDFC FIRST BANK – DEEP DIVE INTO MULTI-YEAR SUPPORTTECHNICAL ANALYSIS:
Ascending broadening channel structure
– Since the Aug-20 low (~₹15) price has traced a steady up-sloping trendline, touching in Mar-21, Feb-22 and now Apr-25
– Parallel resistance capped rallies in Feb-18 and Sep-23, defining a ~₹80–100 supply zone
– Channel slope averages ~30% annualized gains from support to resistance
EMA confluence and momentum
– April formed a bullish engulfing candle that closed above the 50 EMA (₹63.8), signalling renewed buyer conviction
Elliott-style wave count
– Wave 1: Aug-20 to Feb-23 advance into channel top (₹100)
– Wave 2: Feb-23 to Apr-25 retrace back to support/200 EMA (₹55)
– Wave 3 (projected): expected to carry price toward channel top again, targeting ₹95–100
Measured-move & targets
– Channel height (~₹85–15 = ₹70) added to support gives a potential target near ₹125 – bullish scenario only on a clean break above channel resistance
– Shorter-term target zone: ₹75 (minor swing highs) → ₹85 (channel midline)
Risk management
– Invalidation: monthly close below ₹55 erodes the uptrend and negates wave-count
– Use a stop 1.5× ATR below the Apr-25 low (₹50) for defined risk
FUNDAMENTAL ANALYSIS:
Revenue & earnings trajectory
– Quarterly revenue up from ~₹40 B in 2020 to ₹113 B in Q1 ’25, reflecting strong loan book growth and fee income diversification
– Net income swung from losses in 2018–19 to a peak of ~₹12 B in 2023, and stays positive at ₹3 B in the latest quarter
Asset-quality improvement
– GNPA ratio down from ~2.2% in 2020 to ~1.3% in Q1 ’25; PCR steadily rising above 75%
– Slippages have trended lower quarter-on-quarter, supporting margin stability
Margin & capital metrics
– Net interest margin at ~4.2%, above industry average, driven by retail and SME lending
– CET-1 ratio comfortably above 13% with Tier-1 capital buffer, enabling healthy credit growth
Valuation & catalysts
– Trades at ~0.4× book value and 10× trailing P/E vs sector averages of 1.5× and 15× respectively
– Potential rerating catalysts: continued NIM expansion, sustained reduction in credit cost, digital customer growth
MACRO & SENTIMENT CONTEXT:
- RBI rate cycle poised for cuts in H2 ’25, which could support credit demand
- Bank Nifty outperforming broader markets; institutional flows have rotated into midcap banks
- Relative strength vs Nifty: RSI on a monthly sits near 50, rising from oversold – room to run before overbought
TRADING PLAN:
- Enter partial long near current price (₹66–70)
- Add on break above ₹75 with conviction
- Targets: ₹75 → ₹85 → ₹95–100 (channel top)
- Stop-loss: ₹50–55 zone (monthly close basis)
- Trail stops above each new swing low to lock in profits as price advances

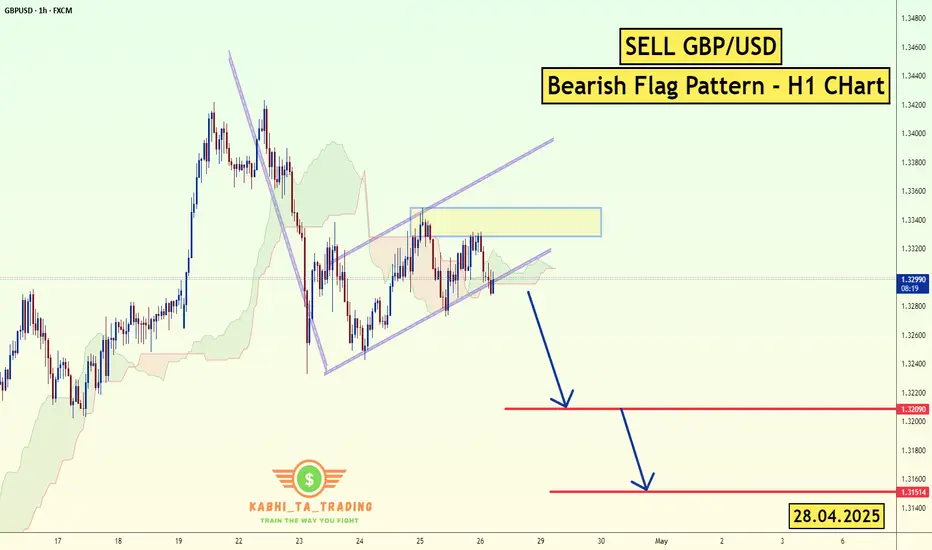
GBP/USD - H1 - Bearish Flag (28.04.2025)FX:GBPUSD The GBP/USD Pair on the H1 timeframe presents a Potential Selling Opportunity due to a recent Formation of a Bearish Flag Pattern. This suggests a shift in momentum towards the downside in the coming hours.
Possible Short Trade:
Entry: Consider Entering A Short Position around Trendline Of The Pattern.
Target Levels:
1st Support – 1.3209
2nd Support – 1.3151
🎁 Please hit the like button and
🎁 Leave a comment to support for My Post !
Your likes and comments are incredibly motivating and will encourage me to share more analysis with you.
Best Regards, KABHI_TA_TRADING
Thank you.
Fundamental Update :
on Monday as the trade tensions between the U.S. and China provided some relief to investors, while a stronger dollar further weighed on prices.
The U.S. dollar TVC:DXY rose 0.2% against a basket of currencies, making bullion more expensive for overseas buyers. TVC:DJI SP:SPX NASDAQ:IXIC also rising .
Range Tightens on Gold – Breakout or Breakdown Ahead?📌 Trading Plan for April 28, 2025: Gold (XAU/USD) Strategy 🧠📈
📊 Technical Analysis
Following the sharp drop in previous sessions, gold is now consolidating around the 3260–3270 support zone.
Price is moving within a tight triangle formation on the M15 timeframe, indicating compression ahead of a breakout.
The MA 13 – 34 – 200 still suggests a short-term bearish bias, but selling momentum has noticeably slowed down.
Expectation: gold may retest the 3299–3313 resistance zone before a stronger directional move.
🎯 Key Price Levels for Today
Immediate Resistance: 3299 – 3313
Major Support: 3260 – 3258 – 3239
🧩 Updated Trade Setup
🔵 BUY ZONE:
Entry: 3260 – 3258
Stop Loss (SL): 3254
Take Profit (TP): 3264 → 3268 → 3272 → 3276 → 3280
🔴 SELL ZONE: (after price retests resistance)
Entry: 3299 – 3301
Stop Loss (SL): 3306
Take Profit (TP): 3295 → 3290 → 3286 → 3282 → 3275
📢 Important Notes
Expected daily range: 60–80 pips.
No major economic news today, but stay alert for unexpected political headlines (especially from the US, China, India-Pakistan tensions).
Strictly follow TP/SL levels to protect your capital — avoid FOMO chasing after sharp intraday moves.
✅ Conclusion
Gold remains in a sensitive consolidation phase.
The best strategy today is buying at support and selling at resistance, only scaling in after clear confirmations!
💬 How are you planning to trade gold today? Share your views and setups below! 👇👇👇

Fundamental Market Analysis for April 28, 2025 USDJPYUSDJPY:
The Japanese yen (JPY) fluctuated in a narrow range in Monday's Asian session and paused its recent pullback from a multi-month high reached last week against its U.S. counterpart. U.S. Treasury Secretary Scott Bessent did not support President Donald Trump's statement that tariff talks with China are underway. That tempered optimism about a quick resolution to trade tensions between the world's two largest economies and provided some support for the safe-haven yen.
Meanwhile, traders pushed back expectations of an immediate interest rate hike by the Bank of Japan (BoJ) due to rising economic risks from US tariffs. However, signs of rising inflation in Japan leave the door open for further BoJ rate hikes this year, which is a big divergence from bets on more aggressive Federal Reserve (Fed) policy easing. This keeps USD bulls on the defensive and also serves as a tailwind for the low-yielding Yen.
Trading recommendation: SELL 143.20, SL 143.60, TP 142.50

Peace Headlines Are Here — But Markets Have Already Moved OnA Russia-Ukraine peace deal making headlines right now is historic news — politically and emotionally.
But for the forex and commodities markets?
The real money already left this story behind months ago.
🧠 Smart Money Knows: Markets Price in the Future, Not the Past
Two years ago, the war sent shockwaves through oil, gas, wheat, and risk currencies.
By late 2023, price action had already normalized — the "war premium" faded out quietly.
Commodities stabilized. Forex volatility shifted. Safe havens lost their edge.
Traders adapted, recalibrated, and moved on to new battlegrounds.
Bottom Line:
The market already priced in a future where this conflict would eventually fade — peace or no peace.
📊 What Actually Drives Forex Now
While peace headlines grab attention, the real macro drivers today are:
🔥 Tariff escalation and global trade wars
🔥 Sticky inflation battles (core services inflation still high)
🔥 Central bank pivot games (Fed, ECB, BoJ)
🔥 Global growth fears (China slowdown, EU stagnation)
This is where new money is flowing.
Not into a two-year-old headline finally catching up.
🛡️ "Buy the Rumor, Sell the Fact" in Action
For two years, markets have priced in an eventual end (or fade) to the Ukraine conflict.
A peace agreement now?
→ It confirms expectations, not shocks them.
→ It may trigger a short-lived risk-on pop (EUR, AUD, NZD up, gold down) —
→ But unless it unleashes massive new money flows (unlikely), that pop gets sold.
🔥 Final Thought:
If you're still trading the last war, you're already late.
The next major moves won't come from peace headlines — they'll come from tariff escalations, inflation battles, and central bank pivots.
Focus forward.
That's where opportunity lives.
💬 Question for Serious Traders:
Which macro theme are you really watching into summer 2025?
Peace headlines... or the new fires already burning?
Drop your insights below. 👇

TradeCityPro | Deep Search: In-Depth Of ONDO👋 Welcome to TradeCity Pro!
In this analysis, I want to fully review the ONDO project for you. First, I’ll go over the project’s information, and then we'll move on to its technical analysis.
🔹Introduction to Ondo Finance (ONDO)
Ondo Finance is an open and decentralized investment bank designed to bridge the gap between traditional finance and decentralized finance (DeFi). Founded in 2022 and based in the Cayman Islands, Ondo's mission is to democratize access to institutional-grade financial services. Its ecosystem is built to serve a wide range of stakeholders including DAOs, institutional players, and retail investors. Ondo's key innovation lies in tokenizing real-world assets, thereby making them accessible to a broader audience via blockchain technology.
🔹ONDO Token and Governance
The ONDO token plays a central role in the governance of the Ondo decentralized autonomous organization (DAO). Token holders have specific rights within the DAO, particularly over the governance of Flux Finance, which is one of the main platforms in the Ondo ecosystem. ONDO holders are empowered to propose and vote on changes, allocate funds for projects, and influence the platform’s direction, ensuring community-driven governance. The ONDO token sale occurred in mid-2022 and was purchased by over 18,000 individuals.
🔹Technology and Infrastructure
Ondo leverages blockchain technology to offer decentralized financial services. It operates on a secure and transparent distributed ledger system, which ensures that transactions are immutable and resistant to tampering. The platform uses Proof-of-Stake (PoS) as its consensus mechanism to validate transactions, offering both security and energy efficiency. Ondo is also integrated with various DeFi protocols and utilizes techniques from traditional finance to repackage DeFi exposures into institutional-grade risk-return profiles. Strategic partnerships with firms like BlackRock, Morgan Stanley, and Coinbase enhance its interoperability and credibility.
🔹Real-World Use Cases
Ondo's primary application is in the tokenization of real-world assets such as real estate or treasuries. This allows users to invest in fractionalized assets, lowering the barrier to entry for institutional-quality financial products. The platform is used for intellectual property management through blockchain-based records, enabling secure and transparent tracking. Ondo also engages in community events and educational initiatives to raise awareness about blockchain technology. Furthermore, it offers technical and business development services such as smart contract deployment and treasury management to startups and institutions.
🔹Key Developments and Milestones
In 2022, the Ondo DAO was officially launched, providing a decentralized governance framework. Following that, the foundation introduced Flux Finance, a major protocol under Ondo DAO governance. The Ondo Foundation has formed several partnerships to expand its ecosystem and drive innovation. One of the important initiatives includes Ondo USDY LLC, which issues the USDY stablecoin. Ondo has also focused on education, contract deployment, and treasury management, solidifying its operational backbone and long-term strategic vision.
🔹Team and Founders
Ondo Finance was founded by Nathan Allman and a team of former Goldman Sachs digital asset professionals. Nathan Allman brings a strong background in engineering and financial operations, serving as a key driver of the project’s vision. The founding team’s experience in traditional finance has been instrumental in shaping Ondo’s hybrid model, which integrates DeFi tools with institutional-grade strategies.
🔹Fundraising and Token Sale
Ondo Finance has conducted multiple fundraising rounds. An initial coin offering (ICO) took place on CoinList on May 12, 2022, raising $22 million. The token was priced at $0.055, with a minimum purchase of $100 and a maximum of $20,000. Another funding round was the IEO on Gate.io Startup, conducted from January 17 to January 18, 2024, which raised $40,000.
In total, Ondo has raised $46.04 million, including $22.04 million from public sales and $24 million from private and institutional funding rounds.
🔹Tokenomics
The ONDO token has a maximum supply of 10 billion tokens. Distribution is divided as follows: 52.1 percent for ecosystem growth, 33 percent for protocol development, 12.9 percent for private sales, and 2 percent for community access sales. As of now, 33.9 percent of the total supply is unlocked, with another 19.4 percent scheduled for future unlocks. Approximately 46.7 percent remains locked.
🔹Vesting Schedule
The vesting of ONDO tokens is structured into distinct categories. Ecosystem growth tokens are released linearly over five years, with 24 percent unlocked as of January 2024 and 39.2 percent expected to unlock gradually. Protocol development tokens have a one-year cliff, followed by a three-year linear unlock, with 25 percent becoming available in April 2025. Private sales follow the same schedule as protocol development, while community access sales were 90 percent unlocked from the beginning with full linear unlock over one year.
—
Certik: 87.50✅
🔹Top Ondo Wallets
Trust Wallet
imToken
MetaMask
Torus
Coinbase
TokenPocket
iToken Wallet
Binance web3 wallet
🔹Liquidity Pools
Uniswap
Balancer
🔹Top Holders
0x677fd4ed8ae623f2f625deb2d64f2070e46ca1a1
0x460ae5a6666fcb9635ba99b541b31279e59665370x
524083970c7a1e62fbaa61d38781f87a4f191fd0
0xa63eace47618b9677261b09b32e3ca2b5c0a0182
0xd2e6e930e25456ffcd4df0124563cc334f3284f4
🔹Significant TVL Growth in Ondo Despite Sharp Liquidity Decline
Since mid-January 2025, the total value locked (TVL) in Ondo has increased from 157,000 ETH to 631,000 ETH, reflecting significant growth in its TVL. However, in terms of liquidity, Ondo has experienced a sharp decline since late March, with a drop of nearly 50% compared to the previous month.
🔹On-Chain Analysis of ONDO
Looking at ONDO’s on-chain data, the $0.833 level stands out as a key support zone based on the concentration of tokens currently in profit. On the flip side, the $0.856 area acts as a resistance level, with approximately 124 million ONDO tokens currently held at a loss. However, the volume of tokens in profit remains higher overall, which can be interpreted positively — these zones represent value and may attract increased demand.
From a network activity perspective, there has been a noticeable decline, particularly in the number of new addresses being created.
Analyzing supply and demand, approximately 75% of ONDO tokens are held by whales, indicating strong whale dominance. Address-level data shows that wallets holding between 10 and 100 million tokens have shown minor demand, while older holders are contributing meaningful inflows. Additionally, wallets identified as "investor" addresses have also demonstrated renewed buying interest.
👀 Now that we’ve reviewed the project's details, let’s dive into ONDO’s technical analysis.
📅 Weekly Timeframe
In the weekly timeframe, as you can see, there aren't many candles yet, so we can’t perform a complete analysis on this timeframe.
✔️ However, you can observe that after the project launched in January 2024, there was an upward movement up to the 1.3927 area, followed by a correction down to 0.5871.
💥 After this correction, the next bullish leg continued up to the 2.0565 area.
📈 During this bullish cycle, there’s also an ascending trendline that the price has reacted to multiple times, and now it has touched it again.
⚡️ The main support on this timeframe is at 0.5871, and the main resistance is at 2.0565. So, if you already hold ONDO and are considering setting a stop-loss, breaking 0.5871 could be a good point to activate it.
🔽 This level can also be used as a trigger for a short position. Breaking 0.5871 could create a downtrend in ONDO.
🛒 For spot buying, the main trigger is breaking 2.0565, and if this level is broken, the price could register a new ATH.
📅 Daily Timeframe
In the daily timeframe, as you can see, the price has been supported by the trendline and has shown a very quick reaction, with bullish momentum pushing it above the 0.9253 resistance.
📊 Currently, the price has reached the SMA99 and reacted to it. The volume of the candles reacting to the SMA99 has increased, and if the price stabilizes above the SMA99, the main bullish leg could begin.
💫 The next resistance the price faces is at 1.1933, and if the SMA99 is broken, I believe the price can easily rise to this level.
☘️ Moreover, if this level is also broken, the price could climb up to 2.0565.
📉 For ONDO to turn bearish on this timeframe, the first trigger would be a fake breakout above 0.9253.The main bearish trigger would be breaking both the trendline and the 0.7122 level.
📝 Final Thoughts
This analysis reflects our opinions and is not financial advice.
Share your thoughts in the comments, and don’t forget to share this analysis with your friends! ❤️

Gold Retreats After Trump Confirms China Talks 📌 Gold Retreats After Trump Confirms China Talks – Political Noise Drives Volatility 🧨📉
Gold (XAU/USD) saw a sharp intraday drop following comments from President Trump, who confirmed that trade talks with China are “ongoing” — despite China denying any official negotiations had taken place. The market interpreted this as a signal of de-escalation, prompting a short-term price correction.
Gold had previously rallied past $3,500/oz, supported by a weaker USD and strong demand from bargain hunters after last week’s sharp decline. However, the current political contradictions and tariff headlines are creating erratic moves across all asset classes.
🌍 Fundamental Context
The USD weakened, stocks lost momentum, and risk sentiment shifted after a confusing round of statements from the US and China.
Meanwhile, US jobless claims rose slightly, reflecting a resilient labour market amid tariff-related headwinds.
Today’s Core Retail Sales data in the US could add more volatility heading into the weekly candle close.
It’s Friday — expect possible liquidity sweeps and aggressive price spikes as the market prepares for weekend risk-off moves.
📊 Trading Outlook – 26 April
We're seeing signs of a tactical pullback, but long setups should be delayed until political headlines stabilise. Focus on intraday reaction zones — not aggressive positioning.
🔻 SELL ZONES
3384 – 3386
• SL: 3390
• TP: 3380 → 3376 → 3372 → 3368 → 3364 → 3360 → ???
3406 – 3408
• SL: 3412
• TP: 3400 → 3396 → 3392 → 3388 → 3384 → 3380 → 3370 → 3360
🟢 BUY ZONES
3288 – 3286
• SL: 3282
• TP: 3292 → 3296 → 3300 → 3304 → 3310
3270 – 3268
• SL: 3264
• TP: 3274 → 3278 → 3282 → 3286 → 3290
🛡️ Final Notes & Strategy
Avoid rushing BUY entries — allow Price to complete its corrective phase and wait for structure and confirmation.
Today’s Core Retail Sales (US) could trigger a fresh wave of volatility.
It’s also weekly close Friday, so prepare for potential false breaks and stop hunts.
✅ Stick to your TP/SL. Protect your capital first — clarity will come when the dust settles.
💬 Are you watching for a short-term bounce or planning to fade strength near resistance? Let us know in the comments below! 👇👇👇
