GBP Rebounds on Retail Sales – But USD Still in Control📌 GBP Bounces on Strong Retail Sales, But USD Strength Keeps Pressure On 💷📉
The British Pound (GBP) rebounded on Friday after UK Retail Sales data surprised to the upside. According to the Office for National Statistics (ONS), retail sales rose by 0.4% in March, beating expectations of a -0.4% decline. On a yearly basis, growth accelerated to 2.6%, outpacing the forecast of 1.8%.
However, despite the positive data, traders remain confident the Bank of England (BoE) may still cut interest rates by 25 bps to 4.25% in the May meeting, due to persistent global uncertainties and softer inflation expectations.
Meanwhile, the US Dollar (USD) gained ground across the board as trade tensions between the US and China appeared to ease. Durable Goods Orders in the US jumped by 9.2% in March — a clear sign of business confidence and policy impact.
📊 Technical Outlook – GBP/USD
GBP/USD briefly recovered from an intraday low of 1.3280 but remains under pressure near key resistance.
On the upside, the psychological barrier at 1.3500 remains a major hurdle.
To the downside, the April 3rd high around 1.3200 now acts as strong support.
💼 Trading Plan
🟢 BUY ZONE:
Entry: 1.32500
SL: 1.32000
TP: 1.33300
🔴 SELL ZONE:
Entry: 1.34180
SL: 1.34700
TP: 1.33500
📌 Stay alert ahead of key BoE guidance and further US-China headlines — volatility may increase as we head into May.
Fundamental-analysis

AUDNZD BULLISH OR BEARISH DETAILED ANALYSISAUDNZD has finally broken out of a well-formed falling wedge pattern on the 12H timeframe, signaling a potential bullish reversal. After a sustained downtrend, price consolidated within the wedge, indicating decreasing bearish momentum. The recent breakout confirms buyer strength and opens the door for a fresh upside swing. The current price sits around 1.072, and based on technical structure and projected pattern targets, we could be heading towards the 1.105 zone.
From a fundamental standpoint, the Australian Dollar is gaining support due to rising commodity demand and hawkish tones from the RBA, hinting at a possibility of sustained higher interest rates. On the other hand, the New Zealand Dollar has been under pressure due to softer-than-expected CPI data and growing speculation that the RBNZ might be done with its tightening cycle. This divergence in central bank stance adds fuel to the AUDNZD bullish narrative. Today’s macro releases show stable Australian employment data and a dip in New Zealand’s retail figures, which further supports the bullish view.
This setup offers a solid risk-to-reward ratio, especially with a clean invalidation below 1.062. If the momentum sustains, price may accelerate quickly toward the 1.105 target. Market participants should also keep an eye on DXY (US Dollar Index) correlations and global risk sentiment, which could amplify volatility across AUD and NZD pairs.
As a professional trader, I’ll be monitoring price action closely near lower timeframes for confirmation entries and managing the trade with dynamic stop-loss adjustments. This breakout is technically clean, fundamentally supported, and strategically aligned with the current macro backdrop – making it a high-probability swing setup worth sharing.

Fundamental Market Analysis for April 25, 2025 GBPUSDAn event to watch out for today:
11:00 EET. CHF - The head of the SNB Martin Schlegel will deliver a speech
GBPUSD:
The GBP/USD pair is pulling back from its recent gains, hovering around 1.3290 during the Asian session on Friday. The pullback comes amid a strengthening US Dollar (USD), helped by a Bloomberg report that China may suspend a 125% tariff on some US imports, including medical equipment, ethane and aircraft leasing.
Sources familiar with the matter said officials are particularly scrutinising the possibility of removing tariffs on aircraft leasing. China's Ministry of Finance and General Administration of Customs have not yet commented. Further support for the dollar comes from optimism around trade talks with the US. Reuters reports progress in preliminary talks with key Asian allies, including South Korea and Japan.
The US Dollar Index (DXY), which tracks the dollar against six major currencies, is recovering previous losses and is trading near 99.80. However, the dollar faced headwinds after mixed labour market data. The US Department of Labour reported that initial jobless claims rose to 222,000 for the week ended April 19, slightly above expectations, while jobless claims fell 37,000 to 1.841 million for the week ended April 12.
In the United Kingdom (UK), the GfK consumer confidence index fell to -23 in April - its lowest level since November 2023 - amid rising living costs and growing concerns about global trade, missing forecasts of -22. Traders now await UK retail sales data and a final reading of the US consumer sentiment index from Michigan later in the North American session.
Trading recommendation: SELL 1.3270, SL 1.3300, TP 1.3170

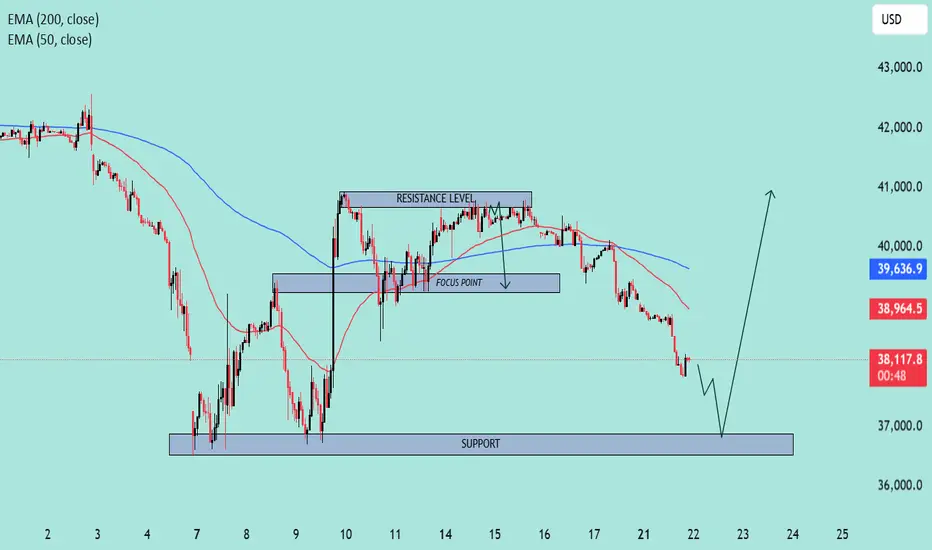
US30 Approaching Key Support Zone – Potential Reversal Ahead?📊 Chart Overview:
Timeframe: Looks like an intraday (maybe 1H or 2H).
Indicators:
EMA 50 (Red): 38,964.7
EMA 200 (Blue): 39,637.0
🔍 Key Levels & Structure:
🔵 Support Zone (Highlighted):
Around 36,800 – 37,200 range.
This is a well-tested support level where price previously bounced.
Current price action is approaching this zone again, which increases the chance of a potential bullish reaction.
🟣 Resistance Level:
Defined around 40,500 area.
Price has rejected multiple times from this zone.
Previously served as a consolidation/decision area.
📍 Focus Point (Previous Support Turned Resistance):
Near 38,700 – 39,000.
This level may act as a reaction point on the way back up.
📉 Current Price Action:
Strong downward momentum heading into the support zone.
Price is under both EMAs, suggesting short-term bearish trend.
However, the drawn arrow suggests a potential reversal bounce from the support.
🧠 Interpretation & Scenario Plan:
🅰️ Bullish Scenario:
Price touches or sweeps the support zone.
Bullish structure or reversal candle forms (e.g., hammer, bullish engulfing).
Break back above EMA 50 & Focus Point could confirm the shift.
Target: Revisit Resistance Zone (above 40,000).
🅱️ Bearish Scenario:
Support fails to hold.
Clean break below 36,800 with volume could lead to accelerated sell-off.
Watch for breakdown retests of support turned resistance.
🔔 Takeaway:
⚠️ Current move is bearish, but price is approaching a key demand zone. Bulls might step in if the zone holds. Confirmation is key before going long. Reclaiming EMAs would strengthen bullish bias.
AT&T I Tipping Point : Short Opportunity with Head & ShouldersHey traders after a previous trade trade on the hood hitting targets of 16.4%. Today I bring you NYSE:T
Technical + Fundamental View
Pro Tip
- Breakdown below the Entry Line will be considered at Trade Initiation. (Risky Traders)
R:R= 5.4
- Rest can follow entry at day close post breakdown SL above Entry Candle.
- The Breakdown Below the Entry Line will confirm the head and shoulder pattern
Entry Line - 26.93
Stoploss - 27.53
Target 1 - 25.59 (Neckline of head and shoulder)
Target 2 - 24.74
Target 3 - 23.68
Technical View
- Head And Shoulder on Daily Time frame
- On the hourly timeframe, the chart looks weak, showing a potential double top pattern where the second peak is lower than the first, indicating growing investor fear.
Fundamental View
- High Debt: Over $140 billion in debt limits investment capacity and consumes significant cash flow.
- Network Issues: Poor service quality and outages risk losing customers to competitors.
- Strong Competition : T-Mobile and Verizon offer better plans, making customer retention harder.
- Market Saturation: The U.S. wireless market is nearly saturated, limiting new customer growth.
- Execution Risks: Growth and debt reduction depend on flawless asset sales and network upgrades; delays could harm finances and stock performance.
Additional Considerations
- AT&T’s valuation is higher than some peers, potentially capping upside.
- Telecom market competitiveness means growth hinges on successful 5G and fiber rollouts.
- Dividend yield (~3.9%) is attractive but lower than some rivals, which may impact income investors.

Gold – Watching Key Resistance for Intraday Sell Plays📌 Gold Surges $80 off Support – Watching Key Resistance for Intraday Sell Plays 📉📈
Gold (XAU/USD) bounced sharply today — surging over 80 points from the support zone near $3,260, swept during the late U.S. session. This strong rebound came as buyers stepped in aggressively after a 250+ point crash earlier in the week.
Now, the market is pulling back from the 0.382 Fibonacci retracement zone, showing early signs of sell-side reaction. If this momentum continues, Asian and London sessions could push price lower to fill liquidity in the untested FVG region near 3,288.
🔁 Intraday Structure & Key Zones
After sweeping both sides of the range (80 up / 40 down), gold is now consolidating between 3,328 – 3,320. With intraday volatility ranging from 80–100 points, today’s focus will be on high-probability reaction zones.
🔴 SELL Bias for Today
Primary Resistance: 3,376 – 3,378
→ This zone is expected to act as the first defense for sellers.
If broken, watch the final resistance at 3,410 — a key structural level.
→ A clean breakout above 3,410 may invalidate the sell setup and shift the bias back to BUY.
🔍 News to Watch
⚠️ Unemployment Claims (U.S.) will be released during the New York session.
→ Given current market sensitivity, expect volatility to spike around this release.
🧭 Today’s Trading Zones
🟢 BUY ZONE
Entry: 3,230 – 3,228
SL: 3,224
TP Targets: 3,234 → 3,238 → 3,242 → 3,246 → 3,250 → 3,254 → 3,260
🔻 SELL ZONE #1
Entry: 3,376 – 3,378
SL: 3,382
TP Targets: 3,372 → 3,368 → 3,364 → 3,360 → 3,355 → 3,350
🔻 SELL ZONE #2
Entry: 3,408 – 3,410
SL: 3,414
TP Targets: 3,402 → 3,398 → 3,394 → 3,390 → 3,386 → 3,382 → 3,375 → 3,370
🛡️ Risk Management Note
The market remains extremely volatile and headline-driven. Stick to your trading plan and always respect TP/SL levels to protect your capital — especially during high-impact news releases.
💬 Are you planning to sell into resistance or wait for a deeper pullback to buy? Share your setups and ideas below! 👇👇👇

Fundamental Market Analysis for April 24, 2025 EURUSDEvent to watch out for today:
15:30 EET. USD - Number of Initial Jobless Claims in the U.S.
EURUSD:
EUR/USD rises towards the 1.1335 level during the early Asian session on Thursday. Easing concerns over potential tariff threats from US President Donald Trump are putting some pressure on the US Dollar (USD).
According to the Federal Reserve's (Fed) Beige Book report released on Wednesday, businesses facing the early stages of Trump's tariffs are looking for ways to pass on rising costs to consumers. Companies have reported receiving warnings from suppliers about price increases and are looking for ways not to absorb those increases, noting uncertainty about whether they can pass them on to customers.
Earlier this month, Trump imposed a basic import tax of 10 per cent or more on dozens of countries, but then unexpectedly suspended the taxes for 90 days to give countries a chance to negotiate lower rates. Nevertheless, trade policy uncertainty and concerns over slowing economic growth in the US could drive the dollar lower and create a tailwind for EUR/USD.
Last week, the European Central Bank (ECB) cut its main interest rate by a quarter of a percentage point to 2.25% at its April meeting. During a press conference, ECB President Christine Lagarde said that the US tariffs on EU goods, which have increased from an average of 3% to 13%, are already hurting the prospects of the European economy.
Trading recommendation: BUY 1.1350, SL 1.1320, TP 1.1430

Gold Drops $200 in Hours – Panic or Opportunity? 📌 Gold Plunges $200 – Volatility Surges Amid Fed Signals and Market Panic 🔥📉
📰 What Just Happened?
Yesterday, gold (XAU/USD) experienced one of its sharpest intraday drops in recent months, tumbling from the all-time high around $3,500 to as low as $3,318, losing nearly $200 in just a few hours.
This marked a significant correction following an extended bullish trend.
🔍 Key Drivers Behind the Crash
Fed-related commentary spurred aggressive profit-taking across the market.
The USD staged a technical rebound, exerting downward pressure on gold.
Rapid sentiment shifts triggered panic selling and liquidation flows.
🧭 What’s Next for Gold?
The $3,300–3,320 zone is now a crucial support — if this level holds, a technical recovery could unfold.
However, a break below $3,300 may expose gold to deeper downside targets near $3,250.
⚠️ Strategic Considerations
This is a high-volatility environment — flexibility and strict risk management are key.
Current sentiment is fragile. Unpredictable political headlines and mixed Fed signals are adding to the uncertainty.
In the latest development, Trump clarified he has no intention to fire the Fed Chair and hinted that China’s tariffs could be eased slightly — but not eliminated. These mixed messages continue to create sharp swings in price.
📊 Trade Plan
🔻 SELL ZONE #1:
Entry: 3,378 – 3,380
Stop Loss: 3,384
Take Profits: 3,374 → 3,370 → 3,366 → 3,362 → 3,358 → 3,350
🔻 SELL ZONE #2:
Entry: 3,408 – 3,410
Stop Loss: 3,414
Take Profits: 3,404 → 3,400 → 3,396 → 3,392 → 3,386 → 3,380
🟢 BUY ZONE:
Entry: 3,292 – 3,290
Stop Loss: 3,286
Take Profits: 3,296 → 3,300 → 3,304 → 3,308 → 3,312 → 3,316 → 3,320
The priority remains to sell into rallies near resistance while the downtrend unfolds. All trades should be protected with tight stop-losses, given the current unpredictability.
🧠 Key Takeaways
This is not a market for guessing — wait for price confirmation at key zones.
Focus on reaction zones, not forecasts.
Stay light, stay nimble, and manage risk carefully — news-driven volatility is at its peak.
💬 How are you positioning in this volatile gold market? Waiting for the bounce or selling the rallies? Let us know below! 👇👇👇

Fundamental Market Analysis for April 23, 2025 USDJPYThe Japanese yen (JPY) declined against its US counterpart for a second straight day on Wednesday and retreated further from the multi-month peak reached the previous day. The Trump administration officials' comforting comments on US-China trade talks triggered a sharp rebound in global risk sentiment, which in turn had a strong impact on traditional safe-haven assets, including the yen. Moreover, a slight recovery in the US dollar (USD) from multi-year lows, supported by easing concerns over Federal Reserve (Fed) independence, pushed the USD/JPY pair to a one-week high, a level above 143.000 during the Asian session.
Growing optimism that the US and Japan are moving closer to a temporary trade agreement is helping the yen, which reacted weakly to unimpressive domestic PMIs, to pause its intraday decline. In addition, strengthening expectations that the Bank of Japan (BoJ) will continue to raise interest rates in 2025 is keeping JPY bears from betting aggressively. Meanwhile, investors are losing confidence in the US economy amid Trump's rapidly shifting stance on trade policy. This, as well as bets that the Fed will soon resume its rate-cutting cycle, is holding back the dollar and taking the USD/JPY pair below 142.000 in the last hour.
Trading recommendation: SELL 141.700, SL 142.100, TP 140.500
BEARISH ON THE EUROI've taken a short position on EG, prior to PMI data being released over the next few hours.
Yesterday, I managed to get nice sells on this with the technicals provided, to the "weak low" as you see on the chart. Looking this morning, I expect this trend to continue and dont see a bullish angle on this pair yet until we see a deeper retracement - which is what Im involved in currently.
Fundamentally, Services PMIs tend to matter more for the UK, which is heavily services driven (80% of GDP), with manufacturing PMIs mattering more for Germany, the EU’s engine.
BoE - Slower to commit to cuts due to persistant wage growth and services inflation.
ECB - They are much more dovish in recent statements. Core inflation has been easing, and rate cuts are on the table as early as Q2/Q3.

XAU/USD Target Achieved – $3,500 Successfully Hit 🔥 XAU/USD Target Smashed – $3,500 HIT! 🎯💰
Gold has officially reached $3,500, perfectly hitting our projected buy target!
This move confirms the strength of the bullish momentum and technical breakout setup.
🔹 Entry: Above $3,430
🔹 Final Target: ✅ $3,500 – Hit
🔹 Result: High-conviction setup delivered with precision
🔹 Trend: Remains bullish, but profit-taking expected at round number resistance
👏 Massive congrats to all who followed the plan — another clean win on XAU/USD!

BTC/USD Eyes $109K After Bullish Breakout!!🧠 Chart Type and Indicators:
Chart Type: Candlestick
Indicators Used:
EMA 50 (red line): 85,335.18
EMA 200 (blue line): 85,657.29
🔍 Technical Pattern Analysis:
Pattern Identified: Ascending Triangle
The price has formed higher lows (ascending trendline support) while repeatedly testing a horizontal resistance zone (~$88,000), forming an ascending triangle.
This is typically a bullish continuation pattern when it occurs after an uptrend, though in this context, it's forming after a consolidation, giving more significance to the breakout.
🚀 Breakout Confirmation:
The price has broken above the horizontal resistance and is currently trading at $92,766.51.
Volume is not visible but should be increasing during a valid breakout.
Both EMAs have been decisively breached to the upside, signaling momentum shift in favor of bulls.
🧩 Key Levels:
Support Zone (Post-Breakout Retest): ~$88,000
Previously a resistance zone, now likely to act as support.
Immediate Resistance: ~$96,000
Historical resistance zone shown on the chart with a horizontal black line.
Extended Target (measured move): ~$109,420
Based on the height of the triangle projected from the breakout point.
📈 Price Action Forecast:
Two possible scenarios (depicted with arrows on the chart):
Bullish Continuation:
A retest of the $88,000 zone followed by continuation to $96,000, then $109,420.
Short-Term Pullback:
Price may dip to retest the breakout zone (~$88,000), consolidate, then rally higher.
✅ Bullish Signals Summary:
Breakout from a bullish ascending triangle.
EMAs crossed and price holding above them.
Clear higher highs and higher lows formation.
Momentum suggesting further upside.
🧨 Risks to Watch:
False Breakout Risk: If the price fails to hold above $88,000 and falls back into the triangle range.
Macro Factors: Bitcoin remains sensitive to macroeconomic news and regulations that could disrupt technical setups.

GOLD SMASHES THROUGH $3,450🚨 GOLD SMASHES THROUGH $3,450 – IS THIS THE START OF A GLOBAL FINANCIAL RESET? 🚨
🔥 Unstoppable Surge in Motion 🔥
Gold has soared past $3,450 as Asian markets opened, climbing over $100 a day!
In just two weeks, gold is up by over $500 — this isn’t just a rally, it’s a major structural breakout.
A surge in demand from Chinese funds appears to be fuelling the rise, with increasing evidence that Asia is leading a strategic shift away from fiat risk.
💷 Is the Dollar in Decline? Investors Flee the Old System 💷
The US Dollar Index (DXY) has taken a sharp downturn — confidence in USD is clearly under pressure.
Capital is flowing out of the United States, signalling a move away from the traditional financial order dominated by the dollar.
This gold rally isn't just about price — it's a global vote of no confidence in the status quo.
📉 Implications for the UK
With the pound holding relatively stable against the dollar, this gold spike presents a unique hedge opportunity.
For UK investors, rising gold prices could help offset currency risk and inflation concerns — especially in the face of persistent market uncertainty and geopolitical tensions.
📊 Technical Overview 📊
Gold is currently testing critical resistance around $3,519.
A pullback may see it retest support at $3,416 or as low as $3,210.
Fibonacci levels indicate a likely consolidation zone around $3,416.
The momentum is strong — we could be in the early phase of a global asset rotation.
📈 2-Hour Gold Chart Insight
Recent charts show a parabolic move with significant volume, primarily from Asia-based buyers.
This is not a short-term speculative move — it's likely a long-term strategic repositioning.
🌍 What Comes Next? 🌍
Should gold maintain levels above $3,450, a move towards $3,600 and beyond looks increasingly likely.
Talk of a financial "reset" is no longer just fringe theory — it’s entering the mainstream conversation.
From a UK perspective, now could be the time to:
Re-evaluate gold as a portfolio stabiliser
Reconsider exposure to US-denominated assets
Anticipate further volatility across fiat currencies
📌 Key Price Levels to Watch:
Resistance: $3,519 / $3,601
Support: $3,416 / $3,210
Upside Target: $3,600+
📈 Suggested Trading Zones:
Buy Zone
Entry: $3,424 – $3,422
Stop Loss: $3,418
Take Profit Targets: $3,428 / $3,432 / $3,436 / $3,440 / $3,450
Sell Zone
Entry: $3,604 – $3,606
Stop Loss: $3,610
Take Profit Targets: $3,600 / $3,596 / $3,592 / $3,588 / $3,584 / $3,580
💬 What’s your take? Is gold signalling the end of USD dominance?
Is the UK prepared for a global monetary shake-up? Let’s discuss. 🪙

Fundamental Market Analysis for April 22, 2025 GBPUSDGBPUSD:
The GBP/USD pair is trading in positive territory around 1.3370 during the early Asian session on Tuesday. Concerns over slowing growth in the United States (US) and worries over the independence of the Federal Reserve (Fed) are driving the US Dollar (USD) lower and creating a tailwind for the major pair.
US President Donald Trump condemned Powell for continuing to maintain a “wait-and-see” monetary policy until there is clarity on how the new tariff policy will affect the economic outlook. In a Truth social media post, Trump warned that the US economy will slow down if Powell doesn't cut interest rates immediately.
Heightened uncertainty surrounding Trump's tariffs and rising trade tensions between the U.S. and China are undermining the U.S. dollar across the board.
On the other hand, softer UK consumer price index (CPI) inflation data for March and global uncertainty paved the way for an interest rate cut by the Bank of England (BoE) at its May meeting. Financial markets are now betting on an interest rate cut at the Bank of England's May meeting, estimating an 86% probability of this happening, according to LSEG data. This, in turn, could affect the Pound Sterling (GBP) exchange rate against the US Dollar.
Trading recommendation: BUY 1.3425, SL 1.3395, TP 1.3510

FET/USDT - Trendline Breakout (22.04.2025)The FET/USDT Pair on the M30 timeframe presents a Potential Selling Opportunity due to a recent Formation of a Breakout Pattern. This suggests a shift in momentum towards the downside in the coming hours.
Possible Short Trade:
Entry: Consider Entering A Short Position around Trendline Of The Pattern.
Target Levels:
1st Support – 0.553
2nd Support – 0.516
🎁 Please hit the like button and
🎁 Leave a comment to support for My Post !
Your likes and comments are incredibly motivating and will encourage me to share more analysis with you.
Best Regards, KABHI_TA_TRADING
Thank you.

USD/CAD - Channel Pattern (22.04.2025)The USD/CAD Pair on the M30 timeframe presents a Potential Selling Opportunity due to a recent Formation of a Channel Pattern. This suggests a shift in momentum towards the downside in the coming hours.
Possible Short Trade:
Entry: Consider Entering A Short Position around Trendline Of The Pattern.
Target Levels:
1st Support – 1.3771
2nd Support – 1.3745
🎁 Please hit the like button and
🎁 Leave a comment to support for My Post !
Your likes and comments are incredibly motivating and will encourage me to share more analysis with you.
Best Regards, KABHI_TA_TRADING
Thank you.

Fundamental Market Analysis for April 21, 2025 EURUSDEUR/USD broke out of a multi-day trading range and hit a new high since February 2022 around 1.1485 during the Asian session on Monday.
Despite “aggressive” comments from Federal Reserve (Fed) Chairman Jerome Powell, uncertainty over US President Donald Trump's trade policy continues to undermine the dollar. Last Wednesday, Powell said the Fed would likely keep the benchmark interest rate unchanged and wait for more clarity before considering any policy adjustments. Meanwhile, Trump's retaliatory tariff announcements undermined investor confidence in U.S. economic growth and drove the dollar to a two-year low early in the new week.
The aforementioned factors largely offset the European Central Bank's (ECB) soft decision last week and served as a tailwind for EUR/USD. On Thursday, the ECB cut interest rates for the seventh time in a year and warned that economic growth would be hit hard by US tariffs, bolstering the case for further policy easing in the coming months.
Moving forward, traders this week will be focused on scheduled speeches by ECB President Christine Lagarde on Tuesday and a number of influential FOMC members this week. In addition, the market's focus will be on the release of flash PMI indices, which could provide new insights into the state of the global economy. This, in turn, may give some impetus to the US dollar and EUR/USD.
Trade recommendation: BUY 1.1520, SL 1.1465 , TP 1.1565.

Gold hits new record — Next stop: $4000!Gold has soared above $3,300 per ounce, setting a new all-time high. Since the beginning of the year, XAUUSD has gained over 20% , and analysts are warning: this may just be the beginning of a rally toward $4,000. As geopolitical tensions flare, supply chains for critical minerals falter, and traditional risk assets crumble, the spotlight is back on gold as the ultimate safe haven.
FreshForex analysts have been forecasting this surge since November 2023. We believe gold will remain a strong investment, supported by a range of powerful factors:
Trade war escalation: Donald Trump has signed executive orders targeting the reduction of U.S. reliance on imported strategic minerals like uranium, cobalt, and rare earths — the market reacted instantly. Conflicts, wars, sanctions, and international tension typically drive investors to seek refuge in gold.
Fed at a crossroads: The probability of a rate cut in May is 92.3% (CME data). Lower interest rates reduce returns on traditional fixed-income instruments like bonds, making gold a more appealing option for investors.
Central banks are stockpiling gold: In Q1 2025, global gold purchases surged 41% compared to 2024. Gold ETFs are holding a record $345.5 billion. Many countries are ramping up gold reserves to diversify away from the U.S. dollar, fueling further demand for physical gold.
Inflation and structural debt crisis in the U.S.: The University of Michigan forecasts consumer inflation at 6.7% — the highest since 1981. Rising yields, budget deficits, and political instability are accelerating capital flight from the dollar.
Goldman Sachs analysts (#GoldmanSac) have once again raised their gold forecast. The investment bank expects gold to reach $3,700 per ounce by the end of this year and $4,000 by mid-2026. Meanwhile, FreshForex believes the $4,000 mark could be tested as early as this year!

Gold Daily Outlook Short-Term Pullback Before Trend Continuation📌 Gold Daily Outlook – Short-Term Pullback Before Trend Continuation? 💡📉
📊 Technical Overview
Gold (XAU/USD) is currently testing a key resistance zone around 3412 – 3414, where we could see short-term selling pressure emerge after recent bullish momentum. Following a strong rally, the market may be preparing for a healthy retracement to collect liquidity before resuming the trend.
The chart shows signs of a potential intraday distribution pattern forming near highs, especially as price struggles to break above resistance during the early Asian session. Today’s outlook leans toward a short-term dip into support zones before buyers potentially step back in.
🔴 SELL ZONE (Short-term Reversal Opportunity)
Entry: 3412 – 3414
Stop Loss: 3420
Take Profit: 3409 → 3400 → 3390 → 3380 → 3370
This is a high-probability reversal zone. If price prints bearish confirmation (e.g., pin bar or engulfing candle), short entries may offer favourable risk-reward setups.
🟢 BUY ZONE 1 – Minor Pullback Area
Entry: 3355 – 3353
Stop Loss: 3348
Take Profit: 3358 → 3370 → 3380 → 3390 → 3400
Ideal for quick buy setups if price reacts cleanly to this mid-structure level.
🟢 BUY ZONE 2 – Deeper Support for Trend Re-entry
Entry: 3335 – 3333
Stop Loss: 3328
Take Profit: 3338 → 3350 → 3360 → 3370 → 3380
If a deeper pullback occurs, this zone may act as a key demand area and offer clean trend continuation opportunities.
🌍 Fundamental Insight
No major economic events are scheduled today, so market direction will likely follow technical structure.
USD is showing mild intraday strength, adding some pressure on gold in the short term.
Overall sentiment still supports gold as a safe-haven, but short-term profit-taking near highs is expected after recent aggressive buying.
⚠️ Strategy Notes
Focus on trading within defined structure: Sell from resistance with confirmation; buy dips at clean support zones.
Avoid FOMO entries – let the market give you confirmation.
Always use clear TP/SL levels – especially in a sensitive market environment like this.
💬 How are you approaching gold today? Looking to fade highs or waiting for dip-buy setups? Drop your thoughts below! 👇👇👇

ENA/USDT Breakout Pattern (18.04.2025)The ENA/USDT pair on the M30 timeframe presents a Potential Buying Opportunity due to a recent Formation of a Breakout Pattern. This suggests a shift in momentum towards the upside and a higher likelihood of further advances in the coming hours.
Possible Long Trade:
Entry: Consider Entering A Long Position around Trendline Of The Pattern.
Target Levels:
1st Resistance – 0.3015
2nd Resistance – 0.3217
🎁 Please hit the like button and
🎁 Leave a comment to support for My Post !
Your likes and comments are incredibly motivating and will encourage me to share more analysis with you.
Best Regards, KABHI_TA_TRADING
Thank you.

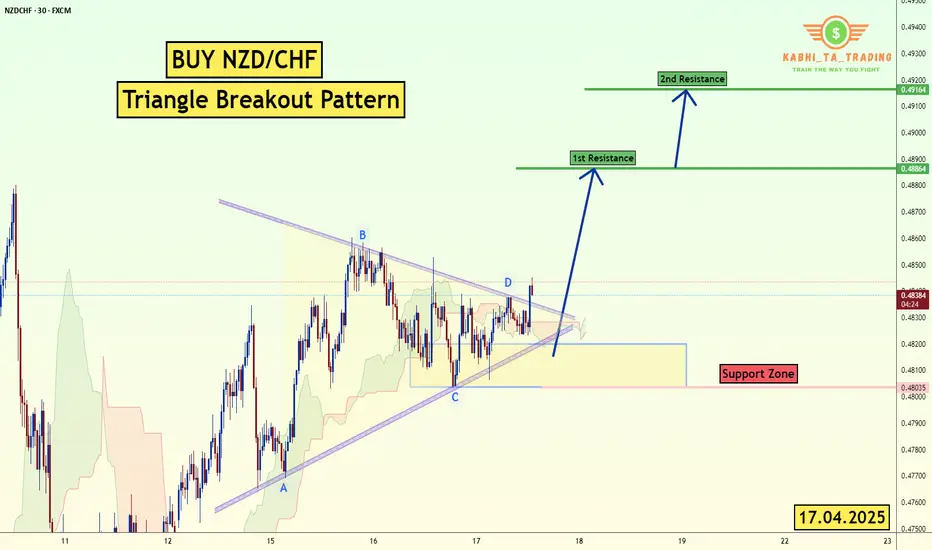
NZD/CHF Triangle Breakout (17.04.2025)The NZD/CHF pair on the M30 timeframe presents a Potential Buying Opportunity due to a recent Formation of a Breakout Pattern. This suggests a shift in momentum towards the upside and a higher likelihood of further advances in the coming hours.
Possible Long Trade:
Entry: Consider Entering A Long Position around Trendline Of The Pattern.
Target Levels:
1st Resistance – 0.4886
2nd Resistance – 0.4916
🎁 Please hit the like button and
🎁 Leave a comment to support for My Post !
Your likes and comments are incredibly motivating and will encourage me to share more analysis with you.
Best Regards, KABHI_TA_TRADING
Thank you.
Fundamental Market Analysis for April 18, 2025 USDJPYThe USD/JPY pair is down to 142.25 in thin trading session on Friday. The US Dollar (USD) is declining against the Japanese Yen (JPY) amid concerns over the economic impact of tariffs.
Data released by the Statistics Bureau of Japan on Friday showed that the national consumer price index (CPI) rose 3.6% in March, up from the previous reading of 3.7%. Meanwhile, the national CPI excluding fresh food was 3.2% y/y in March, up from 3.0% previously. The reading was in line with the market consensus.
Finally, the consumer price index excluding fresh food and energy rose 2.9% y/y in March vs. the previous reading of 2.6%. The Japanese Yen remains strong against the US Dollar as an immediate reaction to Japanese inflation data.
However, JPY gains may be limited as Bank of Japan (BoJ) officials signalled a pause in the consideration of interest rate hikes, emphasising the need to monitor uncertainty heightened by US tariff measures.
Economic data from the US on Thursday was mixed. US initial jobless claims fell to their lowest level in two months, signalling a stable labour market. In addition, the Philadelphia Fed index fell short of expectations, a warning shot from the manufacturing sector.
Trade recommendation: SELL 142.05, SL 143.40, TP 139.80
Gold Hits New Highs as US-China Tensions Escalate 📌 Gold Outlook: US-China Trade Tensions Fuel New Bullish Wave Amid Policy Uncertainty 🧨📈
🌍 Geopolitical Drivers Taking the Lead
On April 15th, President Donald Trump ordered an investigation into potential tariffs on all critical minerals imported into the U.S. – a move seen as the latest escalation in his ongoing economic confrontation with global trade partners, most notably China.
This development has shaken overall market sentiment, prompting investors to rotate into safe-haven assets like gold, which has surged in response.
At the same time, the U.S. Dollar weakened sharply, nearing 3-year lows last week, further increasing gold’s appeal for holders of other currencies.
🏦 Central Bank Uncertainty Adds Fuel to the Fire
Fed Chairman Jerome Powell stated that the central bank would not intervene to “rescue” markets during turbulent periods, suggesting that volatility may persist as hedge funds unwind leverage and global investors remain cautious.
He emphasized that the current volatility may be driven by shifting trade policies and broader uncertainty — which he said is “too early to fully diagnose.”
With central banks showing no immediate intent to inject liquidity or cut rates, the bullish case for gold remains strong in the coming weeks.
📊 Technical Outlook: New Highs in Sight, But Volatility Will Be Sharp
Gold continues to print new ATHs, and the dominant strategy right now is to trade with the trend — which clearly remains bullish. In such an environment, sudden drops are normal and not necessarily tied to any single news event.
Rather than attempting to short the market near highs, we are focusing on catching bullish continuation setups after sharp intraday corrections. These will likely form at support zones or classic continuation patterns on M15/M30 timeframes.
🔍 Price Levels to Watch
🟢 Support Zones:
3314 – 3300 – 3284 – 3266
🔴 Psychological Resistance:
3380 – 3396 – 3410
💼 Trade Plan
BUY ZONE:
Entry: 3300 – 3298
SL: 3264
TP Targets: 3304 → 3308 → 3312 → 3316 → 3320 → 3324 → 3330 → higher
SELL ZONE (Psychological Reaction Only):
Entry: 3396 – 3398
SL: 3402
TP Targets: 3392 → 3388 → 3384 → 3380 → 3376 → 3370
⚠️ Final Thoughts
We remain firmly buy-biased, especially as gold continues to be driven by macro and political catalysts. Pullbacks should be welcomed — not feared — and seen as opportunities to scale into longs at structure.
While intraday drops may appear sharp and sudden, they often lack fundamental backing and provide the best entry conditions for continuation traders. Be cautious with shorts — unless reacting to extended psychological resistance zones.
Always trade with a clear plan and never forget to honor your TP/SL levels to safeguard your capital.
💬 How are you navigating gold during this surge in global tension? Are you buying dips or waiting for a deeper correction? Let us know below! 👇👇👇
