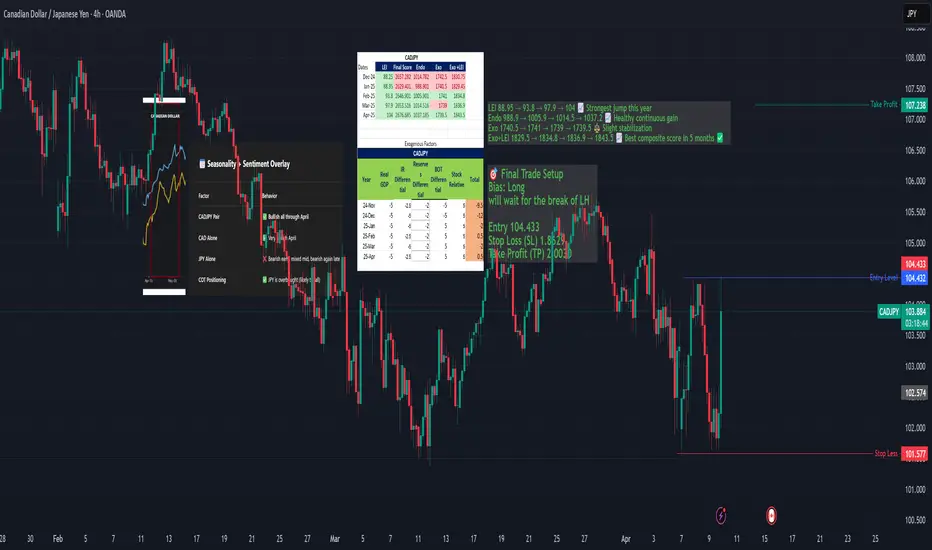
CADJPY: Bullish Setup Building — Fundamental AnalysisCADJPY is approaching a major support zone with a strong macro and seasonal backdrop favoring a bullish reversal.
Macro scores (LEI, endogenous) show consistent strength
Seasonality supports upside from late April into May
JPY is overbought per COT data
🔁 However, price structure remains bearish on 4H and Daily, so we are waiting for a confirmed CHoCH and HL before executing a swing long.
This idea is a "watch & prepare" setup — get ready to strike once structure flips.
Fundamental-analysis
Markets On Edge: Gold Soars, Dollar Stumbles, Bitcoin Bounces 🔍 Midweek Market Outlook: What’s Driving DXY, Gold & Bitcoin Right Now?
We’re in the middle of one of the most eventful trading weeks of the year.
The U.S. Dollar is retreating under policy pressure
Gold has officially gone parabolic, smashing through $3,000
Bitcoin is pulling back hard, down nearly 30% from its highs
These aren’t just price moves — they’re reflections of real economic stress and shifting capital flows.
In this week’s outlook, I break down:
📌 The key macro drivers behind these moves
📌 How the latest inflation data, Fed tone, and geopolitics are shaping sentiment
📌 Why gold is rallying like it’s 1980 all over again
📌 And what traders should anticipate next on DXY, XAUUSD, and BTCUSD
If you trade or invest in these markets, this is one of those weeks where fundamentals can’t be ignored.
🧠 Insights. 🎯 Forecasts. 🛠️ Trade Prep.
Check it out — link in the comments.

GOLD MARKET UPDATE – Trend Breakouts and Market Structure Shift🟡 GOLD MARKET UPDATE – Trend Breakouts and Market Structure Shift
Gold has broken through both the parallel ascending channel and a narrow triangle pattern at the edges, resulting in a strong buying momentum (FOMO BUY). This move can be attributed to a mild positive shift in the US stock market yesterday, along with some upward momentum in the Asian and European markets today.
📉 Current Situation: It’s still unclear whether this movement is tied to positive news about tariffs, but an important level to watch is 3075 – 3077. If this level is breached, it may be time to reassess the outlook and consider shifting towards a BUY.
💡 Currently, there’s strong buying activity during the European session. It’s recommended to avoid jumping into BUY positions at these levels and to refrain from selling too aggressively.
📌 Scenario for Today: Look for potential BUY opportunities at the important levels 3030 – 3018 during the European session, and stay tuned for updates regarding FOMC tonight.
🔮 Be Cautious: The FOMC meeting will take place later today, which could lead to significant market movements. Be prepared for potential volatility and liquidity sweeps in less liquid areas.
🧭 Key Technical Levels:
🔺 Resistance: 3075 – 3090 – 3110
🔻 Support: 3030 – 3018 – 3000 – 2988 – 2974
🎯 Trade Setup:
🔴 SELL ZONE: 3074 – 3076
SL: 3080
TP: 3070 – 3066 – 3062 – 3058 – 3054 – 3050 – 3040
🟢 BUY ZONE: 2976 – 2974
SL: 2970
TP: 2980 – 2984 – 2988 – 2992 – 2996 – 3000
📌 Reminder: The market is currently very sensitive, so stick to risk management rules, ensure full TP/SL implementation, and avoid making hasty decisions.
Be cautious and watch the market movements closely!
— AD | Money Market Flow

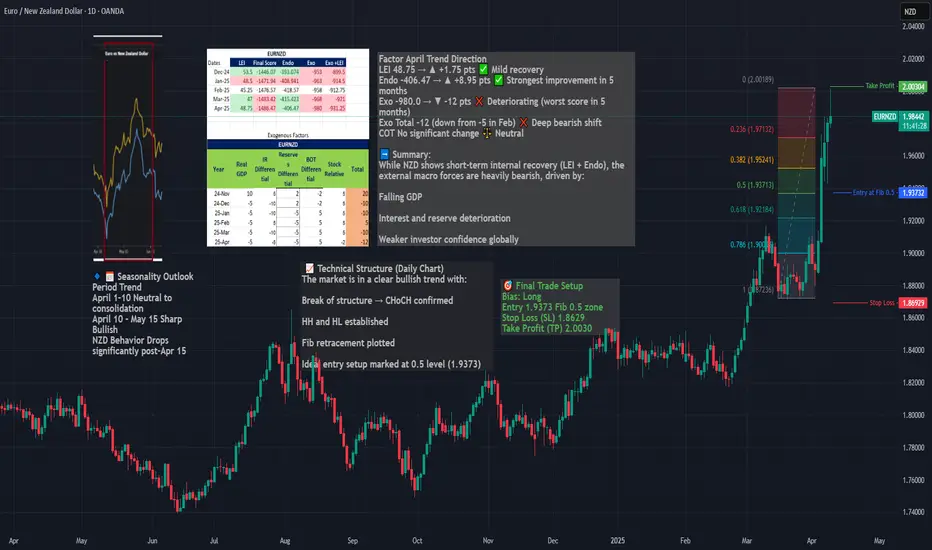
Long EURNZD – Seasonal, Fundamentals & Technical ConfluenceWe are entering a long position on EURNZD, capitalizing on a powerful confluence of:
Seasonal EUR strength + NZD weakness (April 10 – May 15)
A clear bullish market structure (CHoCH, HH/HL)
A clean Fibonacci retracement entry at 0.5
Strong macro divergence, with NZD exogenous conditions deteriorating
Macro & Seasonal Context
EUR enters a strong seasonal uptrend from April 10 to end of month
NZD shows seasonal weakness from April 15 onward
NZD’s exogenous model score worsened to -12 in April
While NZD LEI and endo improved, it remains structurally weak
Timing
Best execution: on pullback to 1.9373 zone, ideally between April 10–15, aligned with seasonal entry window.
Will the support zone keep BTC falling?BTC has once again bounced off the upper border of the downtrend channel. Here, it is worth remembering the long-formed gap around $74,500, which was closed during the last decline.
Here, you can see how the price fell into a strong support zone from $77,742 to $73,980, but if this zone is broken, we can again see a strong decline around also very strong resistance and the lower border of the channel at $68,590.
Looking the other way, you can see that the increases were stopped by the resistance zone from $84,000 to $86,700, only breaking out of this zone at the top will give the possibility of growth towards strong resistance at $94,300.
The RSI is still in the lower part of the range and is again heading towards the lower borders, but here the price has formed a lower low, which can still give another reaction.

GOLD MARKET OUTLOOK – Investor Panic After Fake News🟡 GOLD MARKET OUTLOOK – Investor Panic After Fake News, Bearish Bias Remains
📉 Current Strategy: Focus on SELL setups at key resistance zones – short-term bearish outlook remains valid
📌 US Session Recap:
Gold saw a sharp sell-off after a fake news report circulated about the US delaying its planned tariff policy.
→ While the White House later confirmed it was misinformation, the damage was done — panic selling hit across global markets.
💥 As a result, gold dropped aggressively and reached the 295x zone, aligning perfectly with AD’s previous short bias.
Meanwhile, US equities also continued to bleed red.
🧠 Market Sentiment: “Cash is King” is Back
With global instability and fear on the rise:
🔹 Investors are hoarding cash
🔹 USD demand increases, along with inflows into US government bonds
🔹 Risk assets like gold, stocks, and crypto are being dumped
💡 This could be part of Trump’s larger play — forcing global capital to flow back into US Treasuries while applying pressure on speculative markets.
🔮 AD’s View:
Unless we see a clear shift in investor sentiment, the base case remains: → Sell rallies through midweek, then reassess.
🧭 Key Technical Zones to Watch:
🔺 Resistance: 3005 – 3016 – 3035 – 3056 – 3076
🔻 Support: 2980 – 2969 – 2956 – 2930 – 2912
🎯 TRADE PLAN:
🟢 BUY ZONE: 2930 – 2928
SL: 2924
TP: 2934 – 2938 – 2942 – 2946 – 2950
🔴 SELL ZONE: 3034 – 3036
SL: 3040
TP: 3030 – 3026 – 3022 – 3018 – 3014 – 3010 – ???
📌 Keep an Eye on DXY:
The US Dollar Index is currently testing a major 3-year support level.
→ If equities fail to recover and fear persists, DXY could bounce — and gold would likely continue its correction lower.
⚠️ Final Note:
We’re in a highly volatile and uncertain environment.
→ Stick to the plan. Respect your SL/TP levels. Avoid emotional decisions.
—
📣 Found this perspective useful? Follow for daily macro-backed trade ideas and real-time market structure breakdowns.
Clarity. Consistency. Risk Management.
— AD | Money Market Flow

Fundamental Market Analysis for April 8, 2025 EURUSDAfter a tense week in which the US fully adopted a protectionist trade policy - despite lacking the necessary industrial infrastructure - tariffs on imports were imposed. The US now applies a general 10 per cent import tax on all goods from each country, as well as various ‘reciprocal’ tariffs calculated by dividing US imports by exports. After imposing a 34 per cent tariff on Chinese products, China responded with its own 34 per cent tariff on all goods imported from the US. Unable to find alternative solutions, the Trump administration threatened to impose an additional 50 per cent tariff on all Chinese goods, which is set to take effect on April 8.
US data takes centre stage again this week, with the release of Consumer Price Index (CPI) data on Thursday. On Friday, producer price index (PPI) data and the University of Michigan (UoM) consumer sentiment survey are expected.
Investors are raising bets that the Federal Reserve (Fed) will begin cutting interest rates to reduce recession risks. Markets are factoring in nearly 200 basis points of rate cuts through the end of 2025, despite the Fed issuing cautious policy statements indicating that trade uncertainty complicates any potential rate cut.
Trade recommendation: SELL 1.0950, SL 1.1030, TP 1.0830

THE REALITY!You cant beat the Index fund in Long term growth....Compare your portfolio with Major Indices
Warren buffet Quote - You can't Beat S&P500 Index

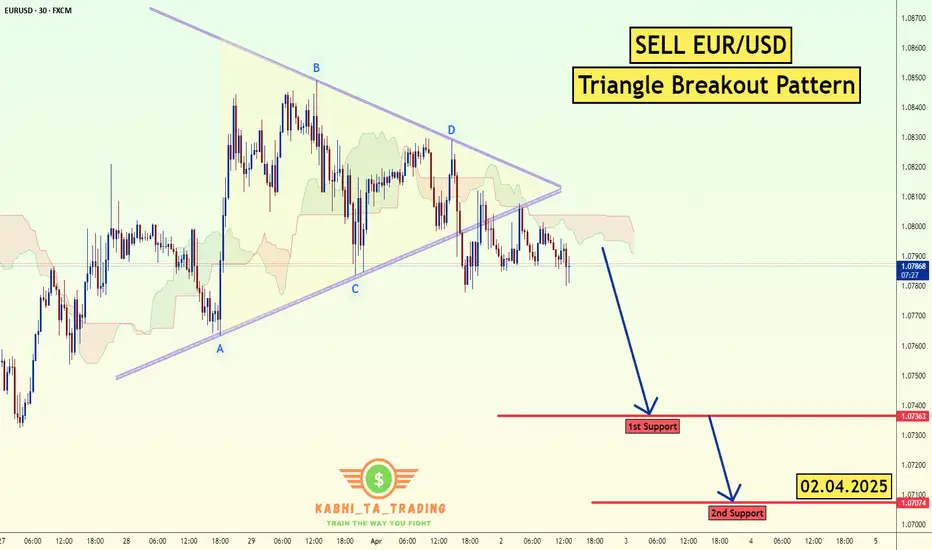
EUR/USD Triangle Breakout (07.04.2025)The EUR/USD Pair on the M30 timeframe presents a Potential Selling Opportunity due to a recent Formation of a Triangle Breakout Pattern. This suggests a shift in momentum towards the downside in the coming hours.
Possible Short Trade:
Entry: Consider Entering A Short Position around Trendline Of The Pattern.
Target Levels:
1st Support – 1.0825
2nd Support – 1.0719
🎁 Please hit the like button and
🎁 Leave a comment to support for My Post !
Your likes and comments are incredibly motivating and will encourage me to share more analysis with you.
Best Regards, KABHI_TA_TRADING
Thank you.

GOLD WEEKLY OPEN – Sentiment-Driven Marke🟡 GOLD WEEKLY OPEN – Sentiment-Driven Market as Asian Sellers Hit Early
Gold kicked off the new week with a sharp drop during the early Asian session, falling over 40 points from last week’s highs into the 297x zone — a move that reflects lingering sell-side pressure from last Friday’s close.
However, price quickly rebounded nearly 40 points, showing clear buy-side interest at the 297x zone — which acts as a key structural support on the H4 and D1 timeframes.
📌 If price breaks below this level convincingly, it could trigger a deeper move toward 295x.
🔍 Technical Breakdown:
The overall structure on H4 and D1 remains bullish
But right now, investor sentiment is leading, not just technicals
On H1 and H2, price is reacting to the 0.5 Fibonacci retracement zone
If gold closes below 3030, we could see another leg down into the 295x area
🧠 Sentiment Is In Control (For Now)
So far, only Asia and Australia have shown their hand
We’re waiting on London and New York to step in before confirming trend direction
With price whipping around inside a broad range — only trade from key zones with clear price reaction
🧭 Key Technical Zones:
🔺 Resistance:
3055 – 3076 – 3107
🔻 Support:
3024 – 3005 – 2970 – 2952
🎯 Trading Plan:
🟢 BUY ZONE: 2980 – 2978
SL: 2974
TP: 2984 – 2988 – 2992 – 2996 – 3000
🔴 SELL ZONE: 3076 – 3078
SL: 3082
TP: 3072 – 3068 – 3064 – 3060 – 3056 – 3050
📅 What To Watch This Week:
This week brings major market movers:
CPI → PPI → Fed speakers — all lined up midweek.
→ Be selective with your trades and keep tight risk control.
AD will continue updating intraday zones across sessions.
✅ Trade smart. Respect your risk. Let the market come to you.
— AD | Money Market Flow

GOLD BREAKS SHARPLY — BUT THE MOVE WAS WRITTEN IN THE STRUCTURE🟡 GOLD BREAKS SHARPLY — BUT THE MOVE WAS WRITTEN IN THE STRUCTURE
A steep drop in gold just rattled the markets — but if you’ve been following the macro and technical setup closely, this was not only expected, but anticipated.
From the first week of April, we’ve been tracking signals of potential exhaustion in XAUUSD:
🕯️ Candlestick wicks on higher timeframes
📈 Overextended structure
🧠 Macro divergence
Now, all signs have converged — and we’re finally seeing the correction play out.
🔍 Why This Isn’t Just About Gold
What we’re seeing is a broader shift in global market sentiment:
U.S., European, and Asian equities are all under pressure
Crypto has stagnated with little to no fresh capital inflow
Gold — after months of aggressive buying — is now facing wave after wave of profit-taking
This is classic risk-off behaviour.
Investors are choosing cash, sitting tight, and waiting for clarity — not only in the charts but in the headlines too.
📉 DXY Building a Case for Recovery
The U.S. Dollar Index (DXY) has been heavily sold in recent months — but is now holding at a multi-year structural support zone that’s been tested multiple times since 2021.
With Trump returning to the spotlight and triggering a fresh round of global tariff negotiations, the USD is regaining narrative strength.
Trump’s stance has already prompted discussions among major economies, putting the U.S. in a dominant position — and the market is beginning to price that in.
🤔 What’s Holding the Fed Back?
Despite rising trade tensions, the Federal Reserve has remained cautious — choosing not to act until the dust settles from geopolitical and policy developments.
This creates a window of opportunity:
If the Fed holds rates while global central banks soften
And if the USD holds this major support
→ We could see strong dollar flows return in Q2.
🔮 Gold Outlook – Where Next?
In the short term:
Expect continued volatility
Potential for gold to slide further toward 308x – 305x range
Any bounce is likely to be technical rather than fundamental
In the medium term:
Once political noise fades, gold may find support again
Especially if inflation expectations persist or the Fed pivots dovish later in Q2
💡 Takeaways for UK Traders
✅ Don't trade the news — trade the reaction
✅ Macro structure matters more than the daily headlines
✅ Capital preservation beats chasing euphoria
We’re not guessing.
We’re reading the story and planning with structure.

XAUUSD-GOLD can still break upward ? read captionGold (XAU/USD) has just soared to a new all-time high, reflecting heightened investor demand for safe-haven assets amid economic uncertainties. The surge comes as global markets react to inflation concerns, geopolitical tensions, and shifting monetary policies, further strengthening gold’s position as a premier store of value. With central banks increasing their reserves and investors seeking stability, the precious metal continues to shine, marking a historic moment in the financial markets.

IS THE GLOBAL “BIG SHORT” ON ITS WAY?TRADE WAR WARNING – IS THE GLOBAL “BIG SHORT” ON ITS WAY?
In the last 24 hours, global financial markets were rattled after Donald Trump unveiled a sweeping set of new global tariffs. This wasn’t just a political move — it may well mark the beginning of a new wave of global economic instability.
Markets across the board took a hit:
📉 US, European, and Asian equities
📉 Gold (XAU/USD), the US Dollar Index (DXY), and even crypto — all plunged into the red.
🔍 So, What Actually Happened?
Gold dropped by over 100 points in a single session — and strangely, the US dollar also fell.
Normally, a weaker USD would support gold. So why did gold sell off this time?
➡️ One likely explanation is that institutional investors sold gold positions to cover losses in equity markets, or to free up margin amidst the chaos.
📉 This wasn’t just a correction — it might be the early signal of a global BIG SHORT forming across multiple asset classes.
🧨 The Start of Something Bigger?
Markets aren’t just reacting to tariffs. They’re pricing in the risk of a full-scale trade war, which could disrupt global supply chains and hammer corporate earnings.
Industries like construction, healthcare, logistics, and manufacturing are already showing signs of strain.
If this escalates, we could be looking at something far more serious than a short-term sell-off.
📉 The Data Doesn’t Look Great Either
While inflation in the US continues to cool, other key data points are deteriorating:
ISM Services PMI (March): 50.8 (vs 53.0 expected)
Employment sub-index: 46.2 (down sharply from 53.9)
New orders, export orders and backlogs also fell
👉 These are real signs of economic slowdown, especially considering that services make up over 70% of the US economy.
🧠 Market Sentiment: FOMO, Fear, and Panic
At the moment, it’s hard to ignore how unsettled sentiment has become.
Retail and institutional traders alike are acting on fear. And that’s dangerous.
🔔 Tonight’s Non-Farm Payrolls (NFP) report could either calm things down — or add more fuel to the fire.
🏦 Will the Fed Cut Rates Sooner?
Markets are rapidly shifting their expectations:
A rate cut could come as early as May or June 2025
Traders are now pricing in 2 to 4 cuts this year (previously just 2)
There’s now a strong chance the Fed pivots earlier than expected
If jobs data continues to soften, the Fed may have no choice but to act faster — despite core inflation not yet fully under control.
⚠️ Trading Strategy: Observation Over Action
Right now, your best position might be… no position.
"Sometimes, the most profitable trade is the one you don’t take."
This isn’t the time to chase wild price action.
It’s the time to prepare and plan with logic — not emotion.
📊 Key Technical Levels on XAU/USD
🔺 Resistance:
3110 – 3119 – 3136 – 3148 – 3167
🔻 Support:
3086 – 3075 – 3055 – 3040 – 3024
🟢 BUY ZONE: 3056 – 3054
SL: 3050
TP: 3060 – 3064 – 3068 – 3072 – 3076 – 3080
🔴 SELL ZONE: 3148 – 3150
SL: 3154
TP: 3144 – 3140 – 3136 – 3132 – 3128 – 3124 – 3120
💬 Final Thoughts
The combination of tariffs, recession fears, and rate cut speculation is building into what could become a perfect storm.
Gold is in the eye of that storm.
Now is not the time to panic — but to trade with clarity and control.
📌 Don’t let emotion drive your trades.
Stick to the chart. Stick to your plan. Protect your capital.
🧠 Patience is what separates the lucky from the consistently profitable.

Fundamental Market Analysis for April 4, 2025 GBPUSDGBP/USD briefly broke above 1.32000 for the first time in six months on Thursday and climbed to fresh highs amid widespread weakness in the US Dollar. The Trump administration's reciprocal tariffs and flat tariffs knocked the legs out from under market sentiment, despite a delayed reaction to the tariff announcements that followed after US markets closed on Wednesday.
A fairly quiet calendar of economic publications is expected in the UK this week. However, investor attention will be focused on Friday's release of the US Non-Farm Payrolls (NFP) report. This data could have a major impact on market sentiment as the US economy enters a post-tariff phase. The March employment report is predicted to be a marker of sorts for the impact of the Trump administration's trade policies.
In addition, the ISM's US services business activity index (PMI) for March, released on Thursday, added to the negativity by falling to 50.8, its lowest level in nine months. The drop in the index was one of the fastest since the pandemic began. Weakening business activity and declining consumer optimism began before the tariffs went into effect, and are unlikely to normalize quickly anytime soon.
President Donald Trump approved the imposition of a 10 percent duty on all imports starting April 5, and the counter tariffs took effect on April 9. Analysts at Fitch Ratings believe U.S. GDP growth will be lower than the March forecast, which had previously been adjusted downward. The agency also warned that the effect of the tariff policy may affect the decisions of the Federal Reserve: the Fed may suspend the easing of monetary policy while it assesses the impact of duties on inflation and labor indicators.
Trading recommendation: BUY 1.30900, SL 1.30200, TP 1.32000

Non-Farm Payrolls – April 4: The key market driver!On Friday, April 4, 2025 at 3:30 PM EET, the U.S. Department of Labor will release one of the most anticipated macroeconomic reports — the Non-Farm Payrolls (NFP). This figure reflects the change in the number of jobs in the non-farm sector and is a crucial indicator of economic health. Strong numbers suggest economic expansion and may prompt the Fed to tighten monetary policy, while weak data could strengthen expectations of rate cuts — impacting stocks, the U.S. dollar, bonds, and commodities.
Historically, NFP reports have triggered significant market reactions, with sharp movements depending on the actual data versus expectations. Analysts forecast a moderate job gain, indicating a slowdown compared to recent months. The release comes amid uncertainty linked to new tariffs introduced by President Trump, which may affect business confidence and consumer spending. Investors are closely watching for signals on the economy’s direction and potential Federal Reserve actions.
How could NFP impact the markets?
• Stock market: Weak data could stoke recession fears, pressuring equities, especially in cyclical sectors. However, if seen as a reason for Fed easing, markets may rebound.
• U.S. Dollar: A disappointing report might weigh on the dollar as investors adjust their rate expectations. Strong figures, on the other hand, would support USD.
• Bonds: Slower job growth could drive demand for U.S. Treasuries, pushing yields lower.
• Gold: In case of weak data, gold may rally as a safe haven amid rising expectations of looser monetary policy.
Economists expect a job gain of around 140,000, lower than previous figures — a scenario that could increase market volatility. Get ready for big moves!

XAU/USD Trendline Breakout (02.04.2025)The XAU/USD Pair on the M30 timeframe presents a Potential Selling Opportunity due to a recent Formation of a Trendline Breakout Pattern. This suggests a shift in momentum towards the downside in the coming hours.
Possible Short Trade:
Entry: Consider Entering A Short Position around Trendline Of The Pattern.
Target Levels:
1st Support – 3077
2nd Support – 3048
🎁 Please hit the like button and
🎁 Leave a comment to support for My Post !
Your likes and comments are incredibly motivating and will encourage me to share more analysis with you.
Best Regards, KABHI_TA_TRADING
Thank you.

GOLD TRADING PLAN – After Breaking ATH & Sharp CorrectionGOLD TRADING PLAN – After Breaking ATH & Sharp Correction
🔥 Former U.S. President Donald Trump has officially announced a comprehensive global tariff policy, targeting multiple countries and regions. This sparked:
📉 A major sell-off in risk assets
💵 A sharp weakening in the U.S. Dollar
🪙 A strong rally in gold, reaching a new All-Time High (ATH) at 3167 as a preferred safe-haven asset
📉 Latest Market Reaction – Gold Corrects from ATH
After a strong bullish breakout, gold is now pulling back from its peak, driven by profit-taking and investor caution ahead of key economic data — including the upcoming Nonfarm Payrolls (NFP) report.
Despite the short-term pullback, the overall trend remains bullish on higher timeframes.
📐 Technical Overview
Yesterday, we identified and traded a symmetrical triangle pattern, which broke out sharply as expected. Now, price is retesting previous breakout zones — where new long opportunities may form.
📌 Focus on BUY setups during the Asian & EU sessions, and be cautious during the U.S. session due to expected volatility.
🔍 Key Technical Levels
🔺 Resistance Levels:
3167 (ATH) – 3175 – 3185 – 3198 – 3206
📝 (These are psychological levels & Fibonacci extensions. Wait for clear candle confirmation before entering.)
🔻 Support Levels:
3140 – 3132 – 3120 – 3112 – 3106 – 3100
🛒 TRADE PLAN
🟢 BUY ZONE: 3112 – 3110
🛑 Stop Loss: 3106
🎯 Take Profits: 3116 – 3120 – 3124 – 3128 – 3132 – 3136 – 3140
🔴 SELL ZONE: 3167 – 3169
🛑 Stop Loss: 3173
🎯 Take Profits: 3162 – 3158 – 3154 – 3150
⚠️ Final Notes
📈 The uptrend is still in play — no need to FOMO sell near the highs.
⏳ Be patient, wait for price to react at key support/resistance zones.
🚫 Avoid overtrading or rushing into trades — tariff news has major global impact.
📅 Stay sharp ahead of Friday’s NFP release — we'll reassess trend direction after the data.
✅ Stick to your risk management: follow your TP/SL strictly.
Wishing you safe & profitable trades! 💼📊

Gold (XAU/USD) : Bullish Setup with Key Demand Zone🔹 Trend Line & Demand Zone 📈
* The trend line shows an upward trend. 🚀
* The demand zone 🟦 acts as strong support, where buyers are likely to step in.
🔹 Price Action 🔍
* Price is bouncing off the demand zone ➡️ Bullish Signal 📊🔥
* Higher lows forming, indicating potential upward momentum.
🔹 Trade Setup 🎯
✅ Entry Point: Near the demand zone 🟦
❌ Stop Loss: 🔽 3,099.26 (Below demand zone)
🎯 Target Point: ⬆️ 3,148.58 (Key resistance area)
🔹 Expected Movement 🏆
* A slight pullback 📉 before a strong push up 📈💪
* If price holds the demand zone, 🚀 potential rally ahead!
🔹 Risk-to-Reward Ratio ⚖️
* Favorable trade setup ✅ High reward, controlled risk 🎯
🔹 Final Verdict 🔥
📊 Bullish Bias ✅ As long as demand zone holds!
🚨 Warning: If price breaks below 3,099.26, expect further downside!

Fundamental Market Analysis for April 3, 2025 EURUSDEUR/USD saw a bullish spike on Wednesday after the Trump administration announced tariffs that were less severe than many investors expected given President Donald Trump's flurry of tariff threats over the past 72 days. While the specific tariff proposals are unclear, U.S. consumers should prepare for flat 10 percent tariffs on all imports, significant 25 percent tariffs on all automobiles and auto parts, and “reciprocal” tariffs imposed at different rates depending on the country.
In addition, Trump has reiterated his intention to impose additional tariffs on goods such as copper, microchips, and other important imported consumer goods that are vital to the U.S. economy. As these tariffs are likely to drive up consumer prices in the coming months and there is no obvious alternative in the market to obtain foreign goods without incurring high import duties, inflationary pressures are expected to rise soon and persist longer than desired. According to Federal Reserve (Fed) officials, the uncertainty of the Trump administration's trade policy is likely to keep interest rates elevated for an extended period beyond previous expectations.
European economic indicators are likely to remain moderately light for the rest of the trading week. Meanwhile, new US Non-Farm Payrolls (NFP) data is expected this Friday. The NFP report could have a significant impact on the markets as the US economy moves into a post-tariff phase, and the March labor statistics will be a key indicator of the impact of the Trump administration's tariff strategy.
Trading recommendation: BUY 1.09100, SL 1.08400, TP 1.10300

ADP in Focus: Will Strong Jobs Data Trigger Gold Pullback?🟡 GOLD MARKET BRIEF – Early Asian Surge Meets Resistance Ahead of Key US Jobs Data
Gold kicked off the day with a sharp rally during the Asian session, driven by consistent demand from Asian and Middle Eastern investors — a pattern we’ve seen forming repeatedly during early sessions lately.
However, price reacted swiftly at the 3130–3135 resistance zone, exactly as mapped out in yesterday’s trading plan. With sellers stepping in again, my outlook remains:
🔻 Look for reaction-based SELL opportunities in the Asian and London sessions, especially if price pulls back into key resistance.
📉 Technical Outlook:
Gold is approaching the apex of a symmetrical triangle pattern, suggesting a breakout is imminent.
✅ As always: Wait for the breakout — then trade the retest in the confirmed direction.
📰 Fundamental Focus:
All eyes today will be on the US ADP Non-Farm Employment report, which tends to offer early clues ahead of Friday’s NFP.
Should the data come in stronger than expected, USD could gain traction — likely applying downward pressure on Gold, in line with our target zone around 308x–307x.
🧭 Key Technical Levels:
🔺 Resistance: 3128 – 3135 – 3142 – 3148
🔻 Support: 3110 – 3100 – 3080 – 3070
🎯 Trade Plan:
🟢 BUY ZONE: 3102 – 3100
SL: 3096
TP: 3106 – 3110 – 3114 – 3118 – 3122 – 3126 – 3130
🔴 SELL ZONE: 3148 – 3150
SL: 3154
TP: 3144 – 3140 – 3136 – 3132 – 3128 – 3124 – 3120
📌 Caution: With ADP on deck during the US session, expect a spike in volatility.
Stick to clear levels, protect capital, and trade with discipline — not emotion.
Let the market come to you.
— AD | Money Market Flow

EUR/USD Triangle Breakout (02.04.2025)The EUR/USD Pair on the M30 timeframe presents a Potential Selling Opportunity due to a recent Formation of a Triangle Breakout Pattern. This suggests a shift in momentum towards the downside in the coming hours.
Possible Short Trade:
Entry: Consider Entering A Short Position around Trendline Of The Pattern.
Target Levels:
1st Support – 1.0736
2nd Support – 1.0707
🎁 Please hit the like button and
🎁 Leave a comment to support for My Post !
Your likes and comments are incredibly motivating and will encourage me to share more analysis with you.
Best Regards, KABHI_TA_TRADING
Thank you.
Fundamental Market Analysis for April 2, 2025 USDJPYThe Japanese Yen (JPY) fails to capitalise on the previous day's modest gains against its US counterpart and attracts fresh sellers during Wednesday's Asian session. The USD/JPY pair, however, remains in the range it has been in since the beginning of this week as traders await a new catalyst before positioning for the next leg of directional movement. As such, attention will remain focused on US President Donald Trump's announcement of retaliatory tariffs later today.
Meanwhile, speculation that the slowdown in the economy caused by the tariffs may force the Bank of Japan (BoJ) to keep policy steady for now is undermining the yen. However, investors seem convinced that the BoJ will continue to raise interest rates amid signs of rising inflation in Japan. This is a significant divergence from the growing confidence that the Federal Reserve (BoJ) will resume its rate-cutting cycle in June, and should support the lower-yielding Japanese Yen.
Trade recommendation: SELL 150.00, SL 150.90, TP 148.60

Gold Eyes Fresh Highs Amid Geopolitical Tensions🟡 Gold Eyes Fresh Highs Amid Geopolitical Tensions & Quarter-End Volatility
Gold started April with a strong bullish gap, reaching another all-time high during the Asian session. Price is now trading near the upper bound of a multi-day structure, supported by ongoing geopolitical risks, macro uncertainty, and flight-to-safety flows.
European and UK traders should remain cautious today, as end-of-month volatility may lead to fake breakouts, stop hunts, and liquidity grabs – especially ahead of key U.S. economic data later this week.
🧠 Market Context:
Risk sentiment remains fragile as global equities faced pressure overnight.
Safe haven demand is elevated following weekend headlines tied to geopolitical conflict and natural disaster risks in Asia.
Traders are also watching the market’s reaction to Trump’s softened tone on tariffs — potentially shifting macro flows in risk assets.
🔍 Technical Outlook:
Price action remains bullish overall, but the pair is extended at current levels.
Expect high volatility today as monthly candles close — with a chance of both upside wicks and liquidation dips.
Scalping or reacting at well-defined zones is preferred over chasing.
🧭 Key Technical Levels:
🔺 Resistance: 3158 – 3166 – 3172 – 3180
🔻 Support: 3133 – 3122 – 3111 – 3100
🎯 Trading Plan:
🟢 BUY ZONE: 3122 – 3120
SL: 3116
TP: 3126 – 3130 – 3134 – 3138 – 3142 – 3146 – 3150
🔴 SELL ZONE: 3170 – 3172
SL: 3176
TP: 3166 – 3162 – 3158 – 3152 – 3148 – 3144 – 3140
⚠️ Final Note:
Today’s session could be chaotic with month-end flows and low liquidity pockets.
Stick to clean setups. Wait for confirmation. Always use SL/TP.
📌 If you found this plan helpful, like & follow for daily setups and institutional-level insights.
📊 Trade with structure, manage your risk, and let the market come to you.
