Fundamental Market Analysis for October 30, 2025 USDJPYThe yen weakened after the Bank of Japan kept its policy rate near 0.50% today, again declining to back proposals from some members for a move to 0.75%. The statement keeps future steps “in view” but offers no timeline, reinforcing the yield differential in favor of the United States and supporting USD/JPY near the top of its recent range.
An additional impulse for USD comes from the Fed: while it delivered a 25 bps cut, Chair Powell stressed that subsequent actions are not predetermined. For USDJPY, what matters is not the single rate print but expectations for U.S. Treasury yields and risk appetite. Yields along the curve remain relatively high, and the Fed’s readiness to pause points to a slower easing cycle, which supports the dollar against the yen.
External factors round out the picture: moderately positive global risk sentiment and the absence of strong signals from Japan’s Ministry of Finance about interventions. Given the current monetary-policy trajectories in the U.S. and Japan, upward attempts in USDJPY persist while pullbacks look contained.
Trading recommendation: BUY 152.750, SL 152.100, TP 153.500
Fundamental-analysis

Fundamental Market Analysis for October 29, 2025 GBPUSDSterling softens against the dollar ahead of the Fed decision as some investors take profit after recent attempts to rally. The U.S. market still anticipates a 25 bps rate cut, but the dollar’s intraday recovery into the meeting weighs on GBPUSD.
Domestic drivers for the pound are mixed. Recent UK inflation data came in softer than forecast, reinforcing expectations that the Bank of England will approach policy with greater caution and limiting GBP upside. Budget and borrowing headlines earlier in the year also added volatility, keeping the pair around 1.33000 and below at times.
Also yesterday, the prevailing assessment was that the GBP/USD upside momentum was unstable and largely dependent on external drivers—the US dollar exchange rate and expectations for further Fed easing. Under these conditions, selling on a rise toward 1.32750, with an eye on a return to 1.32000, should the Fed remain neutral or moderately cautious, makes strategic sense.
Trade recommendation: SELL 1.32650, SL 1.32850, TP 1.32000

NTSK Netskope: the rocket is on the padNetskope’s shares (ticker NTSK) are trading after a successful IPO, but the chart suggests we’re still in early accumulation phase. The price is hovering in the ~$21-24 zone, and a breakout above near resistance is needed to confirm strength. The first target is $28, with potential extension toward $35–40 if the structure holds. Given IPO volatility, entry requires careful stop-management and confirmation of trend support.
Netskope operates in the rapidly expanding cloud security market (SASE/Zero Trust). With revenue growth exceeding 30% and narrowing losses, the company is well-positioned in the AI-security wave. While the TAM (total addressable market) is large and growth prospects strong, the business still faces profitability and competitive risks.
The rocket may not yet be launched, but the launchpad is set. Stay patient, wait for the “ignition” signal, and let the engine build thrust before liftoff.

Nikkei surges higher: What’s powering the market now#NIKKEI has soared above 50,000. The rally is fueled by a mix of political momentum following Sanae Takaichi’s arrival, the predictably dovish stance of the Bank of Japan, a weak yen benefiting exporters, accelerating corporate reforms, and a revival in tourism and domestic demand — all pushing profit expectations and valuations to record highs.
Key drivers of further #NIKKEI growth:
Weak yen + dovish BoJ : Exporters earn more when converting foreign revenue into yen; cheap credit keeps valuations and multiples strong.
AI and semiconductor investment cycle : Japan is expanding chip fabs, while local suppliers of materials and equipment enjoy long-term contracts and steady cash flow.
Corporate reforms & buybacks : Companies are selling off non-core assets, boosting efficiency, and buying back shares — lifting EPS and investor confidence.
Tourism & services boom : Japan is affordable for travelers, spending is up, and hotels, retailers, restaurants, and transport firms are reporting record revenues.
Rising wages & consumption : Households have more disposable income; businesses raise prices moderately, margins stay solid, and revenues grow steadily across sectors.
#NIKKEI’s growth isn’t only about the weak yen. FreshForex analysts believe political reform momentum, loose monetary policy, renewed chip demand, disciplined corporate management, and a robust services/tourism sector are key supports. The base scenario: the uptrend could extend through 2025–2026, though risks include a sharp yen rebound or political delays.

Weekly Outlook: XAUUSD, #SP500, #BRENT for 27-31 October 2025XAUUSD: BUY 4075.00, SL 4025.00, TP 4225.00
Gold starts the week near record territory, with spot prices fluctuating around $4,080 per ounce. Support comes from expectations of a Federal Reserve rate cut at the October 28–29 meeting and the recent pullback in U.S. Treasury yields ahead of the decision. Headlines about a potential temporary government funding pause in the U.S. and delayed data releases enhance gold’s role as a defensive asset, while September inflation came in slightly below expectations, reinforcing the case for policy easing. In addition, fund inflows into gold have stayed strong after October’s price spike.
The fundamental backdrop remains constructive: World Gold Council data point to renewed net purchases by central banks late in the summer, and October saw more active investment flows into “paper” gold as market volatility rose and real yields eased. Risks to this view include a more cautious Fed tone and a brief dollar rebound after the decision, but these are offset by steady institutional demand and ongoing geopolitical uncertainty.
Trade idea: BUY 4075.00, SL 4025.00, TP 4225.00
#SP500: BUY 6785, SL 6705, TP 7025
U.S. equities enter the week on strong footing: the S&P 500 holds near 6,790 after softer September inflation data and lower government bond yields. Markets are focused on the Fed’s October 28–29 decision; the prevailing view anticipates another rate cut, which would reduce borrowing costs and support the valuation of future earnings. The reporting season is in full swing, with expectations for double-digit earnings growth for 2025 and a busy week of results from index constituents.
Fundamentally, the index benefits from a combination of easing rate pressure, resilient profit expectations in sectors tied to digital infrastructure and AI-related investment, and a broadly steady consumer backdrop. Key risks include any prolonged disruption to federal services that could distort the macro data flow, and the chance of tighter corporate guidance given currency strength and fluctuations in global electronics demand.
Trade idea: BUY 6785, SL 6705, TP 7025
#BRENT: SELL 66.30, SL 68.00, TP 61.20
Brent trades around $66 per barrel. The weekly news flow is mixed: on one hand, infrastructure risks linger in the Black and Baltic Sea regions; on the other, international agencies flag accelerating supply growth alongside moderate demand. The earlier OPEC+ decision to allow a marginal output increase and revised surplus projections effectively cap prices despite sporadic supply disruptions and sanctions-related headlines.
By late October, industry assessments imply a gradual rebuild in inventories and a softer price path into Q4, albeit with elevated headline-driven volatility. Additional pressure comes from a cooler global backdrop and rising non-OPEC+ production, while any Fed rate cut would only partly lift the commodity complex. Short-position risks include an escalation of geopolitical tensions that threatens exports and an unexpectedly sharp draw in weekly U.S. stock data.
Trade idea: SELL 66.30, SL 68.00, TP 61.20

Qualcomm new AI chips*Qualcomm made new AI chips called AI200 and AI250:
- After this news, Qualcomm’s stock price went up by 12%.
- These chips help Qualcomm join the AI data center market and compete with big companies like Nvidia.
- Qualcomm’s profits are strong, and it is managing costs well.
- The company got its first customer, called HUMAIN, for these AI products.
- Experts think Qualcomm has good future potential, even if some numbers are mixed.
And technically
We are around the middle of a long-term channel
and regarding the mid-term chart,
We have 3 great zones to enter the market,
both for investing and trading

EURCHF Reversal zone and swing-trading potentialEURCHF is holding near strong support around 0.9215–0.9240, forming a repeating cyclical bottom pattern. The CCI indicator shows another oversold signal, confirming potential for an upward reversal.
First upside target: 0.9445, then 0.9620 and 0.9850 if momentum continues. A breakout of the descending trendline on the daily chart would confirm mid-term bullish sentiment.
The Swiss franc remains a safe-haven currency, but with easing inflation and neutral expectations from SNB, euro pressure is softening. Improving Eurozone data adds moderate support to EUR, suggesting possible correction higher.
Long setups can be considered from 0.9240–0.9260 with targets 0.9445 / 0.9620 / 0.9850.
Support 0.9210.
Best suited for swing-trading strategies over several weeks.

Fundamental Market Analysis for October 27, 2025 USDJPYUSD/JPY holds near multi-week highs thanks to the yield differential and a cautious tone among investors before the FOMC meeting. Elevated nominal and real US yields, alongside restrained monetary conditions in Japan, keep a positive differential in favor of the dollar and support buying interest in the pair.
On the domestic side for Japan, the market still expects very low funding costs in the near term and a gradual approach to any future changes by the Bank of Japan. Given modest domestic demand and uneven price dynamics, JGB yields remain contained, leaving the yen with few sustained drivers for appreciation.
External factors also favor the dollar: persistent inflows into US instruments amid global uncertainty underpin the trend. Proximity to areas that may trigger comments from Japanese authorities calls for careful risk management, but fundamentally there are still limited preconditions for a meaningful softening of the USD against the JPY.
Trading recommendation: BUY 152.900, SL 152.250, TP 153.900

Gold XAUUSD Macro map for 27 to 31 Oct 2025Macro map for 27 to 31 Oct 2025
Concentration of policy and inflation prints means policy expectations and real yields will drive the United States dollar, global equities, bitcoin, and gold. The hinge events are Wednesday FOMC, Thursday US GDP advance and German data, Friday US Core PCE and Chicago PMI. Secondary drivers are BoJ policy guidance and ECB tone, plus BoC.
Watch list
Real ten year yield and the DXY dollar index after FOMC and PCE
EUR front end versus USD front end after ECB and FOMC
VIX around the FOMC window and into PCE
US liquidity windows around 14:00 Eastern on Wednesday and 08:30 Eastern on Thursday and Friday
Gold outlook for next week
Set up
Gold trades the sign and size of moves in real yields and the dollar. Policy guidance and inflation prints are therefore the core drivers. A patient or cautious Fed, softer Core PCE, and any rise in macro uncertainty support gold through lower real yields and safe haven demand. A hawkish tilt and firmer PCE pressure it by lifting the opportunity cost of holding a non yielding asset.
Baseline view
The tape prefers a slow glide toward price stability without a growth accident. That backdrop keeps real yields contained or drifting lower and supports gold on dips. The opposite mix lifts real yields and weighs on the metal. Flows often scale in after the first spike around FOMC and PCE once spreads and liquidity stabilize.
Scenarios and probabilities
Upside continuation or breakout. Probability forty. Triggers are a patient FOMC and cooler PCE that push real yields down. A softer dollar would reinforce the move.
Balanced consolidation inside the recent weekly band. Probability thirty. Triggers are mixed signals across events and no major shift in real yields.
Pullback to prior support. Probability thirty. Triggers are firmer PCE or hawkish communication that lifts real yields. Dollar strength would confirm.
Key confirms and risks
Track the ten year real yield and the DXY. If real yields fall while the dollar is flat the setup still favors gold. If both rise, risk control becomes priority. Liquidity can thin quickly in the first minutes after data and during press events. Use predefined risk units and avoid adding into fast markets.

Bitcoin Macro Map for 27 to 31 Oct 2025Macro map for 27 to 31 Oct 2025
Concentration of policy and inflation prints means policy expectations and real yields will drive the United States dollar, global equities, bitcoin, and gold. The hinge events are Wednesday FOMC, Thursday US GDP advance and German data, Friday US Core PCE and Chicago PMI. Secondary drivers are BoJ policy guidance and ECB tone, plus BoC.
Watch list
Real ten year yield and the DXY dollar index after FOMC and PCE
EUR front end versus USD front end after ECB and FOMC
VIX around the FOMC window and into PCE
US liquidity windows around 14:00 Eastern on Wednesday and 08:30 Eastern on Thursday and Friday
Bitcoin outlook for next week
Set up
At the weekly horizon bitcoin is still a beta expression on global liquidity and real yields rather than a pure inflation hedge. It reacts first to dollar and rates shifts that change marginal risk appetite. The FOMC and PCE prints therefore matter for direction even without a direct link to on chain activity. Weekday flow is led by United States hours while Asia sets the early tone on Monday.
Baseline view
If the policy path looks patient and Core PCE continues to glide lower, real yields edge down and the dollar eases. That mix opens the door for crypto beta to catch a bid. A hawkish tilt or a hot PCE does the opposite. Structural ownership by spot products reduces downside jump risk compared with prior cycles, yet high leverage pockets still create sharp intraday tails.
Scenarios and probabilities
Range continuation inside the recent multi month band. Probability fifty. Triggers are offsetting signals across FOMC, GDP, and PCE. Expect false breaks around event minutes with reversion toward the weekly mean.
Upside extension with rotation into high beta crypto. Probability thirty. Triggers are a patient Fed message and benign PCE. Watch for confirmation from a softer dollar and firmer US equities.
Downside flush that tests prior weekly supports. Probability twenty. Triggers are a hawkish statement or hot PCE that pushes real yields higher. Dollar strength and equity weakness would confirm.
Key levels and risk
Use round numbers at five thousand increments as decision points and the prior week high and low as risk guardrails. Funding flips and basis widenings are useful warnings into event hours. Manage exposure size during the two hour FOMC window and the Friday 08:30 Eastern data drop.

SPY and QQQ Macro outlook for 27 to 31 Oct 2025Macro map for 27 to 31 Oct 2025
Concentration of policy and inflation prints means policy expectations and real yields will drive the United States dollar, global equities, bitcoin, and gold. The hinge events are Wednesday FOMC, Thursday US GDP advance and German data, Friday US Core PCE and Chicago PMI. Secondary drivers are BoJ policy guidance and ECB tone, plus BoC.
Watch list
Real ten year yield and the DXY dollar index after FOMC and PCE
EUR front end versus USD front end after ECB and FOMC
VIX around the FOMC window and into PCE
US liquidity windows around 14:00 Eastern on Wednesday and 08:30 Eastern on Thursday and Friday
SPY and QQQ outlook for next week
Set up
US equities enter a policy and growth triad. Wednesday brings the FOMC decision and press conference. Thursday brings the first look at Q3 growth. Friday brings the price index that the Fed emphasizes. The path for real yields and the earnings tone are the first order drivers. Valuation sensitivity is higher in QQQ due to the weight of long duration cash flows. SPY has more cyclicals and defensives and therefore reacts more to growth beats or misses.
Baseline view
A patient Fed message combined with growth that is solid but not hot and inflation that continues to ease supports a grind higher. The market prefers falling real yields with inflation in check. A hawkish shift in the balance of risks, or a hot inflation print that lifts terminal pricing, pressures multiples and skews returns lower. If messages conflict, expect a whipsaw week with heavy rotation.
Scenarios and probabilities
Relief grind higher with QQQ leadership. Probability thirty eight. Triggers are a patient tone on Wednesday, a growth print that shows resilience without overheating, and Core PCE that validates disinflation. Breadth improves and volatility stays contained.
Air pocket lower. Probability thirty two. Triggers are a firmer Core PCE or a hawkish shift in the statement language that pushes real yields up. Valuation compression hits QQQ first and deepest. SPY holds better if staples and energy carry.
Two way chop with wide intraday bars. Probability thirty. Triggers are mixed messages across events and sectors. Expect quick moves around 14:00 Eastern on Wednesday and 08:30 Eastern on Thursday and Friday with mean reversion later in the day.
Key confirms
Watch the ten year real yield and the curve. A drop in real yields with stable breakevens favors a risk appetite day. A jump in real yields with a firm dollar and tight financial conditions favors de‑risking. Also watch VIX and the put call ratio into Wednesday afternoon to gauge dealer positioning.
Risk notes
Large cap earnings that land between FOMC and PCE can add idiosyncratic gaps. Respect prior week high and low as regime markers. If the market opens outside that range and fails to re enter on a retest, trend day odds increase.

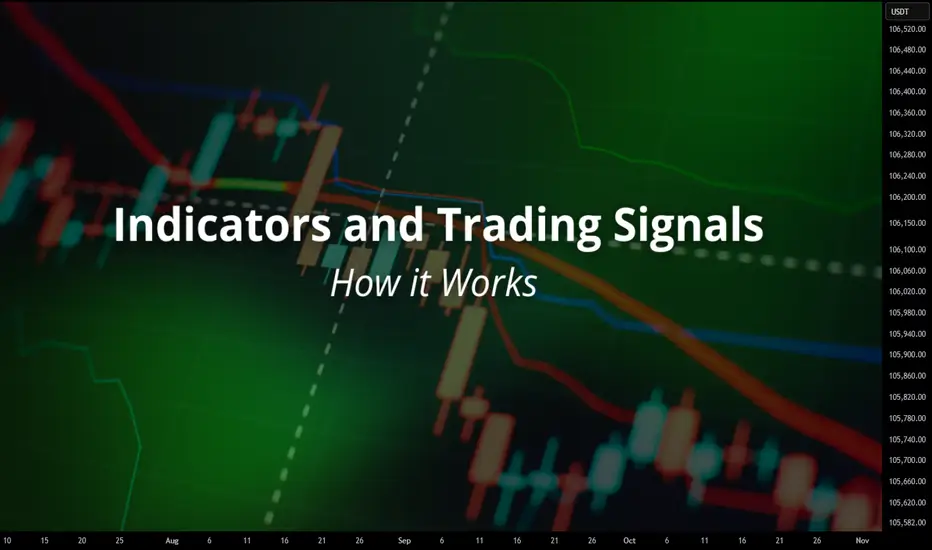
Indicators and Trading Signals — How It WorksWhen you first start trading, indicators feel like the secret sauce.
RSI, MACD, EMA, Volume every line promises to reveal what the market will do next.
You start stacking them like LEGO blocks, thinking more confirmation = more accuracy.
But here’s the hard truth: indicators don’t predict they react.
The real skill isn’t using more of them, it’s knowing when to listen and when to ignore.
The Role of Indicators
Indicators are tools, not magic formulas.
They exist to translate price action into structure. That’s it.
RSI tells you about momentum.
Volume shows commitment.
Moving averages reveal trend direction.
Volatility indicators show risk zones.
The power isn’t in the tool itself, it’s in how consistently you interpret it.
That’s why two traders can look at the same RSI line and do completely opposite things.
The Trap: Signal Hunting
Every trader falls into this phase: jumping from one setup to another, waiting for that “perfect signal.”
The problem?
There isn’t one.
Even the best indicators will fail if your execution and mindset aren’t aligned.
Signals don’t make money! Systems do.
Systems combine momentum, volume, volatility, and trend logic, so signals confirm each other, not contradict.
Signal vs Execution
Let’s be real, getting a signal is the easy part.
Following it correctly is where most traders fall apart.
You get a buy signal… but wait for “one more candle.”
You see a sell alert… but hold, just in case it bounces.
You close early because “it already moved enough.”
That’s why automation matters.
It doesn’t second-guess, it executes.
From Noise to System
If your screen looks like a Christmas tree of indicators, you’re not trading, you’re guessing.
Clean it up.
Pick a few tools that complement each other, build rules around them, and stick to those rules.
That’s how professionals think: less emotion, more structure.
Fundamental Market Analysis for October 24, 2025 GBPUSDSterling is under pressure after softer-than-expected UK inflation. The easing in price pressures has increased the likelihood of Bank of England policy loosening over the coming meetings, narrowing the yield differential in favor of the dollar. While rate expectations are partly in the price, UK releases still point to cooling household demand.
The U.S. inflation print is a potential short-term market driver. Given the high sensitivity to real rates, even a neutral U.S. report can keep the dollar supported. If actual price dynamics exceed consensus, demand for funding and risk assets may be capped, reinforcing pressure on the pound.
The UK policy and economic backdrop remains mixed: budget priorities and household spending face a slowing economy, while the external environment for exports is soft. Altogether this argues for a cautious view on sterling and supports a sell-on-rallies approach in the near term.
Trading recommendation: SELL 1.33250, SL 1.33750, TP 1.32250

USD/CHF - Channel Breakout (24.10.2025) Setup Overview:
USD/CHF has completed a rising channel formation and is now showing signs of a bearish breakout below the lower trendline. The pair rejected the resistance zone near 0.7985 – 0.7970, confirming exhaustion in bullish momentum.
💡 Technical Setup:
Pattern: Rising Channel Breakout
Cloud Cross: Adds bearish confluence
Resistance Zone: 0.7985 – 0.7970
Trendline: Clear breakdown structure visible on 30-min timeframe
📉 Trading Plan:
Bias: Bearish below 0.7960
🟥 1st Support: 0.7925
🟥 2nd Support: 0.7906
Invalidation: A daily close above 0.7985 may negate this setup
📰 Market Context:
1.The U.S. dollar faces minor pullbacks as traders await upcoming inflation data and FOMC signals.
2.Swiss franc gains slight safe-haven demand amid geopolitical and risk market concerns.
3. Technically and fundamentally, short-term sentiment favors a downside correction on USD/CHF.
#USDCHF #Forex #TechnicalAnalysis #PriceAction #ChannelBreakout #BearishSetup #Ichimoku #TradingView #KABHI_TA_TRADING #ChartsDontLieTradersDontQuit #FXMarket #USD #CHF #TrendlineBreak #CloudCross
⚠️ Disclaimer:
This analysis is for educational purposes only — not financial advice. Please do your own research and use strict risk management when trading live markets.
📣 Support My Work
If you like my analysis — LIKE 👍, COMMENT 💬, and FOLLOW 🔔 for more daily Forex setups and updates!

US500 Actionable Long Bullish 5 stack fundamental 6 stacks TechCMCMARKETS:SPX500Z2025
Fundamental: Bullish (5 stacks).
Technical: Bullish (6 stacks, Actionable 6+).
20-word summary: Earnings resilience and easing expectations support bids. EMAs aligned, RSI constructive. Dips bought while above 6675; trend continuation favored highs.
Trade plan (LONG): SL 107.768, TP 280.1968 (ATR method).
All stars align however stay sharp, stay nimble as tariffs loom.

2008 Crisis and How the Banking System Has Changed Since:
⚠️These headlines serve as a reminder that despite the Basel I, II, and III global banking regulations, we have not been spared from systemic risks originating within the financial system itself
🏦After the 2008 crisis, banks became heavily overregulated. As a result, many of their most lucrative investment and financing activities shifted into affiliated offshore hedge funds — entities that remain very much part of the same global financial machinery. They are simply no longer called “banks,” and therefore escape almost all regulation.
💵These hedge funds lend, repackage loans, buy and sell exotic financial instruments, re-hypothecate, and re-collateralize. They use questionable collateral to issue risky loans , which are then resold, repackaged, and used again as collateral again.
💰 Exotic derivatives, curreny swaps, REPO operations, outright fraud,risky options market-making, — you name it — all thrive offshore , far from regulatory oversight yet just a click away for clients. And make no mistake: these so-called “non-banks” are deeply interconnected with the global financial system. If they fail, the shockwaves will be felt everywhere.
📈 The next financial tsunami will begin offshore — but it’s the onshore world that will be hit the hardest . So don’t keep large sums of money in the bank, guys. Once your funds are in the bank, they’re no longer truly yours — they belong to the bank. Your account can be frozen, blocked, seized, taxed, or even converted into shares (as happened in Spain in 2011).
⚠️And remember: banks can fail. They will fail. And when they do — the government won’t save you.
Yours truly,
Greg🌹

GBPUSD Short Confluence and stacking the oddsFPMARKETS:GBPUSD
Fundamental: Bearish (5/5).
Technical: Bearish (7/7) — Diamond Vault (7-Stack) candidate; SL=0.0121, TP distance=0.0314.
Weak UK inflation and growth; dollar steadies. Trend structure bearish across EMAs; momentum favors sellers while rebounds face supply overhead.

GBP/USD - Fundamental Drive Ahead! (21.10.2025)🧠 Setup Overview:
GBP/USD has broken below its rising trendline after testing the 1.3470 resistance zone multiple times. The pair is under fundamental selling pressure, fueled by risk aversion and renewed U.S. dollar strength.
Fundamental Drivers:
1️⃣ U.S. markets gained as President Trump decided not to impose very high tariffs on Chinese goods, which temporarily boosted sentiment.
2️⃣ However, investors are now digesting U.S. credit risks and US–China trade tensions, both adding safe-haven demand to the USD.
3️⃣ Meanwhile, the UK economy faces uncertainty from softer consumer spending and weak housing data — further limiting GBP’s upside potential.
📉 Technical Plan:
Bias: Bearish below 1.3400
Structure: Trendline breakdown confirmed
Cloud Resistance: Adds confluence to downside momentum
Next Levels to Watch:
🟥 1st Support: 1.3349
🟥 2nd Support: 1.3310
📊 If price closes below 1.3349 on the 30-min chart, further selling pressure may extend toward 1.3310 and possibly deeper if fundamentals align.
#GBPUSD #Forex #TechnicalAnalysis #PriceAction #Ichimoku #TrendlineBreak #FXMarket #BearishSetup #TradingView #KABHI_TA_TRADING
⚠️ Disclaimer:
This analysis is for educational purposes only — not financial advice. Always manage your risk and use proper position sizing before entering any trade.
📣 Support My Work
If you found this analysis useful — LIKE 👍, COMMENT 💬, and FOLLOW 🔔 to stay updated with daily Forex setups!

GBP/NZD - Wedge Breakdown (20.10.2025)📊 Setup Overview:
GBP/NZD has formed a Rising Wedge Pattern on the 30-min chart, signaling a potential trend reversal from the recent bullish structure. The pair has also completed a Cloud Cross, indicating early bearish momentum as price begins to break below the wedge support line. OANDA:GBPNZD
📈 Trade Plan: Bias: Bearish
Sell Entry Zone: Below 2.3400 (after candle close confirmation)
1st Target: 2.3288 ✅
2nd Target: 2.3277 🎯
Resistance Zone: 2.3479 – 2.3523
🧩 Technical Highlights:
1.Rising Wedge pattern breakdown – early bearish signal
2.Ichimoku Cloud Cross confirms downside pressure
3.Volume profile thinning below 2.34, showing potential liquidity vacuum
4.Clean bearish structure with clear risk–reward setup
#GBPNZD #ForexAnalysis #WedgePattern #BearishBreakout #Ichimoku #PriceAction #TechnicalAnalysis #ChartSetup #SwingTrade #TradingView #FXMarket #Kabhi_TA_Trading #ChartsDontLie #TradersDontQuit #ForexSignals
⚠️ Disclaimer:
This analysis is for educational purposes only and not financial advice.
Always confirm setups with your own analysis and manage risk properly before entering any trade.
💬 Support This Analysis:
If this setup helped your trading view — LIKE 👍, COMMENT 💬 your thoughts, and FOLLOW ✅ for more daily forex setups and chart breakdowns from Kabhi_TA_Trading!

USDJPY Long #confluence country #trade the stacks. OANDA:USDJPY
Fundamental: Bullish (5)
Technical: Bullish (6/7) — actionable threshold met (≥6)
20-word summary: Dollar-yen supported by rate differentials; EMAs aligned; momentum constructive; watch 152 zone and intervention risk while trend persists this week.
Actionable Trade (Long): ATR 1.181 → SL distance 1.79512; Stop 150.08088; TP 156.54331 (2.6R).

TSLA: Fundamentals Are Collapsing While Valuation Stays in OrbitTesla is trading near multi-month highs… but the fundamentals tell a very different story.
EPS has dropped by 50%, revenue growth has almost stalled, and yet the stock still carries a Forward P/E of 164.
This combination — slowing growth and extreme valuation — looks like the definition of an institutional bubble setup.
🧮 Fundamental Context
Over the past few years, Tesla’s growth has slowed dramatically:
Revenue rose from 31B → 53B → 81B → 96B → 97B — barely any increase.
EPS climbed from 0.2 → 1.6 → 3.6 → 4.3 — and then fell by half.
Quarter-over-quarter metrics remain negative, with no visible recovery trend.
Meanwhile, the Forward P/E of 164 implies double-digit expansion ahead — which clearly isn’t happening.
The fundamentals simply do not justify this kind of valuation.
Right now, Tesla’s numbers resemble the early phase of a valuation compression cycle — where prices eventually catch up with reality.
📉 Technical Structure
Technically, Tesla has been moving in a broad sideways range, forming what looks like a long-term Wave 4 structure.
We’re currently inside the “B” leg, which could already be complete or near completion.
Once that wave ends, the next expected move is a Wave C decline.
Key levels to watch:
📍 Upper resistance zone: $400 – $550
📍 Primary cluster: around $250
📍 Support zone: $150 – $200
The chart shows clear volume concentration around $250 — once that level breaks, the next liquidity pocket sits between $150 and $200.
That’s where a potential bottoming cluster could form before the final upward leg.
⚠️ Market Outlook
While other FANG names maintain solid balance sheets and stable earnings, Tesla’s fundamentals are deteriorating sharply.
Yes, the stock may still see short-term pumps driven by sentiment or Musk’s fan base — but markets always return to fundamentals.
And those fundamentals are pointing downward.
📊 Summary
EPS and revenue both trending lower 📉
Forward P/E at 164 — completely disconnected from growth metrics
Technical range suggests potential decline toward $200–$150
Current price action likely part of a larger corrective structure
Long-term investors should exercise extreme caution ⚠️
Tesla isn’t a short-term “growth story” anymore — it’s a valuation risk story.
Until earnings stabilize and margins recover, this stock looks massively overpriced.

Silver rally: Are you in?Silver (XAGUSD) just hit a new all-time high, soaring above $53/oz! The surge is driven by a real physical shortage in London (record-low LBMA stocks, spike in lease rates, and COMEX premium), flight to safety amid dovish Fed expectations and gold’s rally, and booming industrial demand from solar energy and electronics. A short squeeze is also underway due to the rising cost of borrowing silver.
5 key drivers behind the XAGUSD bull run:
1. The market is short on metal – demand consistently outpaces supply.
2. Physical squeeze in London – inventories are depleted, spot trades above COMEX, borrowing costs surge.
3 . Industrial super-demand – energy transition fuels silver use in solar, electronics, and EVs.
4. Dovish macro backdrop – Fed rate cuts expected, weaker USD, inflows into safe havens.
5. Capital inflows – silver ETFs and bullion/coin demand picking up momentum.
FreshForex analysts see further upside: the breakout to new highs confirms strong demand for physical silver and sustained investor interest. The rally in gold and robust industrial trends give the silver market breadth and staying power. Q4 2025 offers great potential for active traders, but the strongest move is expected in Q1 2026 , as Fed policy loosens and supply remains tight

Bullish Bias Toward $4,400+🌍 Fundamental Overview
Gold is trading around $4,135–$4,155/oz, staying firm despite mild USD recovery.
Friday’s U.S. data (Michigan Consumer Sentiment, inflation expectations) came slightly higher, but Fed cut expectations remain unchanged — markets still price 99% chance of a rate cut in October.
Geopolitical backdrop remains tense — Middle East concerns, ongoing U.S.–China trade friction, and soft global growth outlook keep gold demand resilient.
ETF inflows show renewed interest; central banks (China, Turkey, India) continue accumulating.
Short-term: Profit-taking possible early this week; medium-term trend remains bullish toward $4,300+.
📊 Technical Overview
Current Price Range: $4,135 – $4,155
Support Zones:
$4,120 (minor intraday support)
$4,080 (major short-term floor)
$4,050 (psychological & structural support)
Resistance Levels:
$4,180
$4,200 (key breakout zone)
$4,300 (next major upside target)
Trend: Bullish consolidation — healthy sideways price action above $4,100 zone.
RSI (H4): Resetting from overbought, suggesting space for renewed upside momentum.
🎯 Trading Strategy
1️⃣ Buy Dip Setup
Entry: $4,090–$4,120
SL: below $4,050
TP: $4,180 → $4,220
2️⃣ Breakout Buy
Entry: above $4,180 (confirmed 1H close)
SL: below $4,150
TP: $4,250 → $4,300
3️⃣ Short Scalp (Counter-trend)
Entry: $4,180–$4,200 (if rejection appears)
SL: above $4,220
TP: $4,120 → $4,080
📌 Bias: Bullish above $4,080 — watch for early-week volatility and liquidity traps.
