Strong Stock!FFL
Closed at 15.22 (27-06-2025)
Sustaining 13.81 on Monthly basis
would be a healthy sign.
Also Monthly Closing above 16.12
would be a very positive sign.
On the flip side, 12 - 14 may act
as a Good Support zone.
Upside targets can be 19 - 20
& then 22 - 23 initially.
Fundamentalstrategy

Is Rivian Setting Up For a Breakout?Hi Traders!
On Nov. 5th, Rivian created a daily bullish CHOCH pushing price to resistance at $18. The following weeks showed price returning back to retest that daily CHOCH. Since then, it looks to me that Rivian is working to complete a cup and handle pattern (Lower TFs).
IMO the daily and weekly look bullish, and Rivian could be setting up to break past resistance at $18. Therefore, my plan is to long swing Rivian to a potential target at $20. My ideal entry would be around/in between $16-$16.50, but when looking at a lower TF $17 area could be respected. Watching closely, and alerts are set!
*DISCLAIMER: I am not a financial advisor. The ideas and trades I take on my page are for educational and entertainment purposes only. I'm just showing you guys how I trade. Remember, trading of any kind involves risk. Your investments are solely your responsibility and not mine.*

HOW TO TRADE FUNDAMENTALS: A simple 3 point plan When I first started trading, I went heavily down the technical indicator route (as I imagine most people do). RSI, SLOW STOCHASTIC, BOLLINGER BANDS, MACD, FIBONACCI. ICHIMOKU CLOUD. Devising strategies, testing, back testing, and for periods of time they all worked. But, over a long period of time my account was stuck in a rut, ultimately breaking even at best. A big part of my lack of consistency was down to my own psychology, but it was only when I came to the realisation that indicators alone don't move an instrument. In fact, most indicators are backward looking. I stripped my charts of indicators, only keeping BILL WILLIAMS FRACTALS and started my quest to understand the underlying fundamentals behind market moves.
My results and consistency improved almost instantly. I'm sure there are many successful ‘technical only’ traders. But I just feel an awful lot more confident and relaxed placing trades with an understanding of the fundamentals behind my idea. And the beauty of it is, fundamental trading doesn't have to be complicated, in fact, the simpler you can make it the better.
Here is my interpretation of the basic knowledge required to trade Forex using fundamentals:
A quick look at a currency's reaction to RED FLAG data (particularly USD data), leaves you with no doubt how important economic fundamentals are to a currency's movement. CPI / EMPLOYMENT / RETAIL SALES and GDP all play a part in the economic wellbeing of a country. The simple correlation being: positive data = positive currency.
The other RED FLAG event (and perhaps most important) is interest rate decisions. The simple correlation being: higher interest rate = strong currency. And the market focuses on, not just the actual current interest rate but also, the perceived direction of interest rates over the coming months.
Finally, arguably the biggest driver of a currency's movement, is the ‘overall market risk environment’. In simple terms: if the mood is positive, it's classed as ‘risk on’. If the mood is negative, it's classed as ‘risk off’. A multitude of catalysts can alter the market's mood. Geopolitical events, company earnings, political statements, the list is endless. And the currencies react in accordance to correlations with other instruments, such as the S&P 500 and the US bond market.
(Note the recent correlation between DXY and USD JPY above)
In simple terms:
Risk on = strong AUD, NZD, GBP, CAD
Risk off = strong JPY, CHF, USD, EUR
There are nuances, such as the USD and EUR often also strengthen in a ‘risk on environment’. But the above is a good rule of thumb to start with.
By doing a little bit of reading every day, you quickly pick up on whichever ‘event’ the market is currently focused on and form an underlying bias for each currency.
And you can implement a very straightforward 3 point plan:
1: Gather knowledge to form an underlying opinion.
2: Identify a catalyst that lines up with your opinion.
3: Use support and resistance points according to BILL WILLIAMS FRACTALS to identify enter and exit points.
You'll soon find you can identify ‘high confidence set ups’ and by using a higher risk reward ratio per trade, a gradually rising profit curve becomes a reality.

GOLD ANALYSIS What’s Moving the Market Today?(December 05, 2025)OANDA:XAUUSD GOLD ANALYSIS What’s Moving the Market Today?(December 05, 2025)
Welcome back to Trade with DECRYPTERS, where we decode smart-money footprints into clean, actionable buy & sell zones.
Keep it simple. Trust the levels. Follow the plan.
📰 Market Overview
Gold continues its upward rotation after reacting perfectly from Smart Money Buy Orders earlier this week. Price is now pushing toward major liquidity pockets and approaching premium sell zones, keeping bulls firmly in command despite mild USD stabilization.
The U.S. Dollar Index remains soft following post-election volatility, hovering near structural lows. Combined with elevated geopolitical tensions and aggressive central-bank accumulation, gold continues to operate inside a macro-bullish environment.
With key U.S. data releases (ADP, ISM Services, PCE) and the December 9–10 FOMC meeting ahead, markets remain cautious but structurally bullish. Gold is respecting the premium discount rotation cleanly, offering multiple low-risk, high-probability setups for disciplined traders.
🔍 Key Fundamentals Driving Today’s Move
📈 88% probability of a December rate cut → lower yield competition boosts gold
💵 USD stabilizing but not strengthening → downside limited
🌍 Geopolitical tensions elevated → strong safe-haven premium
🏦 Central banks remain net buyers (634t YTD) → consistent long-term accumulation
📊 Core PCE at 2.9% → keeps Fed leaning dovish
Gold’s strength remains driven by a powerful combination of macro uncertainty + structural demand + smart-money order flow.
📰 Insights from Key Sources
Spot gold rose 1% to $4,199.19/oz on Nov 28, signaling renewed buying interest and aggressive dip-accumulation.
Bank of America projects gold could reach $5,000/oz by 2026, backed by tight supply, low inventories, and persistent monetary support.
Deutsche Bank raised its 2026 average gold forecast to $4,450/oz (up from $4,000), citing ETF inflows and sustained central-bank demand.
Australian miners are ramping up exploration to capitalize on the rally.
South Africa has opened its first underground gold mine in 15 years (Qala Shallows), aiming to stockpile ore amid record prices.
Structural supply constraints remain a bullish driver, supporting higher long-term price projections.
These insights reinforce the institutional bias: long-term accumulation remains strong, and the upside narrative is supported by both fundamentals and supply-demand dynamics.
📆 KEY EVENTS TO WATCH
🔸 Core PCE Data — Recently Released
A major Federal Reserve–driven volatility catalyst.
Latest Core PCE: 2.9% YoY
Latest Monthly Change: 0.2% MoM
If Core PCE comes in softer than expectations:
✔️ Strengthens the December rate-cut narrative
✔️ Supports a continuation toward premium sell zones (4245 → 4264 → 4284)
✔️ Confirms easing inflation pressure and boosts non-yielding assets like gold
If Core PCE comes in hotter than forecast:
✔️ Sparks temporary USD strength
✔️ Expect a liquidity sweep into discount zones (4203 → 4189 → 4167)
✔️ Real direction usually follows after the stop-hunt, not the initial candle
🔸 Geopolitical Landscape
Geopolitical tensions continue to amplify intraday volatility:
🌍 Escalation → safe-haven spike into premium zones
🌤️ Calm → controlled pullbacks into buy zones
Trend remains bullish, but momentum varies depending on global risk sentiment.
Geopolitics generally strengthens the prevailing smart-money trend rather than reversing it.
🟩 GOLD TECHNICAL LEVELS
Gold continues to respect its rising structure, reacting cleanly from discount zones and rotating toward institutional premium blocks. Price currently sits just below major sell-side liquidity.
🟩 📌 SMART MONEY BUY ORDERS: 4147 – 4167
Primary institutional demand zone with ~$22 million in resting buy-side liquidity.
Expect:
✔️ Strong reaction on first tap
✔️ Accumulation & mitigation
✔️ Higher-low formations inside bullish channel
Break below 4147 opens liquidity toward 4108 → 4075.
🟩 📌 SCALP BUY AREA: 4203 – 4189
Short-term discount zone for:
✔️ Intraday long scalps
✔️ Retracement continuation setups
✔️ Mid-range liquidity grabs
A break of 4189 brings price back into the deeper Smart Money Buy Zone.
🟧 📌 SCALP SELL AREA: 4245 – 4254
Short-term distribution zone ideal for:
✔️ Quick reaction shorts
✔️ Intraday pullbacks
✔️ Stop runs before testing the major premium zone
Rejection sends price back toward 4200–4210 liquidity.
🔺 📌 SMART MONEY SELL AREA: 4264 – 4284
High-probability institutional distribution zone with $33 million in sell-side orders.
Expect:
✔️ Manipulation wicks into premium
✔️ Liquidity grabs above local highs
✔️ Swing reversal setups near range extreme
A decisive break & hold above 4284 opens continuation toward 4310 → 4325.
📌 Conclusion
gold remains firmly bullish as long as the 4147–4167 Smart Money Buy Zone is protected, with price continuing its clean rotation between institutional discount and premium levels. With unemployment data set to inject volatility, expect engineered liquidity sweeps before the true direction unfolds. The broader narrative of dovish policy, geopolitical risk, and heavy central-bank accumulation keeps the upside intact. Stay patient, trust the zones, and let smart-money footprints guide every decision.
🙌 Support the Analysis
If this breakdown brought value to your trading:
👍 Drop a like
💬 Comment your levels
📈 Share your charts with the community
Let’s grow together.
Best Regards,
M. MOIZ KHATTAK | Founder — TRADE WITH DECRYPTERS

TSLA 1D: bounced at 380, now 412 decides if 530 is on the tableTesla pulled back precisely into the 380 area, lining up with the 0.5 Fibonacci retracement and the daily trendline, and bounced, confirming 360–380 as a key buy zone. This region combines the prior breakout range, trendline support and fresh accumulation. The next critical step for bulls is a clean breakout and hold above 412 dollars - the main resistance of the recent corrective leg and the local cap for the last swing. A sustained move above 412 unlocks room toward 450 and then the major upside target near 530 within the broader ascending channel.
Company: Tesla is the global leader in EVs, battery systems and energy solutions, combining manufacturing, software, autonomous driving and large-scale storage infrastructure.
Fundamentally , as of November 16, Tesla is in a transition phase: auto margins are lower than during the previous peak cycle due to price cuts and stronger competition, yet volume growth, scaling of the energy segment and improved factory efficiency help to stabilize profitability. Cash flow remains strong, the balance sheet is solid, energy and services are taking a larger share of total revenue, and long-term expectations are anchored by FSD progress and the robotaxi roadmap. For the market, Tesla is still the flagship brand of the EV sector, and any signs of margin stabilization tend to bring institutional money back quickly.
Tactically , as long as price holds above 380 and doesn’t break below 360, the retest-before-continuation scenario remains the base case. A confirmed breakout above 412 becomes the technical trigger toward 450 and then the 530 target along the upper channel. A loss of 360 would shift the picture into a deeper correction, but the current structure still looks more like a pause within an uptrend than a top.
Tesla loves to scare everyone with sharp red candles, then casually act like it was just warming up for the next leg.

BTC 1W Chart !🔥 1. GENERAL TREND (1W)
The long-term trend is still upwards because:
• the price stays in the orange channel,
• the black trend line (key) has not been broken.
But at the same time:
➡️ We see correction after local ATH around 115-120k.
This is a typical cyclical decline after breaking out from the extremes.
⸻
🔥 2. KEY LEVELS OF YOUR CHART
Closest support (S)
1. 94 315 → current retest
2. 85,895 → key trend support
3. 74,896 → the most important defensive level against mega relegation
Nearest resistances (R)
1. 105,901 – the first serious resistance
2. 114 437 – strong ceiling
3. 125,907 – potential target for a new growth impulse
⸻
🔥 3. STOCHASTIC SITUATION (1W)
Stoch is deeply oversold → a signal of a potential rebound.
On a weekly basis, such signals usually mean:
• local minimum,
• beginning of a new growth wave in the 4-8 week window.
⸻
🔥 4. MARKET STRUCTURE (PRICE ACTION)
The current candles suggest:
• a strong defense attempt on 94k,
• getting closer to the black trend line,
• there is still room to move higher in the orange channel.
This looks like:
➡️ a correction in the upward trend, not a change in the trend.
⸻
🔥 5. SCENARIO FOR THE NEXT WEEKS
🟢 Growth scenario (more likely)
Condition: maintaining 94k or black trendline
Targets:
• 105,900 – first target
• 114,400 – medium target
• 125 900 – full swing to the upper edge of the channel
Probability: 60-70%
(because Stoch is sold out + entry to support the channel)
⸻
🔴 Downside scenario (less realistic)
Condition: weekly close below the black trendline
Only then do we fly:
1. 85,900
2. 74,900 – an absolute must-hold
A break of 74,900 would mean:
➡️ end of the growth channel
➡️ entering a long-term bear market
Probability: 30-40%
⸻
🔥 6. Summary in points
Current situation
• BTC is sitting right on support.
• Weekly Stochastic = buy signal.
• Growth channel still intact.
• The market looks like it's getting ready to rebound.
If 94k stays → we go to 105k+, then 114k.
If he hits the black line → 85k and 74k in the game.

BNB reacts to BTC declines🔍 General Technical Situation:
The BNB price has broken below a key uptrend line that has been in place since June.
It is currently below the support level of ~1010 USDT, signaling a shift from higher lows to a potential downtrend.
📉 Key Levels:
Resistance:
1086 USDT → last local resistance after the trend breakout (a retest from below is possible).
1205 USDT → strong resistance from August and September.
Support:
912 USDT → local support (currently being tested).
831 USDT → next support, significant from the August structure.
733 USDT → strong demand zone from June-July.
📊 Volume:
In recent days, it has increased noticeably during declines—confirming selling pressure and the presence of large players liquidating positions.
🔄 Stoch RSI Indicator:
The Stoch RSI is at the lower end of the chart, close to the oversold zone (around 20–0).
This could indicate a short-term rebound, but not necessarily the end of the decline—rather, a potential retest from below the broken trend line (~1050–1080 USDT).
⚠️ Scenarios:
🟥 Bearish (more likely):
Price remains below 1010 USDT and rejects the 1080–1100 level in the event of a rebound.
Next downside targets: 912 → 831 → 733 USDT.
High selling volume suggests a test of lower levels may occur before demand stabilizes.
🟩 Bullish (less likely, but possible):
Price bounces from the 900–910 zone and returns above 1010 USDT with confirmed volume.
Only a close of the daily candle above 1080 USDT would negate the current bearish signal and could open the way to 1200 USDT.
📈 Summary:
Medium-term trend: broken, signal of weakness.
Short-term: possible technical rebound from 900–910, but the overall bias remains bearish.
Key level to watch: 1010 USDT – a return above this level would be the first positive signal.

ETH/USDT 1W Chart📊 Market Structure:
Main Trend: Still up (higher lows and highs pattern persists).
Current Phase: Correction in an uptrend.
Local Trend: Down for several weeks (series of red weekly candles).
⚙️ Key Support and Resistance Levels:
Resistance (green lines):
4,753 USDT – recent local high, very strong resistance.
4,373 USDT – previous consolidation level, currently a supply zone.
3,979 USDT – current key local resistance, which previously served as support.
Support (red lines):
3,600 USDT – currently tested support level (coincides with the uptrend line).
3,165 USDT – next strong support level (previous local lows).
2,740 USDT – strong long-term support, potential target for further correction.
📈 Trendline:
The black uptrend line connects successive higher lows since April 2024.
The current weekly candlestick is testing this line (confluence with support at 3,600 USDT).
Maintaining this line = still a bullish medium-term scenario.
A breakout and weekly close below ~3,580–3,600 USDT → a signal of a possible trend reversal.
📉 Volume:
Downward volume is increasing, indicating supply pressure.
A lack of strong demand candlesticks = buyers are cautious in this zone.
🔄 Stoch RSI Oscillator (bottom of the chart):
Located in the oversold zone (below 20).
The %K (blue) and %D (orange) lines are starting to converge → a possible rebound signal in the coming weeks if a crossover occurs upwards.
🧭 Scenarios:
🟢 Bullish
Holding support at 3,600 USDT + trendline.
Confirmation with a bullish candle with higher volume.
Target: Return to 3,980 → 4,370 USDT.
🔴 Bearish:
Closing the week below 3,580 USDT (trendline + support).
Potential decline to 3,165 USDT, and even 2,740 USDT beyond.
RSI and volume suggest that downward pressure remains significant.
📌 Summary:
Key level: 3,600 USDT → decisive point for the market's further direction.
Short-term: Still downward pressure, but a technical rebound is possible (Stoch RSI).
Medium-term: The uptrend has not reversed until ETH closes below the trend line and 3,550 USDT.

TSLL accumulation before impulse, growth targets at 31 and 50TSLL continues to move within an ascending channel, forming a price accumulation zone between 17 and 21. After a confirmed breakout above 21, the price is expected to rise towards Target 1: 31.03 and
Target 2 : 49.78.
The 50 and 100 EMA are sloping upward, confirming a strong bullish structure. A short-term correction toward 17.17 remains possible this area acts as key buyer interest and previous support.
TSLL performance is tied to Tesla’s stock. Recent quarterly results from Tesla show margin recovery and revenue growth driven by new model sales. Lower interest rate expectations and renewed appetite for U.S. equities support inflows into leveraged ETFs like TSLL.
TSLL remains in a bullish structure. As long as the price stays above 17, buying remains preferable. Medium-term targets 31 and 50. Pullbacks toward 17 can be used to add to long positions.

Ethereum confirmation of breakout, downside targetEthereum confirmed a breakout below the 4050–4100 zone, completing the double top pattern. The price stays under the 50 and 100 EMA, showing continued bearish pressure. Priority remains on short positions during pullbacks.
Nearest downside targets: 3463 (Target 1) and 3007 (Target 2). A move above 4100 would cancel the bearish scenario.
Amid expectations of the Fed’s rate decision and rising bond yields, risk assets remain under pressure. Inflows to crypto funds are declining, increasing the downside risks for ETH. In the short term, correction may continue until new bullish catalysts appear.
ETHUSD remains in a bearish setup. Downside targets — 3460 and 3000. Long positions should be considered only after a confirmed move above 4100.

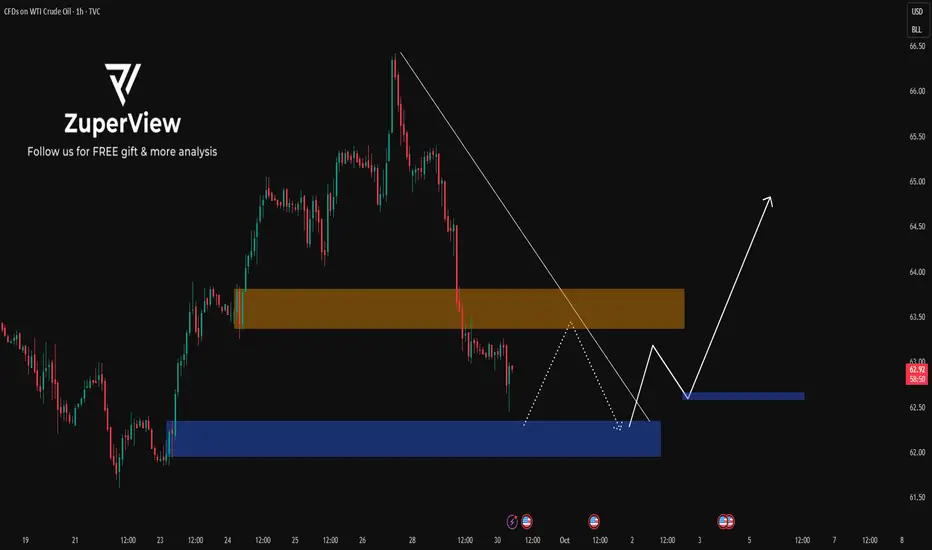
USOIL: Buy setups during higher-timeframe correctionOIL PRICE WEEKLY OUTLOOK
(Week of Oct 20-24, 2025)
Key Drivers & Risks
Updates in Supply, Demand, and Geopolitical News
EIA (week ending Oct 10): Crude inventories +3.5 million bbl; distillates −4.5 million bbl.
IEA OMR (Oct 2025): Upgraded global supply forecast: +3.0 mb/d in 2025 and +2.4 mb/d in 2026, while demand grows only ~0.7 mb/d per year ⇒ signaling a large surplus risk and downward pressure on prices.
OPEC (Oct 2025): Maintains demand growth outlook of +1.3 mb/d for 2025, but acknowledges a smaller deficit in 2026 as OPEC+ output rises; September production increased by ~630 kb/d.
Maritime risk in the Red Sea / Gulf of Aden: Over the weekend, a gas carrier reportedly caught fire following a possible attack off Yemen’s coast, leading to higher shipping risk premiums, though no major disruption to trade flows has been reported yet.
Watchlist for the Week Ahead
EIA Weekly Report (Oct 22): Focus on crude and distillate inventories, and any signs of policy or flow adjustments.
Maritime security updates in the Red Sea / Gulf of Aden / Strait of Hormuz — monitor frequency and severity of incidents.
China data: imports, refinery runs, and inventories — potential signals of stockpiling at lower price levels.
Any notable demand-side surprises (if any emerge).
Overall View
Oil prices are expected to gradually decline within a relatively narrow range of $70–$50 through mid-2026.
Short-term rebounds may occur due to low price levels and heightened transport risk headlines.
China’s potential restocking activity could provide limited demand-side support.
* Trend: assessed using at least three trend indicators, with market structure as the primary guide.
** Weak or Reversal Signals: Assessed based on one of our criteria for trend reversal signals.
*** Support/Resistance: Selected from multiple factors – static (Swing High, Swing Low, etc.), dynamic (EMA, MA, etc.), psychological (Fibonacci, RSI, etc.) – and determined based on the trader’s discretion.
**** Our advice takes into account all factors, including both fundamental and technical analysis. It is not intended as a profit target. We hope it can serve as a reference to help you trade more effectively. This advice is for informational purposes only and we assume no responsibility for any trading results based on it.
George Vann @ ZuperView
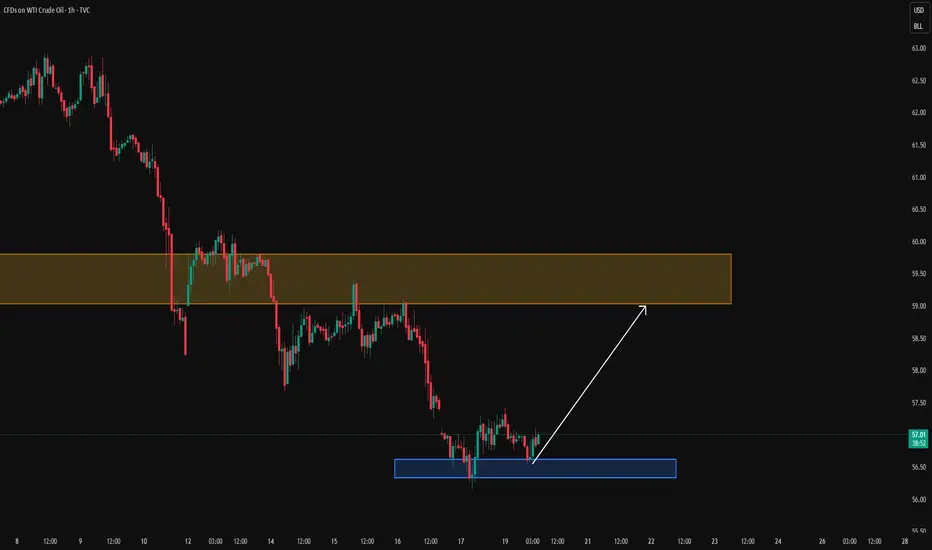
USOIL: Price breaks out of sideways – sell on pullbackTo better understand my current outlook on USOIL, please refer to my previous higher-timeframe and fundamental analyses.
This could be a position trade in anticipation of a larger downtrend on the daily timeframe, but there's risk involved due to the upcoming Non-Farm Payrolls (NFP) report this Friday.
* Trend: assessed using at least three trend indicators, with market structure as the primary guide.
** Weak or Reversal Signals: Assessed based on one of our criteria for trend reversal signals.
*** Support/Resistance: Selected from multiple factors – static (Swing High, Swing Low, etc.), dynamic (EMA, MA, etc.), psychological (Fibonacci, RSI, etc.) – and determined based on the trader’s discretion.
**** Our advice takes into account all factors, including both fundamental and technical analysis. It is not intended as a profit target. We hope it can serve as a reference to help you trade more effectively. This advice is for informational purposes only and we assume no responsibility for any trading results based on it.
Please like and comment below to support our traders. Your reactions will motivate us to do more analysis in the future 🙏✨
George Vann @ ZuperView
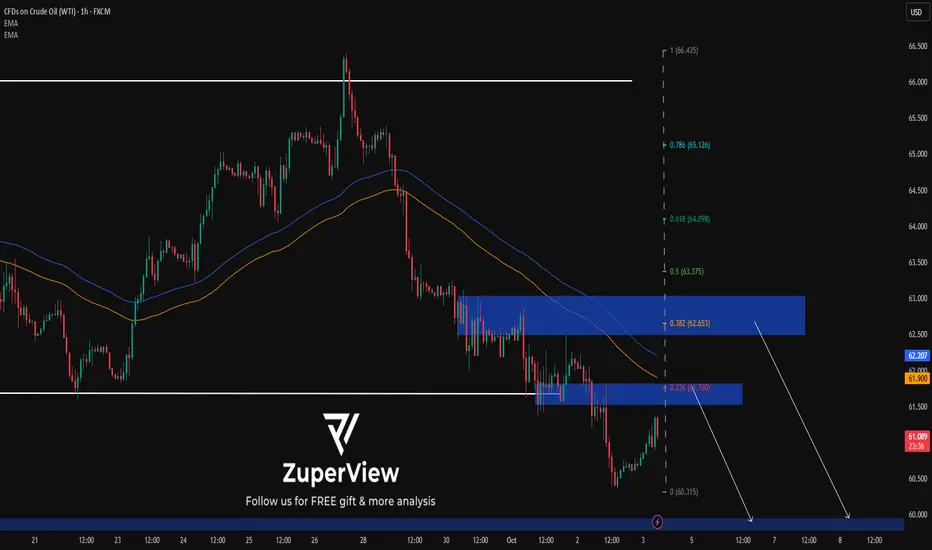
USOIL: Waiting for breakout after sidewaysTo better understand my current outlook on USOIL, please refer to my previous higher-timeframe and fundamental analyses.
* Trend: assessed using at least three trend indicators, with market structure as the primary guide.
** Weak or Reversal Signals: Assessed based on one of our criteria for trend reversal signals.
*** Support/Resistance: Selected from multiple factors – static (Swing High, Swing Low, etc.), dynamic (EMA, MA, etc.), psychological (Fibonacci, RSI, etc.) – and determined based on the trader’s discretion.
**** Our advice takes into account all factors, including both fundamental and technical analysis. It is not intended as a profit target. We hope it can serve as a reference to help you trade more effectively. This advice is for informational purposes only and we assume no responsibility for any trading results based on it.
Please like and comment below to support our traders. Your reactions will motivate us to do more analysis in the future 🙏✨
EURCAD: wedge at the top with bearish divergenceThe EUR/CAD pair has been trading within an ascending channel, but the 4H chart shows a rising wedge pattern, typically a reversal setup. Attempts to sustain above 1.64 have failed so far, while the CCI indicator shows a series of bearish divergences, highlighting weakening bullish momentum.
Technically, the likelihood of a decline after the wedge breakout is high. Initial targets lie at 1.6260, followed by 1.6080, and deeper at 1.5780. A retest of the broken level (re-entry) is possible before the downward move accelerates.
From a fundamental perspective, the euro remains pressured by weak macro data and a cautious ECB, while the Canadian dollar is supported by stable oil prices and a firm Bank of Canada stance. This divergence in fundamentals strengthens the bearish case.
It’s a classic situation where the market tempts traders into expecting a reversal, but confirmation is still required. As always, emotions aside — we wait for clear signals before acting.

Bullish Breakout Trade Setup on XAU/USD – Targeting 3,707 After Chart Components and Analysis
1. Descending Channel
The price was previously moving within a clearly defined downtrend channel (marked in red with blue borders).
The lower and upper bounds are acting as dynamic support and resistance levels.
2. Breakout Zone
The price appears to have broken out of the descending channel to the upside, or is attempting to break out.
The breakout suggests a potential reversal or bullish momentum.
📈 Trade Setup Details
Element Level Description
Entry Point 3,654.27 Suggested level to enter a long position
Stop Loss 3,643.58 Risk management level below recent support
Target Point 3,707.38 Take profit target at the next resistance zone
Current Price 3,662.37 Price at the time of chart capture
📊 Risk-to-Reward Ratio (RRR)
Entry: 3,654.27
Stop Loss: 3,643.58 → ~10.69 points risk
Target: 3,707.38 → ~53.11 points reward
➡️ Risk-to-Reward Ratio ≈ 1:5, which is excellent. It suggests a well-planned trade with high reward potential relative to the risk.
📉 Price Action Forecast
The black zigzag line suggests expected short-term price retracement before moving up.
This could be a bullish flag pattern or a retest of the breakout zone before continuation upward.
✅ Bullish Indicators
Channel breakout.
High RRR.
Structured trade setup with clearly defined stop loss and target.
⚠️ Risks & Considerations
False breakout: Wait for confirmation (candle close outside the channel).
Market volatility: Economic news could affect Gold prices.
Retest failure: If price fails to hold above entry zone, trade invalidates.
🧠 Conclusion
This is a bullish breakout trade with a strong risk-to-reward profile. The trade logic hinges on the assumption that Gold has ended its correction (downtrend channel) and is now beginning a new upward leg. If the price successfully holds above the breakout level and continues upward, the target around 3,707 is realistic.

EUR/USD breakout buy alert EUR/USD Buy Opportunity
Current Price: 1.17500
📈 Buy Entry Active — Targeting higher levels
✨ Euro showing bullish momentum against USD.
✨ Buyers are holding strong support at 1.17500.
✨ Upside pressure is building for a breakout.
✨ Trend indicates further gains ahead toward key resistance.
✨ Market sentiment favors the Euro as strength continues.
⚡ Stay with the buyers — momentum is on your side!
---
Do you want me to add specific target levels (like TP1, TP2, SL) to make it look more like a professional signal?

XAU/USD – Bullish Breakout: Buy Dips Toward $3,409 Target📊 XAU/USD (Gold) – 2H Analysis
Gold has just broken out of its descending channel, showing a clear change of character (CHOH) around the $3,348–$3,358 support zone. This breakout suggests bullish momentum is taking control after weeks of compression.
Key Observations:
✅ Support Zone: $3,348–$3,358 is now a strong demand zone (previous rejection area flipped to support).
✅ Moving Averages: Price is above both the EMA 70 ($3,342) and EMA 200 ($3,346), strengthening the bullish bias.
✅ Projection: A potential continuation rally toward $3,409 (major liquidity target).
⚠️ Risk: If the support zone fails, price could re-test $3,334 or even $3,326.
Trading Plan (Short-Term):
Entry (Buy): Around $3,358–$3,348 (support retest).
Stop Loss: Below $3,342 (under EMAs).
Target 1: $3,390
Target 2: $3,409
👉 In summary: Gold is in a bullish reversal phase, and buying dips into the support zone offers the best risk-reward setup.

BTC/USD Supply Zone Rejection Setup This BTC/USD 30-min chart shows price climbing within a rising channel toward a POI Supply Zone (114,201 – 114,940 USD). The market is respecting both the support line and rejection line while trading above the EMA 70 (111,733) and EMA 200 (112,102), indicating bullish momentum in the short term.
Key Analysis Using Strategies:
Trend/EMA Strategy: Price is above both EMAs, signaling bullish continuation until the supply zone.
Channel Strategy: Price is moving inside an ascending channel; upper channel resistance aligns with the supply zone, suggesting potential reversal.
Supply & Demand: Strong supply zone at 114,201–114,940 is the key resistance area to watch for rejection.
Price Action: After breakout from EMA and minor consolidation, price shows bullish structure with higher highs and lows.
Risk Management: Possible short entry at supply zone (114,201–114,940) with stop-loss above 114,940, and targets near 112,100 and 109,000.
📌 Summary: Short-term bullish toward supply zone, but a potential bearish reversal setup forms at 114,201–114,940 if rejection occurs, with downside targets around 112,100 → 109,000.

BTCUSD Short Opportunity, Bears Take Control BTCUSD is currently trading around 116,980, facing strong rejection near the 117,200–117,500 resistance zone. The recent price action suggests that sellers are gaining control as bullish momentum fades. A sustained move below 116,800 could trigger further downside pressure, pushing Bitcoin toward 115,500 and 114,800 in the short term. If the bearish structure remains intact, the next major target lies near the psychological level of 110,000, which aligns with previous demand zones and a key Fibonacci retracement level. Stop-loss should ideally be placed above 117,600 to protect against any false breakouts. Watch for increased volatility during US trading hours and upcoming macroeconomic data releases, as these could accelerate the move. Overall bias remains strongly bearish as long as BTC trades below 117,500.

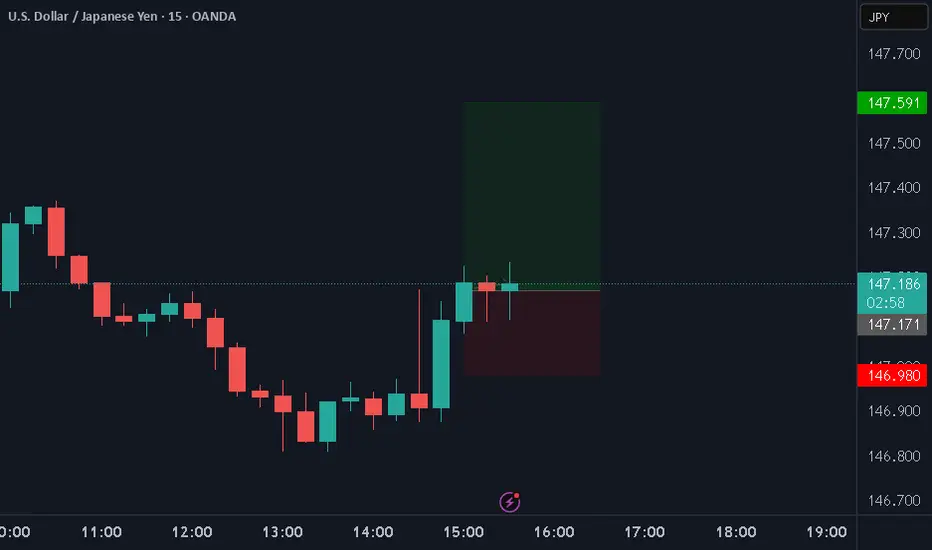
USDJPY longs due to better than expected Eco dataFor the week ending August 23, 2025, U.S. initial jobless claims were 229,000, below the forecast of 231,000 and down from the previous week's revised figure of 234,000. This suggests a slight improvement in new unemployment filings.
Real gross domestic product (GDP) increased at an annual rate of 3.3 percent (0.8 percent at a quarterly rate) in the second quarter of 2025 (April, May, and June), according to the second estimate released by the U.S. Bureau of Economic Analysis.
Due to the above data being better than expected, we can expect the dollar to increase in strength over the short term.
EUR/USD Bearish Rejection at Resistance Zone – Target 1.15392📉 EUR/USD 1H Chart Analysis
Trend: The chart is showing a clear bearish trend inside a descending channel (support & rejection lines). Price continues to respect this downward structure.
Resistance Zone: A strong supply/resistance area is marked at 1.16148 – 1.16307 (highlighted in pink). Sellers are likely to defend this zone.
Indicators:
Price is trading below the 70 EMA and 200 EMA, confirming bearish momentum.
EMA crossover suggests continued downward pressure.
Price Action: Recently, a small pullback (yellow highlight) is visible after touching the lower boundary of the channel, indicating a short-term retracement before another bearish push.
Strategy:
📍 Entry: Look for short entries near the resistance zone (1.16148 – 1.16307).
⛔ Stop Loss: Above 1.16456 (previous high / EMA resistance).
🎯 Target: First target 1.15392, aligning with the projected channel support and marked demand area.
✅ Summary:
EUR/USD remains bearish as long as price stays below the EMAs and inside the descending channel. Expect rejection from the resistance zone and continuation to the downside toward 1.15392.

EURGBP short due to weak Euro area PMI and Strong UK PMI DataThe most recent Euro Area Services PMI data available is for August 2025, showing a value of 50.7, down from 51.2 in July 2025, and slightly below the forecast of 50.8. This indicates a slight slowdown in the services sector's expansion, as a reading above 50 still denotes growth, but the drop suggests a loss of momentum.
The most recent data for the UK Services PMI, specifically the S&P Global/CIPS Services PMI for August 2025, is 53.6, surpassing the forecast of 51.8 and improving from the previous reading of 51.8 in July 2025. This indicates a stronger expansion in the UK services sector, reflecting robust business activity.
Due to the above economic data result, we expect the Euro to weaken against the Pound.
This is a classic example of trading strong data vs weak data.

EURGBP shorts due to higher than expected UK CPI y/y readingThe most recent UK Consumer Price Index (CPI) data for July 2025 indicates an annual inflation rate of 3.8%, an increase from 3.6% in June 2025, marking the highest level in 18 months. Key drivers include rising transport costs and food inflation hitting a 16-month peak. Core CPI, excluding volatile food and energy prices, climbed to 3.7% from 3.5% in May 2025. The CPI index stood at 138.90 points in June 2025, up from 138.40 points in May.
As a result of the above date, we expect the EUR to weaken against GBP.
