ES (S&P500) - Analyses - Breakout or Breakdown Plan (Sep 9)S&P 500 E-mini (ES) keeps ranging inside 6,490–6,505, with repeated taps of 6,516 above and 6,490–6,496 below. Tomorrow I’m stalking a box resolution during the AM session, then a second chance in the PM window.
Key Zones
Resistance: 6,505–6,516 (NYPM/NYAM lid). Above it: 6,541.25 (PDH) → 6,547.75 (IBH).
Support: 6,495–6,490 (NYAM/NYPM floor). Below it: 6,481.0 → 6,471.5 (hard pools).
Range to watch: 6,490–6,505 (decision box).
Game Plan (structure-first)
LONG (breakout-acceptance)
1. 5-minute displacement close > 6,505–6,516.
2. Retest 6,501–6,503 (OB/FVG/OTE) and hold.
3. Entry on confirm; Targets: TP1 6,541.25, TP2 6,547.75, TP3 6,555+.
4. Invalidation: any 5-minute body back ≤ 6,500 after breakout.
SHORT (breakdown-acceptance)
1. 5-minute displacement close < ~6,496.
2. Retest 6,498–6,500 (failed reclaim) and roll.
3. Entry on confirm; Targets: TP1 6,481.0, TP2 6,471.5, TP3 6,464–6,465.
4. Invalidation: any 5-minute body ≥ 6,500 after fill.
Timing windows
Primary: 09:30–11:30 ET and 13:30–15:30 ET (trade management only in between).
We are currently consolidating below 6,516, with a clear liquidity ladder leading to PDH 6,541.25 if the movement is accepted. If it fails, we have stacked support levels around 6,481 and 6,471 that typically attract price action once 6,496 breaks down.
Please confirm with ES and NQ: we want both indices to move in sync (no bearish signs of market tension on longs, and no bullish signs of market tension on shorts).
What could affect ES tomorrow?
NFIB Small Business Optimism (Aug): 6:00 AM ET.
API crude inventories (for CL correlation): Tuesday around 4:30 PM ET.
(For Wednesday's context: EIA petroleum report at 10:30 AM ET.)
Futures

GOLD hits $3,600 target, market focuses on CPIOANDA:XAUUSD continued to surge, hitting a record high of $3,600/ounce on Friday, following unusually weak U.S. non-farm payrolls data. The market now believes there is a 10% chance the Federal Reserve will cut interest rates by 50 basis points in September, leaving investors wary of the risk of a significant rate cut at this meeting.
The Federal Reserve is likely to cut interest rates by 50 basis points in September
According to the CME's "Fed Watch" tool, the probability of the Fed keeping interest rates unchanged in September is 0, the probability of cutting interest rates by 25 basis points is 88.3%, and the probability of cutting interest rates by 50 basis points is 11.7% (the probability was 0 before the release of non-farm payrolls data).
OANDA:XAUUSD is currently hitting new highs as bulls see a significant slowdown in employment as a sign of more rate cuts. The outlook for gold remains bullish as employment concerns continue to outweigh inflation in the short to medium term.
OANDA:XAUUSD is up 37% this year, driven largely by a weaker dollar, central bank buying, dovish monetary policy and rising geopolitical and economic uncertainty.
Gold itself does not generate interest, but it does well in low- or high-uncertainty environments, making it a safe haven for investors’ money.
The outlook for gold is positive as the Federal Reserve’s independence is under threat following Trump’s attempt to fire Fed Governor Tim Cook, weakening the dollar and boosting investor appetite for the precious metal. Gold traders are focused on next week’s US Consumer Price Index (CPI) data. If inflation continues to decline, that would strengthen the case for a rate cut at the September 16-17 meeting.
Technical Outlook Analysis OANDA:XAUUSD
First, gold has achieved the $3,600 price target and a new all-time high.
Currently, the technical conditions and technical positions are all bullish, with a short-term directional bullish channel and major support from the EMA21. Meanwhile, the Relative Strength Index (RSI) has not provided any signals of a possible correction in momentum, even though it has been operating in the overbought zone (80 to 100) for some time.
In the short term, gold may retest the all-time high, then target around $3,613 in the short term, which is the price point of the 0.382% Fibonacci extension. And the nearest support is noted at $3,574, which is the price point of the 0.236% Fibonacci extension.
As long as gold remains above $3,550, it is not in a position to correct lower, and any dips due to profit-taking should be considered as a short-term move rather than a trend.
Finally, the overall trend of gold is bullish, and the notable points will also be listed as follows.
Support: $3,574 – $3,550
Resistance: $3,600 – $3,613
SELL XAUUSD PRICE 3607 - 3605⚡️
↠↠ Stop Loss 3611
→Take Profit 1 3599
↨
→Take Profit 2 3593
BUY XAUUSD PRICE 3548 - 3550⚡️
↠↠ Stop Loss 3544
→Take Profit 1 3556
↨
→Take Profit 2 3562

GOLD MARKET ANALYSIS AND COMMENTARY - [Sep 08 - Sep 12]This week, the international OANDA:XAUUSD price increased sharply, from 3,436 USD/oz to 3,600 USD/oz and closed the week at 3,586 USD/oz. The reason for the sharp increase in gold price this week is due to the conflict between the Trump administration and the FED increasing when Mr. Trump announced the dismissal of FED Governor Lisa Cook. Previously, Mr. Trump repeatedly attacked FED Chairman Jerome Powell for not reducing interest rates and also threatened to fire Mr. Powell.
In addition, the US non-farm payrolls (NFP) report for August dealt a further blow to the already weak job market, as employers added just 22,000 jobs, far below economists' forecasts of 75,000. The dismal figure followed an equally worrying July report of 73,000 new jobs, while revisions reduced the number by 258,000 jobs from the previous two months. Meanwhile, the unemployment rate rose to 4.3%.
The worsening jobs picture has reinforced expectations that the Fed will cut interest rates at its meeting on September 16-17. Market participants now see a 0.25% rate cut as a near certainty, with some economists even suggesting the Fed could cut rates by as much as 0.5%.
Next week, the US will release two important inflation figures, CPI and PPI. If the monthly core CPI increases by 0.5% or more, it may cause investors to reassess the probability of multiple rate cuts by the FED this year. This will support the USD, which will be detrimental to gold prices next week. On the contrary, if the core CPI increases by only 0.3%, it may cause the USD to fall, supporting gold prices to continue to rise next week.
📌Technically, on the H4 chart, if the gold price maintains its uptrend, it will move up to the next resistance level determined at the Fibonacci extension Fibo261.8 level around the threshold of 3,680 USD/oz. In case of a correction, the support level should be noted around the hard resistance level as well as the dynamic resistance level at the area of 3,450 USD/oz.
Notable technical levels are listed below.
Support: 3,574 – 3,550USD
Resistance: 3,600 – 3,613USD
SELL XAUUSD PRICE 3681 - 3679⚡️
↠↠ Stop Loss 3685
BUY XAUUSD PRICE 3449 - 3451⚡️
↠↠ Stop Loss 3445

IPUSDT, Podjatiya, Proboy model bilan Long pozitsiya1. On the D1 chart, a zone formed from the Paranormal Bar!
2. Relative to the 8.5320 zone, an LP has appeared, but the price has not moved downward.
3. Relative to the zone, price lows are rising, while the highs are being squeezed into one price point.
4. If, on the local TF, the price breaks above the 8.5320 price zone without an impulsive move, we will try to enter a trade with a long position!

BTC ANALYSIS📊 #BTC Analysis
✅There is a formation of Descending Channel Pattern in daily time frame in #BTC .
Also there is a perfect breakout and retest. There is an instant major resistance and major support zone and if #BTC breaks the resistance zone then we would see a bullish move
👀Current Price: $1,10,800
🎯 Target Price : $1,21,700
⚡️What to do ?
👀Keep an eye on #BTC price action and volume. We can trade according to the chart and make some profits⚡️⚡️
#BTC #Cryptocurrency #Breakout #TechnicalAnalysis #DYOR

SYRUP ANALYSIS🔮 #SYRUP Analysis - Update 🚀🚀
💲 We can see that there is a formation of Falling Wedge Wedge Pattern in #SYRUP and we can see a bullish movement after a good breakout. Before that we would see a little retest and and then a bullish movement.
💸Current Price -- $0.4800
📈Target Price -- $0.5900
⁉️ What to do?
- We have marked crucial levels in the chart . We can trade according to the chart and make some profits. 🚀💸
#SYRUP #Cryptocurrency #Breakout #DYOR

BTC - Short Plan Update / Reminder Anyone who didn’t take this trade at top entry may enter at the lower level here.
Entry - 110,500-111,000
Stop Loss - 113,000 (High Risk) to 120,000 (Low Risk)
Targets:
1) 81,000
2) 61,000
3) 36,000
4) 9,000
Personally I will time any crypto related trades with this pathway. Everything will drop and rise with bitcoins movement.
Happy trading.
Disclaimer - this is not financial advice and outlines my personal trade plan only

BUY USOILBeen a while since I last shared a trade to take, but today as you can see, the market grabbed the LQ to give us an entry point to take for a long trade.
Follow for more!

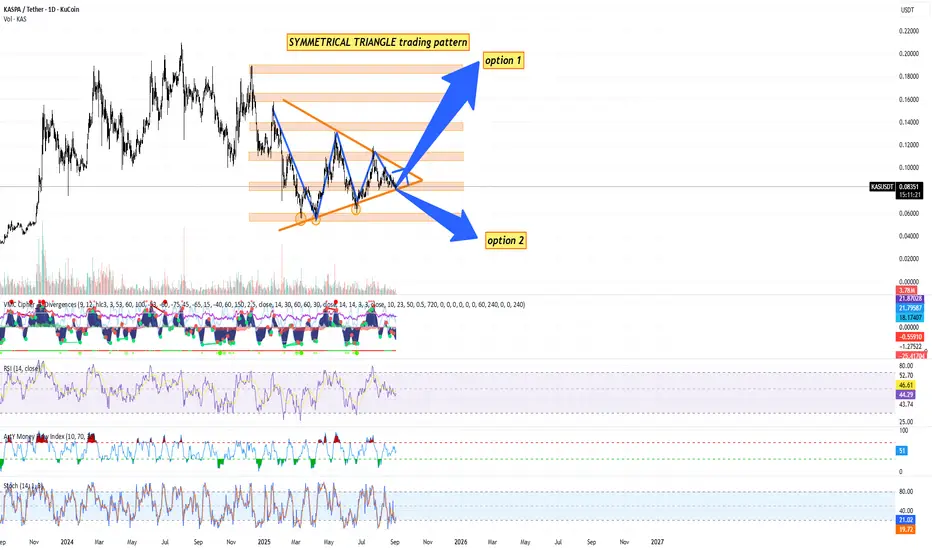
KASPA / USDT DAILY CHART KUCOIN - TA + TRADE PLANTechnical Analysis (Daily Timeframe) by Blaž Fabjan
Chart Pattern
The price is consolidating within a Symmetrical Triangle pattern.
This is a neutral continuation pattern – it signals that a major breakout (either upward or downward) is approaching as the apex is nearing.
Both higher lows and lower highs confirm the formation.
Key Support & Resistance Levels
Immediate support zone: $0.080 – $0.082
Strong support below: $0.070
Immediate resistance: $0.095 – $0.100
Major resistances above: $0.120, $0.140, $0.160, $0.200, $0.220
Indicators
Volume: Declining within the triangle – typical before a breakout.
RSI (14): ~46 → Neutral, no overbought/oversold signals.
Stochastic RSI: Oversold (~20), suggesting possible short-term upside bounce.
MFI (Money Flow Index): Neutral (~51), showing balanced inflows/outflows.
MACD/VM indicator: Bearish momentum has slowed, histogram flattening.
Scenarios
Option 1 (Bullish breakout): If KAS breaks above the $0.095–$0.100 zone with volume, next targets are $0.120 → $0.140 → $0.160 → $0.200+.
Option 2 (Bearish breakdown): If KAS loses $0.080, potential retest of $0.070 → $0.060 support levels.
Trading Plan for KAS/USDT
🔹 Short-Term Swing Trade (1–4 weeks)
Entry Zone (Buy):
Aggressive: $0.082 – $0.085 (current support area).
Conservative: On confirmed breakout above $0.095 with volume.
Stop Loss:
Below $0.078 (tight stop) OR below $0.070 (safe stop).
Take Profit Targets:
$0.100 (first resistance, partial TP)
$0.120 (main target)
$0.140 (strong resistance)
🔹 Medium-Term Position Trade (1–3 months)
Entry Strategy: Accumulate in the $0.080–$0.085 range.
Stop Loss: Below $0.070 (close daily candle confirmation).
Targets:
Base case: $0.160
Optimistic case: $0.200 – $0.220
🔹 Risk Management
Risk per trade: 1–2% of portfolio.
Position sizing according to stop-loss distance.
Avoid over-leveraging; triangle breakouts can produce false moves before direction confirms.
Kaspa is entering the decision zone – the symmetrical triangle is compressing, and a major breakout is imminent in coming weeks.
Momentum indicators show neutrality, giving equal probability for either breakout direction.
The safest approach is to wait for breakout confirmation (daily close above $0.095 or below $0.080 with volume).
If bullish, Kaspa could target +40–100% upside over the next quarter. If bearish, downside risk is -20–30%.
Recommendation:
For conservative traders → wait for breakout confirmation.
For aggressive traders → accumulate around support ($0.082–$0.085) with tight stop-loss below $0.078 and scale out profits at resistance levels.
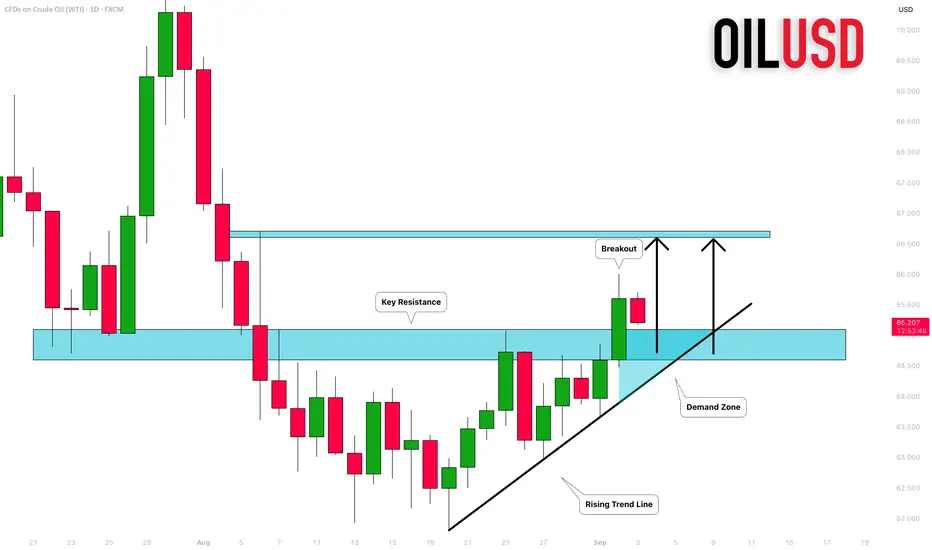
CRUDE OIL (WTI): Important Breakout!
With a strong bullish rally, WTI Crude Oil violated a significant
daily resistance cluster yesterday.
The broken structure and a rising trend line compose an important
demand zone now.
I will expect a bullish continuation from that.
Next resistance - 66.6
❤️Please, support my work with like, thank you!❤️
Gold’s $200 Surge Defies the DollarOver the past week, gold prices exploded by more than $200 per ounce, shattering the $3,500/oz threshold to new all-time highs . Silver joined the surge, breaching $40/oz for the first time since 2011 . This explosive precious metals rally is striking not only for its magnitude, but because it occurred in tandem with a strengthening U.S. dollar – a sharp break from the usual inverse correlation between gold and the greenback. Typically, “gold’s appeal reflects an inverse relationship with the dollar’s value”, as one analyst noted , and gold soars when the dollar slumps. Yet this time, the U.S. Dollar Index held firm (even rising against some currencies), so gold’s ascent “alongside the value of the US dollar” appears anomalous .
This disconnect has confounded the simplistic media narrative that tried to pin gold’s move on U.S. political drama – namely turmoil surrounding Donald Trump pressuring the Federal Reserve. Indeed, mainstream headlines have leaned on that explanation: “Gold surges after Trump’s Fed pressure,” blared the Financial Times, after President Trump’s attempted (and unprecedented) firing of Fed Governor Lisa Cook raised alarms about Fed independence . Bloomberg News similarly attributed gold’s spike to “rate-cut bets” spurred by Trump’s actions . There is some truth here – investors clearly sought safety amid U.S. political uncertainty, with the largest gold ETF (SPDR Gold Shares, ticker GLD) hauling in over $2.3 billion of inflows last week to top all ETFs, “as gold prices flirted with record highs near $3,500” following Trump’s attempt to oust a Fed official . Concerns over Fed independence and Washington turmoil did fuel safe-haven demand . But a closer investigation of market data and cross-asset flows reveals a more complex story than “Trump made gold jump.” In particular, the simultaneous rise of gold and the dollar hints at other forces at play – potentially global capital rotations and eurozone undercurrents – that the simplistic narrative overlooks.
Order Flow: U.S. Buying vs. Asian Selling
One immediate clue lies in where the strongest gold buying originated. Market internals and order flow patterns suggest that North American investors led this rally, while Asian and European participants were net sellers or laggards. Gold’s intraday price action repeatedly showed dips during Asia and London trading hours, followed by robust gains during U.S. market hours – indicating steady accumulation out of New York overcoming profit-taking elsewhere. This aligns with recent flow trends: “Gold ETF buying has flipped from Asia to Western investment markets”, notes BullionVault, as China and India saw outflows while U.S. and European gold funds began expanding together . In the past fortnight, Asian-listed gold ETFs shrank by over 5 tonnes – the heaviest 2-week outflow since the Ukraine invasion – even as Western funds saw their strongest stretch of inflows in over two years .
Physical gold selling in Asia corroborated this trend. As prices hit fresh highs above $3,000 and $3,500, Asian jewelry holders rushed to “cash in”. In India’s bazaars and Middle Eastern souks, retailers report a surge of people selling old jewelry and coins to lock in gains . “Customers raced to cash in their old gold,” Reuters noted, with scrap sales booming across India and the Middle East . This flood of recycled gold effectively made Asia a net supplier to the market during the rally, potentially “tempering gold’s rally” in those regions if it continues . In contrast, U.S. investors were voracious buyers: not only did American ETFs see big inflows, but U.S. futures markets showed relentless bids during New York trading sessions, driving price strength into each day’s close.
In sum, Western demand carried gold higher even as Eastern markets took profits. This East-to-West flow reversal suggests the price surge was not simply a global panic “bid” for gold, but rather a targeted rotation of capital – with U.S. and European buyers eagerly absorbing the supply coming out of Asia. Such a dynamic is important because it hints that new money (likely institutional and speculative) in the West was a key driver, rather than traditional physical demand from Asia (which actually softened amid the high prices).
Gold in USD vs. Gold in EUR: A Currency Disconnect
Another intriguing aspect of this rally is how differently it played out in U.S. dollars versus other currencies – particularly the euro. Gold’s price in USD hit record highs, but gold priced in euros (XAU/EUR) did not. In fact, at gold’s peak this week the euro-priced ounce “held beneath spring highs” even as the USD-priced ounce broke out . Gold in British pounds and Japanese yen did notch new records alongside USD gold , but the euro-denominated price lagged.
This discrepancy between XAU/USD and XAU/EUR is telling. Had the rally been driven purely by U.S.-centric fears (Trump/Fed turmoil) causing a weak dollar, we would expect the opposite – gold might jump in USD but soar even more in euros as the dollar falls. Instead, the dollar strengthened against the euro, and gold’s rise in USD terms outpaced its rise in EUR terms. One interpretation is that some of the buying came from investors shifting capital out of euro assets and into dollar-based gold, effectively boosting both gold and the dollar simultaneously. In other words, capital flight from euro-based holdings could be an underlying factor. If European investors (or global investors with euro exposure) moved funds into U.S. dollars or dollar-priced gold, that would drive the dollar higher at the same time as gold – precisely what we saw.
It’s notable that earlier in the year, gold in euros had spiked to record levels (during a bout of euro weakness and regional banking worries), whereas U.S. gold lagged at that time. Now the roles reversed: “the dollar price topped its previous high, but the euro price of gold stayed below its spring peak” . This reversal suggests the latest rally was U.S.-led, not euro-led. Rather than a panic specifically within Europe, this feels like a more subtle rotation away from the euro toward “safe” currencies and assets. The euro’s exchange rate was relatively firm during this gold spike (indeed, gold’s jump was despite a firm dollar, not because of a weak one), implying the move wasn’t about a collapsing euro – it was about proactive reallocation. In essence, global investors may be quietly diversifying out of euros into gold (and dollars) as insurance against potential eurozone troubles down the line.
Speculators Pile In: CFTC Data Shows Growing Longs
Fueling gold’s ascent has been a wave of speculative positioning in the futures market. The Commodity Futures Trading Commission (CFTC) Commitments of Traders (COT) report reveals that hedge funds and money managers have been steadily adding to bullish gold bets. In fact, bullish bets are at their highest levels in years. As one market analysis noted, “the net long position of Managed Money traders rising… back to 4-year high… reaching 155% of long-term average” . This means speculators hold vastly more long contracts than usual, a clear sign of momentum-chasing and confidence in further upside.
Recent data confirms the build-up: speculators’ net-long gold positions jumped to around 237,000 contracts in mid-August (versus ~178,000 in early 2024) and remain elevated . For context, that mid-August figure was the largest net long in at least four years. Even trend-following funds that had been absent are now “firing on all cylinders,” adding to length as gold broke out. Importantly, while these speculative inflows are large, some analysts point out they are “relatively modest… given the move in gold prices – suggesting there is further upside to come” if more investors pile in . In other words, positioning is bullish but not yet at extreme record levels in proportion to gold’s price move, leaving room for additional buyers.
This surge in paper gold interest highlights that the rally has a strong “hot money” component. It’s not just passive safe-haven holding; fast-moving traders are actively driving the market higher. The rising COT longs also underscore why gold’s jump defied the dollar: in a typical risk-off scenario, one might see short covering or flight from other assets incidentally lift gold, but here we have an affirmative speculative buildup anticipating higher gold ahead.
Massive ETF Inflows: GLD and Silver ETFs See Big Demand
Alongside futures activity, investment flows into gold and silver exchange-traded funds (ETFs) have been massive, indicating broad-based demand from institutions and retail investors alike. The flagship gold ETF, GLD, saw particularly eye-popping inflows. In the week of the surge, GLD attracted roughly $2.3 billion of new money, making it “the No.1 asset gatherer among U.S.-listed ETFs” . To put that in perspective, GLD outdrew even the largest stock index funds for the week – a remarkable rotation of capital into precious metals.
These inflows pushed GLD’s total assets to new heights, as investors sought the convenience of paper gold exposure during the rally. Other precious metals funds saw similar interest: iShares’ silver trust (SLV) reportedly logged sizable inflows as silver prices jumped in unison with gold. Silver’s rally – over 10% in a week to above $40/oz – was the strongest in years, and analysts noted that “momentum traders obviously also became involved” once silver broke technical levels . The U.S. government’s proposal last week to classify silver as a critical mineral (which could spur domestic stockpiling) “helped to fuel the surge through $40” , giving fundamental justification to silver’s move and further enticing ETF investors.
Taken together, the ETF data paints a picture of widespread investment allocation into precious metals. Gold-backed ETFs globally had already been seeing positive inflows in recent months – the World Gold Council reported that the first half of 2025 saw the largest H1 gold ETF inflows since 2020 – and this past week accelerated that trend. The demand was not confined to the U.S. either; European-listed gold funds also saw creations (with particularly strong buying in the UK, Switzerland, and Germany in recent months) . But the U.S. flows were dominant. North American funds accounted for the bulk of new gold ETF buying this quarter , reflecting that U.S. investors are driving this shift to hard assets.
Such massive ETF inflows, alongside record futures longs, indicate a broad conviction trade into gold and silver. Whether as an inflation hedge, a geopolitical hedge, or a play on future Fed easing, capital is pouring into these assets via easily accessible vehicles. GLD’s $2+ billion weekly haul underscores that this was not a niche move – it was front and center in capital markets.
Not a Typical “Risk-Off” – Stocks, Crypto and Bonds Stayed Resilient
Crucially, unlike many past gold spikes, this one did not coincide with a major selloff in other asset classes. In classic market panics, gold’s rise is often mirrored by tumbling equities, collapsing bond yields (as investors buy Treasuries), or even a rush out of speculative assets like cryptocurrencies. That didn’t really happen here – indicating this gold rally was driven by rotation of capital from cash or low-yield reserves, rather than forced liquidations elsewhere.
Consider the stock market: global equities barely blinked. The MSCI World Stock Index had just hit an all-time high in late August; it fell only about 1.5% from that peak during gold’s run-up . A 1.5% dip is trivial – essentially normal daily volatility – and U.S. indices similarly remained near record levels. There was no sense of an equity crash or widespread fear in stocks; in fact, some risk assets like small-cap stocks rose on hopes of Fed rate cuts. Crypto markets were also relatively stable. Bitcoin and other major cryptocurrencies held in their recent trading ranges with no signs of a flight-to-safety out of crypto. Unlike early 2020 (when Bitcoin plunged during a dash for cash), this time crypto was “largely unfazed”. If anything, crypto investors likely interpreted Fed dovishness as positive, which could have buoyed coins – but there was no mass exodus from crypto into gold.
Bonds told a more nuanced story. U.S. Treasuries did not rally alongside gold – in fact, long-term bond prices fell last week, sending yields higher . Typically, if there were a major fear-driven episode, one would expect Treasury yields to plunge (as bond prices rise on safe-haven buying). Instead, the 10-year and 30-year yields ticked up. Notably, gold and bonds moved in opposite directions: “the split between government debt and gold prices has been underway, with gold rising… while the value of longer-term Treasury bonds has halved over five years” . Part of last week’s bond weakness was due to fresh concerns about fiscal deficits and inflation – which ironically can boost gold. A fund manager at Newton noted that the bond market isn’t yet signaling long-term inflation, but “there is falling confidence that can continue indefinitely”, characterizing the situation as a “fiscal crisis, rather than an economic crisis” driving gold’s rise . In short, gold’s jump wasn’t the result of a panic-driven bond rally – if anything, it coincided with a bond selloff. That implies the money fueling gold had to come from elsewhere (cash, forex reserves, or rotation out of other holdings) rather than from investors dumping stocks and bonds in fear.
This cross-market resilience supports the idea that the gold/silver inflows were more of a strategic reallocation or hedge, not a reaction to an acute crash in other assets. As one analyst put it, “If you were a Martian observing this, gold and long-term bonds sending opposite signals is telling you there are concerns” below the surface – but it’s an unusual mix of signals. Investors didn’t run for the exits in equities or corporate bonds; instead, they appear to have drawn on sidelined cash or reallocated currency reserves to fund their gold purchases. This makes the episode more interesting: it hints at a rotation happening quietly, rather than an obvious crisis visible in all markets.
Beyond the Trades: Is Capital Fleeing the Eurozone?
These patterns – U.S.-led gold buying, euro underperformance, no broad risk asset selloff – point to a deeper macro narrative: a potential rotation of capital out of Europe’s financial system and into hard assets. Several data points and developments reinforce this interpretation:
Reserve Currency Shifts: In a striking milestone, gold has now surpassed the euro as the world’s second-largest reserve asset (behind only the U.S. dollar). An ECB report highlighted that for the first time ever, gold represents a larger share of global foreign exchange reserves (20%) than the euro (16%) . In other words, central banks collectively hold more value in gold than in euro-denominated assets. This reflects concerted gold accumulation (over 1,000 tonnes per year since 2022, more than double the prior decade’s average ) at the expense of fiat holdings. It’s effectively a rotation out of traditional currencies – notably the euro – and into bullion. Such a shift “is remarkable”, as one market veteran noted, and coincides with 95% of central banks stating they plan to increase gold reserves in the next year – the highest on record . This trend screams a subtle mistrust in the long-term stability of the euro and other fiat assets, and a desire for the safety of hard currency.
Eurozone Stress Signals: While the eurozone isn’t in open crisis, there are hints of structural stress that may be nudging smart money to preemptively seek safety. Political instability is one concern – for example, in France (the Eurozone’s second-largest economy), the government is teetering on the edge of collapse amid budget battles. Even ECB President Christine Lagarde cautioned that “any risk of a government falling in the euro zone a concern”, after French markets wobbled on snap election fears . Such political tremors feed into a narrative of euro-area fragility. Meanwhile, European banks and governments are grappling with high debt loads and thin margins. As interest rates rose this year, sovereign and corporate borrowing costs in Europe jumped, exposing vulnerabilities in heavily indebted nations. Observers have warned of “debt saturation” and precarious leverage in Europe’s financial system (some even pointing to bloated gold derivatives positions at European banks as a risk) . If investors – or other central banks – perceive even a small chance of a Eurozone financial accident (be it a debt crisis, a bank failure, or political rupture), they may quietly trim exposure now.
Geopolitical Fragmentation and Inflation Hedging: Beyond Europe-specific issues, the broader macro backdrop is one of fracturing globalization and lingering inflation – conditions under which hard assets historically thrive. Under President Trump, the U.S. has upended elements of the post-WWII order, from trade alliances to security commitments . Trade wars and tariffs are forcing reallocations of supply chains and reserves. According to Reuters, Trump’s aggressive policies and sanctions have “upended Western security policy” and contributed to an environment where diversifying away from reliance on any single currency (especially the U.S. dollar) becomes prudent . Many developing countries have responded by boosting gold holdings as a hedge against geopolitical risks and potential sanctions (a lesson learned after Russia’s USD reserves were frozen in 2022) . This “de-dollarization” impulse, interestingly, often doesn’t benefit the euro – it benefits gold. Nations looking to reduce dollar dependence aren’t rushing into euros; they’re buying bullion (and to some extent, yuan) . This adds to global gold demand independent of day-to-day traders.
At the same time, inflation remains a concern. Though off its peak, inflation in both the U.S. and Europe has been stubbornly above central bank targets, eroding trust in fiat purchasing power. Gold is the classic inflation hedge, and its appeal grows when investors worry that “there are concerns… the right tail of inflation risk” in the future . Notably, this gold rally occurred even as inflation expectations in bond markets remained relatively contained – suggesting some investors aren’t waiting for official signals; they are positioning early against the possibility of inflation or currency debasement down the road. The fact that inflation-linked bonds have not rallied (underperforming regular bonds) implies the bond market isn’t convinced inflation will run away . But gold’s surge could be seen as a belts-and-suspenders approach – insurance in case the bond market is wrong or central banks falter.
Hard Asset Accumulation by Private Wealth: It’s not just central banks. Wealthy individuals and institutions are also shifting into tangible assets. Anecdotally, vault operators report high demand for physical gold storage. Real assets from commodities to real estate are getting increased allocation in portfolios as a hedge against both inflation and geopolitical strife. Silver’s inclusion on a U.S. critical minerals list last week (to secure supply chains) is emblematic of the new era of resource nationalism and strategic stockpiling . Gold and silver stand to benefit as strategic assets in a fragmenting world. The rally in both metals might be an early sign of investors preferring the certainty of hard assets in hand over promises on paper.
All these factors converge to a clear insight: the gold and silver surge may be an early warning signal of capital seeking safety from systemic risks – particularly those emanating from currency systems and financial institutions. Unlike a sudden crisis that causes a panicked stampede, this feels more like a strategic redeployment of capital: a rotation before the full storm hits.
Conclusion: A Canary in the Coal Mine?
Gold’s extraordinary run this past week – soaring in concert with a firm dollar, absent a stock market crash – is not just a one-off curiosity. It appears to be a manifestation of deeper shifts in investor behavior and economic regime. The simple story of “Fed drama and political turmoil” belies the larger context: we are likely witnessing a rotation toward safety and solidity in anticipation of future turbulence. Whether that turbulence comes from Europe’s financial system, unsustainable government debts, or a fracturing global order, investors are hedging their bets.
Precious metals are, in effect, serving as a barometer of macro stress and a receptacle for capital seeking refuge. As the European Central Bank’s own analysis noted, “gold generally offers a safe haven in times of stress… in extreme cases, gold prices tend to rise alongside the US dollar, while stock and bond prices decline” . That’s essentially what we’ve just observed – minus the sharp stock decline (at least so far). It puts policymakers on notice: something is bubbling beneath the surface. The last time we saw gold and the dollar rising together was during episodes like the onset of COVID-19 and the 9/11 attacks – clear crises. This time, the “crisis” is more subtle: a slow burn of fiscal strains, geopolitical realignments, and creeping distrust in institutions.
For investors and professionals, the takeaways are clear. Diversification into hard assets is gaining momentum, and not without reason. Gold’s role as a portfolio stabilizer is reasserting itself; even at record nominal prices, it’s attracting huge inflows as a form of insurance. The traditional inverse relationship with the dollar is not sacrosanct – when confidence in both major fiat blocs (dollars and euros) is tested, gold can rise against all currencies at once. Silver’s concurrent jump and its industrial strategic importance highlight that this is a broader precious metals renaissance.
Finally, it’s worth pondering the source of the $200 gold move. The evidence suggests it came not from panic, but from prudence – a reallocation from the quiet corners of cash and currency reserves into the safety of bullion. If that is the case, this gold surge could very well be the early tremor before larger quakes. Investors are effectively voting with their wallets, and their message is a cautious one: prepare for potential storms by holding real assets. Gold’s unusual rally, defying the dollar gravity, might be the canary in the coal mine for broader shifts to come – from an era of easy money and faith in central banks to one where tangible value and trust (or the lack thereof) drive decisions. As always, gold is both a barometer and a beneficiary of such paradigm shifts.
Sources:
Reuters – “Gold hits a record $3,532…main drivers fueled by U.S. President Trump’s upending of policy and Fed independence concerns.”
ETF.com – “GLD led all ETFs last week, hauling in $2.3B as gold flirted with $3,500.”
Reuters – “Gold tops $3,500… FT: ‘Gold surges after Trump’s Fed pressure’… Bloomberg: ‘Record high as rate-cut bets fuel demand.’”
BullionVault – Order flow: “Asian gold ETFs shrank…while European and North American products have now expanded together in 7 of the past 8 weeks, the strongest stretch in 27 months.”
Reuters – Physical market: “As gold prices jump… customers race to cash in old jewellery… If the rush to sell continues, could temper gold’s rally.”
BullionVault – “Dollar gold hit new highs…but Euro and Yuan price of gold held beneath spring highs”
BullionVault – COT data: “Net long position of Managed Money traders 4-year high…155% of long-term average.”
Reuters – “Silver breached $40, highest since 2011… momentum traders involved after US proposal to label silver a critical mineral helped fuel the surge.”
BullionVault – “Western stock markets dropped only 1.5% from last week’s record… long-term gov’t debt fell, driving yields higher, even as gold rose.”
ECB Financial Stability Review (via Frank Holmes) – “Gold now represents 20% of global FX reserves vs 16% for the euro – first time gold’s share exceeds euro’s.”
Reuters – Christine Lagarde: “France is solid but any risk of a government falling in the euro zone is a concern.”
Reuters – “Annual central bank gold purchases have exceeded 1,000 tons since 2022, double the 2010s average”
World Gold Council – “Gold ETFs saw 397t inflows Jan-June 2025, the largest first-half inflow since 2020.”
ECB Research – “In extreme cases (9/11, pandemic onset), gold prices tend to rise alongside the US dollar while stock and bond prices decline markedly – confirming gold’s safe-haven role in times of stress.”
- Gold trades near record highs on US rate cut bets; silver at 14-year high | Reuters
- Gold Surpasses Euro as the Second-Largest Reserve Currency in the World
- What does the record price of gold tell us about risk perceptions in financial markets?
- Gold Tops $3500 Record Price | Gold News
- Gold ETF Inflows Lead $34.3B Surge Into U.S.-Listed ETFs
- Gold ETF Investing Flips from East to West | Gold News
- After the gold rush: Asian, Mid-East sellers flood jewellery market | Reuters
- Central bank demand propels safe-haven gold to record peak | Reuters
- Explainer: Gold's record-breaking rally: who's keeping it going? | Reuters
- Global flows stay hot | World Gold Council
- France's far-right RN says it is getting ready for potential snap elections | Reuters
- Eurozone Financial Crisis: Debt and Derivative Dangers

TRUMP ANALYSIS📊#TRUMP Analysis
✅There is a formation of Descending triangle pattern on daily chart🧐
Pattern signals potential bullish movement incoming after a small retest 📉
👀Current Price: $8.37
🚀 Target Price: $11.29
⚡️What to do ?
👀Keep an eye on #TRUMP price action and volume. We can trade according to the chart and make some profits⚡️⚡️
#TRUMP #Cryptocurrency #TechnicalAnalysis #DYOR

TradeCityPro | LIKNUSDT Best Opportunity for Trading👋 Welcome to TradeCityPro Channel!
Let’s go to the LINK chart, the popular cryptocurrency, and analyze it together.
🌐 Overview of Bitcoin
Before starting the analysis, I want to remind you again that we moved the Bitcoin analysis section from the analysis section to a separate analysis at your request, so that we can discuss the status of Bitcoin in more detail every day and analyze its charts and dominances together.
This is the general analysis of Bitcoin dominance, which we promised you in the analysis to analyze separately and analyze it for you in longer time frames.
📊 Weekly Timeframe
On the weekly timeframe, LINK has been one of the cryptocurrencies that remained in a range for 500 days. After breaking out, we have seen the beginning of an uptrend.
This is exactly what I mean by avoiding capital lock-up. We waited weeks for the 8.06 trigger to break, allowing us to buy with momentum confirmation rather than buying inside the range and waiting in a high-risk market.
You might say, "Why not buy inside the range to avoid missing the 8.06 breakout?" My answer is that hundreds of coins are still stuck in similar ranges without showing any bullish moves, and even now, they could trap your capital for a long time, causing frustration!
📊 Daily Timeframe
In the daily timeframe, after being inside the range box between 11.58 and 15.50 and ranging in this area, we finally broke out and formed a curve movement.
Currently, after our uptrend, we have reached the 26.88 resistance, which previously rejected us from this area and is our most important resistance.
If we form a higher low in this area, we can make our spot buy after breaking 26.88.
📈 4H Timeframe
In the 4-hour timeframe, we experienced a very good uptrend and then entered a range phase, which increases the probability of a correction.
For a short position, after breaking 23.05, we can open a position with low risk and take profit quickly because the trend is bullish and we are not supposed to hold short positions for too long.
For a long position, we need to break the continuation trendline, and after activating the 23.89 trigger, we can open our long position. Our main trigger will be 26.5.
📝 Final Thoughts
Stay calm, trade wisely, and let's capture the market's best opportunities!
This analysis reflects our opinions and is not financial advice.
Share your thoughts in the comments, and don’t forget to share this analysis with your friends! ❤️

Nasdaq Buy ZoneThe Nasdaq has remained strong, but I am not looking to initiate any longer term longs until we can pull back into our buy zone, highlighted in green. If we hold that zone our next push is to the Fibonacci extensions above.

GOLD MARKET ANALYSIS AND COMMENTARY - [Sep 01 - Sep 05]This week, the international OANDA:XAUUSD price increased quite strongly from 3,352 USD/oz to 3,453 USD/oz. The reason for the continued increase in gold price is because investors are still expecting the FED to cut interest rates by 0.25% at the upcoming September meeting, as well as the conflict between the Trump administration and the FED.
Next week, financial markets in the US will be closed for Labor Day on Monday. On Tuesday, the Institute for Supply Management (ISM) will release its manufacturing PMI data. The PMI is forecast to increase slightly to 48.6 in August from 48 in July. If the forecast is correct, it will have a negative impact on gold prices next week.
In addition, on Friday, the US will release the August non-farm payrolls (NFP) report. If the NFP continues to decline compared to the expected 74,000 jobs, it will force the Fed to cut interest rates in September, which will have a positive impact on gold prices next week. On the contrary, a stronger-than-expected NFP growth, combined with an unchanged unemployment rate of 4.2%, could make the market tilt towards the Fed continuing to delay interest rate cuts, causing gold prices to fall next week. However, given the current US economic situation, the August NFP may continue to decline.
📌Technically, on the H4 chart, the gold price broke the Trendline and it is likely that the price will continue to increase to near the threshold of 3500 USD/oz. In case the price corrects again, it will return to the resistance zone at the threshold of 3370.
Notable technical levels are listed below.
Support: 3,430 – 3,400 – 3,371USD
Resistance: 3,450 – 3,500USD
SELL XAUUSD PRICE 3541 - 3539⚡️
↠↠ Stop Loss 3545
BUY XAUUSD PRICE 3369 - 3371⚡️
↠↠ Stop Loss 3365

GOLD eases as it tests $3,400, eyes US GDP dataOANDA:XAUUSD was broadly steady after a slight decline during the Asian session on Thursday (August 28), currently trading around $3,385/ounce. Investors will focus on the US GDP data, which is expected to cause significant market movements.
The revised second-quarter real gross domestic product (GDP) figure is expected to come in at today (Thursday), with an expected annualized quarterly growth rate of 3.1%, up from the previous reading of 3.0%. The US Bureau of Economic Analysis (BEA) will release its second-quarter GDP data. The BEA said in its preliminary estimate that the US economy grew at an annualized rate of 3%. A downward revision to the GDP data could hurt the dollar and help strengthen gold prices, while an upward revision could have the opposite effect.
Market attention will remain focused on US political tensions and trade war-related news. Following the release of US Q2 GDP data, the trading week will conclude with the release of the personal consumption expenditure (PCE) price index on Friday. The PCE index is the Federal Reserve’s preferred inflation measure and could influence market sentiment regarding a September rate cut.
Technical Outlook Analysis OANDA:XAUUSD
Gold has not been able to break above $3,400 after two sessions of testing, and it is currently retreating slightly from this level with a possible short-term target of $3,371, the 0.236% Fibonacci retracement point, as this is the closest support level currently.
Although gold may fall in the short term, it has also achieved the initial conditions for a possible increase, namely the price action maintained above the EMA21 followed by the RSI maintaining above the 50 mark but the slope is not significant, indicating that the upward momentum is not too strong.
As mentioned to readers, gold is in a sideways accumulation trend, while achieving some of the above short-term bullish conditions. Once gold breaks through the $3,400 mark, it will have the conditions to open a new bullish cycle, with the target then being around $3,430 to $3,450.
During the day, the technical outlook is more inclined towards short-term bullishness, and the notable points will be listed as follows.
Support: $3,371 – $3,350
Resistance: $3,400 – $3,430 – $3,450
SELL XAUUSD PRICE 3430 - 3428⚡️
↠↠ Stop Loss 3434
→Take Profit 1 3322
↨
→Take Profit 2 3316
BUY XAUUSD PRICE 3350 - 3352⚡️
↠↠ Stop Loss 3346
→Take Profit 1 3358
↨
→Take Profit 2 3364

ETH - High Risk ShortPer my BTC analysis, I expect the market to crash very hard and quickly, timed with the US dollar bearish retest on major weekly breakdown.
Entry in green, targets marked and path shown.
ETH fell below this major series of bearish trendlines, targets marked by analyzing liquidity and volume profile levels.

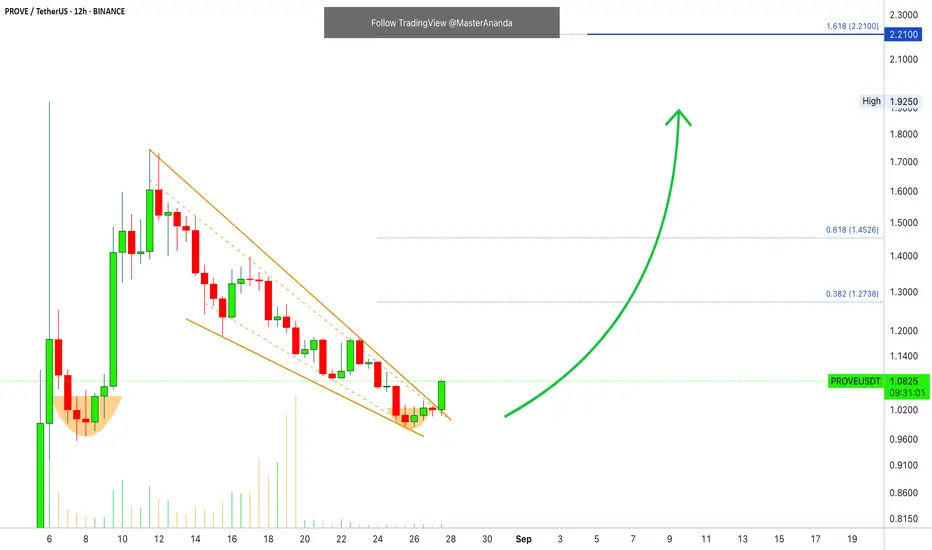
Prove · Futures Trade-NumbersHere we have an easy chart setup. It will be a great one with Bitcoin just turning green. This whole market is about to blow up.
The chart is good here PROVEUSDT. We have a perfect falling wedge pattern, with the trend-lines matching perfectly the candle wicks. What's better is the current bullish breakout after a higher low. These signals are strong when combined—bullish.
________
LONG PROVEUSDT
ENTRY: 0.9900 - 1.10 (STOP: 0.9815)
TARGETS: 1.16, 1.27, 1.45, 1.74, 2.21
________
This is an interesting pair and can be easy to trade. Our strategy is more based on great entry prices and timing, so we only need to buy; once bought, the market takes care of the rest.
We try to spot the reversal, so always a bottom or support; and at this point we are bound to see growth, if we get it right of course.
PROVEUSDT is in this reversal point. We have the reversal pattern and the bullish breakout happening just now. If I decide to buy in, I just hold. Because we are already ready for growth.
Enjoy the numbers.
I am wishing you great profits and success on the long run.
Keep moving towards your goals.
Keep reading. Keep trading.
Thanks a lot for the support.
Namaste.
GOLD falls nearly $20, as Dollar recovers and market quietSummary: OANDA:XAUUSD fell sharply in Asian trading on Wednesday (August 27), after rising sharply in the previous session. Prices are currently trading around $3,374/oz, down nearly $20 on the day.
OANDA:XAUUSD is retreating from a two-week high near $3,400/oz after hitting that high on Wednesday morning. However, concerns about the Federal Reserve's autonomy and the latest U.S. tariff threats could ease the downward pressure on gold.
The US Dollar TVC:DXY rebounded on Wednesday, putting pressure on gold prices. However, the dollar's gains appeared to be limited by concerns about the Federal Reserve and tariffs.
OANDA:XAUUSD may be buying lower as investors look to buy on dips. Gold prices had earlier surged to a two-week high on Tuesday as US President Donald Trump announced the firing of Federal Reserve Governor Tim Cook, shaking investor confidence in the Fed's independence and boosting demand for safe havens.
Additionally, Bloomberg reported on Tuesday that U.S. President Trump has threatened to impose new tariffs and export restrictions on advanced technologies and semiconductors in retaliation for other countries imposing digital services taxes on U.S. tech companies. Trump’s recent trade brinkmanship has reignited tariff uncertainty among U.S. trading partners. Earlier this month, shortly after concluding negotiations with dozens of partners on tariffs targeting specific countries, Trump announced new tariffs on a range of imported products. Last week, he said he would impose new tariffs on imported furniture.
Technical Outlook Analysis OANDA:XAUUSD
Gold has yet to reach its upside target at the $3,400 base level, but has come under some pressure as it approaches this level and has declined in early trading today. Spot gold is currently trading at $3,376, close to the 0.236% Fibonacci retracement level. After breaking above the 0.236% Fibonacci retracement level, this Fibonacci level now acts as the closest technical support, below which gold could retest the 21-day EMA at around $3,350.
As mentioned to readers throughout the past publications, the overall trend of gold is still in a sideways accumulation phase. This is shown by the fact that RSI is hovering around 50, showing that the market sentiment is still hesitant in terms of momentum. When gold has enough conditions for a long-term trend, I will update readers quickly, but currently in the short term, gold has some technical factors supporting the possibility of price increases, with support at Fibonacci 0.236% and EMA21 and RSI above 50.
However, short-term open positions should still be prioritized during this period of sideways accumulation, along with the notable points that will be listed as follows.
Support: 3,371 – 3,350 USD
Resistance: 3,400 – 3,430 USD
SELL XAUUSD PRICE 3430 - 3428⚡️
↠↠ Stop Loss 3434
→Take Profit 1 3322
↨
→Take Profit 2 3316
BUY XAUUSD PRICE 3350 - 3352⚡️
↠↠ Stop Loss 3346
→Take Profit 1 3358
↨
→Take Profit 2 3364

How to Trade Morning Star and Evening Star Candlestick Patterns Learn to identify and trade Morning Star and Evening Star candlestick formations using TradingView’s charting tools in this detailed tutorial from Optimus Futures.
Morning and Evening Stars are powerful reversal patterns that often mark turning points in the market. Recognizing them can help you anticipate when momentum is about to shift—and take advantage of new trading opportunities.
What You’ll Learn:
• How Morning Stars signal bullish reversals at the end of a downtrend
• How Evening Stars indicate bearish reversals after extended uptrends
• The three-candle structure of each pattern and what it means for trader psychology
• Why indecision candles (like dojis) play a critical role in confirming momentum shifts
• Using volume confirmation to validate Morning and Evening Star setups
• The importance of context: spotting these patterns at major support and resistance levels
• Setting effective stop losses at the high/low of the pattern for risk control
• Advanced entry tactic: waiting for retracement after confirmation to optimize risk/reward
This tutorial may help futures traders and technical analysts who want to harness candlestick reversal signals to identify potential market turning points.
The strategies covered could assist you in creating structured setups when strong buying or selling pressure appears at key chart levels.
Learn more about futures trading with TradingView:
optimusfutures.com
Disclaimer:
There is a substantial risk of loss in futures trading. Past performance is not indicative of future results. Please trade only with risk capital. We are not responsible for any third-party links, comments, or content shared on TradingView. Any opinions, links, or messages posted by users on TradingView do not represent our views or recommendations. Please exercise your own judgment and due diligence when engaging with any external content or user commentary.
This video represents the opinion of Optimus Futures and is intended for educational purposes only. Chart interpretations are presented solely to illustrate objective technical concepts and should not be viewed as predictive of future market behavior. In our opinion, charts are analytical tools—not forecasting instruments. Market conditions are constantly evolving, and all trading decisions should be made independently, with careful consideration of individual risk tolerance and financial objective

BTC - Short Trade Update - Ready to PlummetWe secured the top entry around 117,000 - successfully snagging that top price.
Currently Bitcoin has fallen below this key trendline channel.
Adjusted trading path possibilities:
Scenario 1:
Short - 110,000 to 34,700-35,000
Long - 35,000 to 82,000
Short - 82,000 to 7,300-9,000
Scenario 2:
Short - 110,000 to 43,000
Long - 43,000 to 74,000
Short - 74,000 to 7,300-9,000
Scenario 3:
Short - 110,000 to 7,300-8,000
Suggestion:
Watch for interactions at these bounce levels, consider hedging with longs at those Long ranges (remain short for main position) on ETH (correspondence with BTC price timing).
Let’s see how this progresses.
All the best.

XRP Above Support · 5X Lev Trade-Numbers · Mid-Range (PP: 388%)XRP is trading above support. We can see EMA34 (green) being safe on the chart and not yet tested, a signal of strength. Our "support" range is also unmolested on the second drop. So far, support holds.
You know what we always say: "Sell at resistance, buy at support."
This looks like a good chart setup now but it can go wrong. You can have a good trade do bad, just like a bad decision can end up yielding good results. Our goal is to make the right decision all of the time and produce positive results more often than not.
At support, we have lower risk for a drop and higher chance for reversal. If we go deeper and look for other signals, we can wait for a stronger chart setup. Not all chart setups are the same.
Some trades have higher risk, others lower. Some trades move fast others slow. Some trades are a win; certainly, some other trades are a loss.
Our focus is not necessarily on winning once but on producing a positive outcome consistently. Can we achieve or goals? Can we reach success?
This chart setup is bullish but also a mix, prices have been dropping but again, we are looking at support.
Prices have been dropping since 18-July, more than a month. Why would a retrace go for longer? Is it necessary?
I don't know. XRP has been rising since November 2024 and is likely to resume going up. It will do so within hours or days. It will do so within weeks. You can decide to jump now or maybe later, there is no reward without risk.
Go ahead and take the plunge. We are ready for the bullish jump.
______
LONG XRPUSDT 5X (PP: 388%)
ENTRY: 2.73 - 2.95 (STOP: 2.65)
TARGETS: 3.08, 3.30, 3.46, 3.66, 4.02, 4.28, 4.59, 4.85, 5.17
______
You can notice some difference in the trade-numbers compared to previous posts. This is because we have different methods for extracting targets and it all depends on the goals and the timeframe. A daily chart setup will not give you the same targets as a weekly or monthly one.
Normally, I using the long-term targets for all ranges. These targets have been extracted with the mid-term range. But the move can cover a long space.
I am wishing you health, wealth, good luck, profits and success.
Namaste.

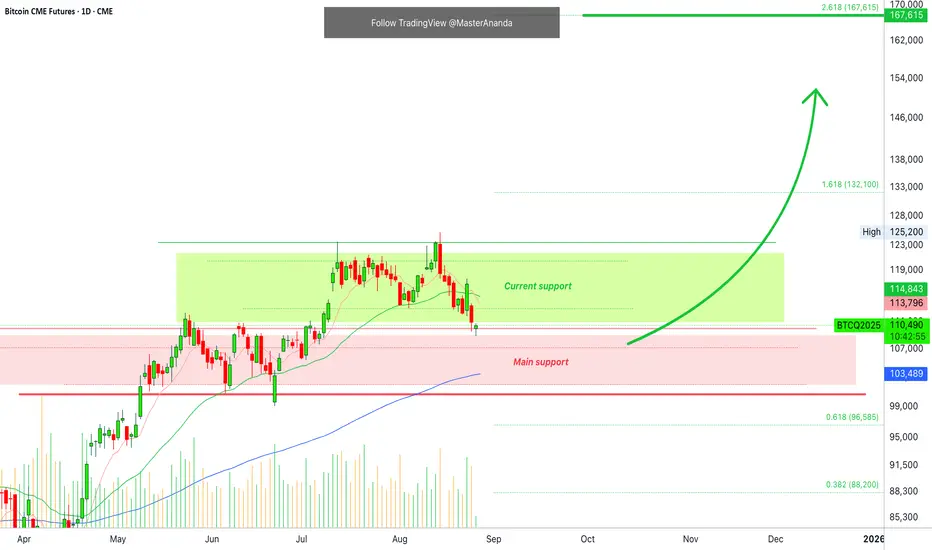
Bitcoin 8X LONG Chart Setup · 330% Profits PotentialWe have two support zones neatly depicted on the chart; green and red. Red is the main support zone, the range between $100,000 and $110,000, while green is the bullish zone support zone between $110,000 and $120,000.
BTC1! is trading within the bullish zone, above $110,000 after a strong monthly higher low, vs 22-June. Volume is standard for a continuation of the broader long-term bullish move. That is, even with short-term swings and price fluctuations Bitcoin is set to continue growing.
Because I believe firmly that Bitcoin will continue to grow, here I am showing you some numbers with mid-term goals.
The final target on this signal I believe is not the last target for the current run, but there is strong resistance at this level so we can always go out to comeback in, or adapt to your own liking since we are all adults.
I give you a great entry with great prices and timing, you take care of the rest. The market is here to bless us with growth, profits and success.
Full trade-numbers below:
______
LONG BTCUSDT 8X (PP: 330%)
ENTRY: $100,000 - $111,000 (STOP: $98,200)
TARGETS: $122,000, $137,000, $155,600
______
Thank you for reading.
Your support is highly appreciated.
Namaste.