BTC - Short Trade / Crash Update and DetailsPer my previous post here are the details on my personal trade. Note this is NOT financial advice, and this is my own personal trading plan only. Please use your own judgement.
Entry - 116,300 to 116,600
Stop Loss - 121,800
Target 1 - 95,700
Target 2 - 61,500
Target 3 - 35,000
Target 4 - 8,000
Note that Bitcoin should move up from the 35,000 target to 88,000 making a corrective wave on HTF.
At this point I will post an update and advise my own strategy and if I long 35,000 to 88,000.
Happy trading
Futures

GOLD spikes then falls rapidly, all conditions are bullishOANDA:XAUUSD prices surged after falling in the previous trading day, as Trump tariffs took effect and weak U.S. jobs data raised expectations of interest rate cuts, boosting safe-haven demand.
OANDA:XAUUSD prices reversed course on Thursday, posting sharp gains as the latest U.S. jobs data showed a weakening labor market. Investors, therefore, increased their dovish bets as the Federal Reserve is expected to resume its easing cycle in September.
The number of people filing for continuing unemployment benefits in the United States has hit a high not seen since November 2021, adding momentum to the Federal Reserve’s dovish stance. With inflation remaining high and the U.S. job market weak, the risk of stagflation has emerged.
Data released by the U.S. Labor Department on Thursday showed that continuing unemployment claims rose by 38,000 to 1.97 million in the week ended July 26. The high level suggests that it is increasingly difficult for unemployed people to find new jobs. Initial jobless claims also rose to 226,000 last week, exceeding economists’ expectations.
The data has bolstered market expectations for a Fed rate cut
Last week, weak U.S. nonfarm payrolls data boosted expectations for a rate cut.
According to data from Prime Market Terminal, traders see a 95% chance of a 25 basis point rate cut at the September meeting.
Meanwhile, higher tariffs imposed by U.S. President Donald Trump took effect on Thursday, providing a tailwind for gold, Valencia added. Countries affected include Switzerland, Brazil and India, which have yet to reach a deal with Washington.
Gold, a store of value in times of uncertainty, also tends to perform well in low-interest-rate environments.
Milan joins Fed, adding pressure on Powell to cut rates
US President Trump announced on Thursday that he will nominate Stephen Milan, currently chairman of the White House Council of Economic Advisers, to serve on the Federal Reserve Board, replacing Kugler, who unexpectedly resigned last week. The news also helped push gold prices higher on Thursday.
Trump said on social media Truth Social: "Stephen Milan will serve as the newly vacated seat on the Federal Reserve Board of Governors until January 31, 2026. He has been with me since my second term and his economic expertise is unmatched. He will do an outstanding job."
Technical Outlook Analysis OANDA:XAUUSD
Gold currently has all the bullish conditions, specifically the gold price broke above the 0.236% Fibonacci retracement level of $3,371 and tested the original price point, which is the target upside point of the $3,400 area.
The $3,371 level becomes the nearest support at present, while the Relative Strength Index (RSI) shows that there is still room for further upside ahead. As long as gold remains above the EMA21, it still has a bullish outlook in the short term.
There are hardly any factors that suggest that gold can fall significantly, so the general trend in the short and medium term is bullish and the notable points will be listed as follows.
Support: $3,371 - $3,350
Resistance: $3,400 - $3,430 - $3,450
SELL XAUUSD PRICE 3431 - 3429⚡️
↠↠ Stop Loss 3435
→Take Profit 1 3323
↨
→Take Profit 2 3317
BUY XAUUSD PRICE 3339 - 3341⚡️
↠↠ Stop Loss 3335
→Take Profit 1 3347
↨
→Take Profit 2 3353

Gold at All-Time Highs – Blow-Off or Breakdown?Gold has just printed new all-time highs, but I’m approaching with caution. At these levels, everyone long is in profit — leaving no trapped buyers above and only liquidity for smart money to grab.
We kicked off the session with an impulsive spike higher, but this may have been a stop run and liquidity sweep rather than the start of another leg up. If price struggles to hold above that spike or fails on a re-test, we could see sellers step in, targeting the 4H FVG zone below.
For now, I’m watching:
A possible revisit of yesterday’s high to “fix” lack of excess on the DOM
London session reaction to today’s spike high
Potential short setups if buy-side momentum stalls
NY session might deliver the day’s best move, but we could see early opportunities in the Asian and London sessions if price confirms a shift in order flow.
What do you think? Is this a blow-off top in the making, or do buyers have one more push?

EURUSD; Heikin Ashi Trade Idea📈 Hey Traders!
Here’s a fresh outlook from my trading desk. If you’ve been following me for a while, you already know my approach:
🧩 I trade Supply & Demand zones using Heikin Ashi chart on the 4H timeframe.
🧠 I keep it mechanical and clean — no messy charts, no guessing games.
❌ No trendlines, no fixed sessions, no patterns, no indicator overload.
❌ No overanalyzing market structure or imbalances.
❌ No scalping, and no need to be glued to the screen.
✅ I trade exclusively with limit orders, so it’s more of a set-and-forget style.
✅ This means more freedom, less screen time, and a focus on quality setups.
✅ Just a simplified, structured plan and a calm mindset.
💬 Let’s Talk:
💡Do you trade supply & demand too ?
💡What’s your go-to timeframe ?
💡Ever tried Heikin Ashi ?
📩 Got questions about my strategy or setup? Drop them below — ask me anything, I’m here to share.
Let’s grow together and keep it simple. 👊

SELL USOILOur 2nd trade if the day on USOIL is a short one again since the price kept grabbing BSL to continue pushing lower and lower.
You can sell and follow the same levels as mine
Follow for more!
UPDATE ON THIS MORNING'S TRADEEarly in the morning, I posted a trade (Sell USOIL) in which we trargeted the LQ level which the market came closer to and didn't touch, which isn't a big deal.
As you can see on the chart, as I told my students during the LIVE TRADING SESSION they assisted, it's all about trade management.
On the screenshot on the left, we added another order at 50% lvl of the FVG, xhich the market respected at that moment before giving us a double bottom which is a sign to the change of the movement of the market.
For a safe closure of the trade, as you can see in the picture on the left, we waited for the market to break through the 5min LQ we have to close, and that's what exactly happened.
We'll wait for another trade to take later in the US session.
Follow for more!

SELL USOILThis morning we're going short again on OIL, since as you can see the price grabbed the LQ and gave us a proper rntry point we entered based on 1h ago.
Follow for more!
OUR TRADE FOR THE DAYEarly today, I posted that we'll be waiting for the market to give us an entry after grabbing the liquidity, we did have it and caught it.
I didn't share it since it was given to my students.
As you can see on the chart, the market gave us a FVG after that it did grab the liquidity which we entered based on to target again the LQ level to close with a good margin.
Follow for more!
TRADE CANCELEDThis morning I posted to take a long trade and we canceled it since the price didn't come to our entry point which is a normal thing to happen, now after that it took the daily LQ, we'll be waiting for the price to give us a sort entry to take.
Follow for more!
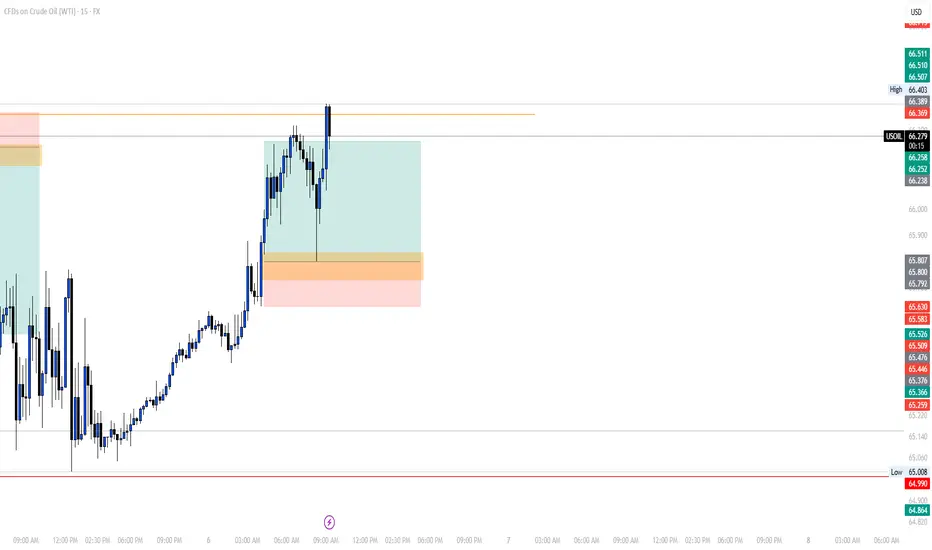
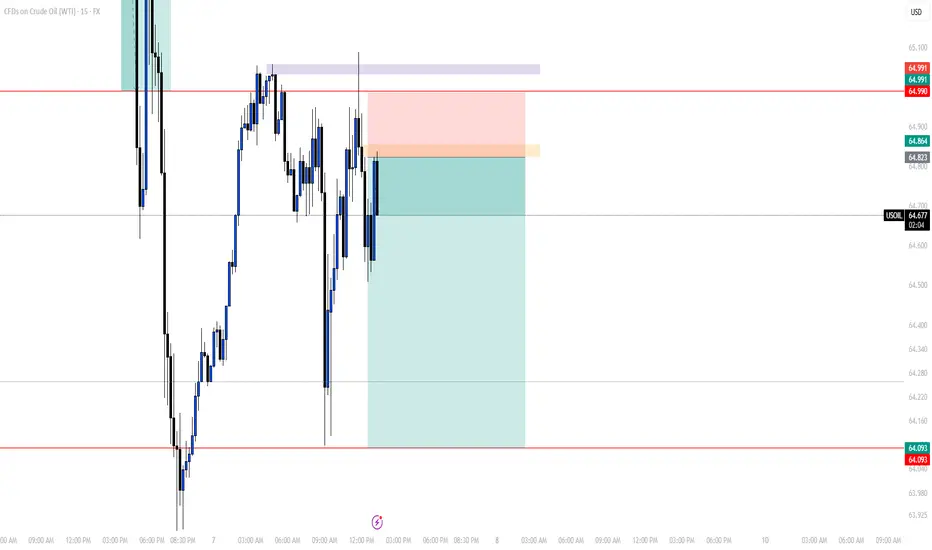
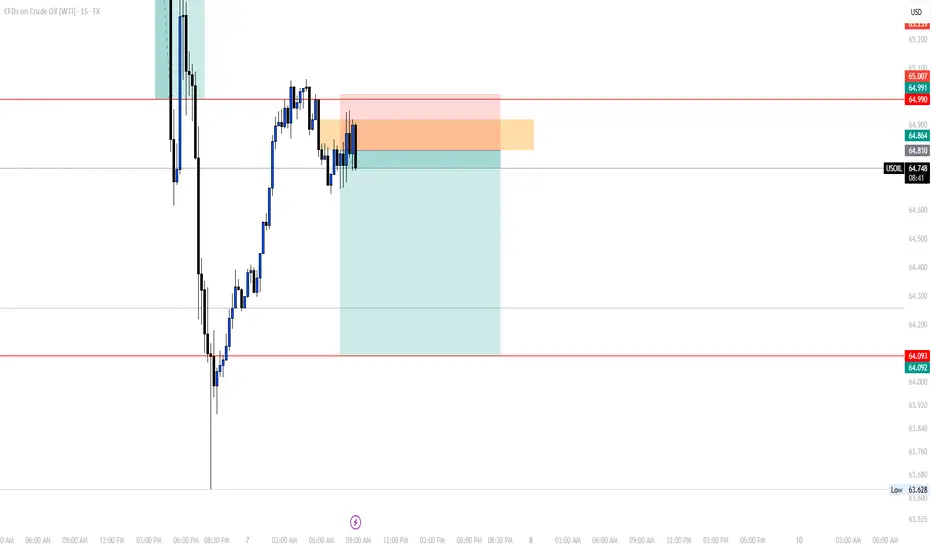
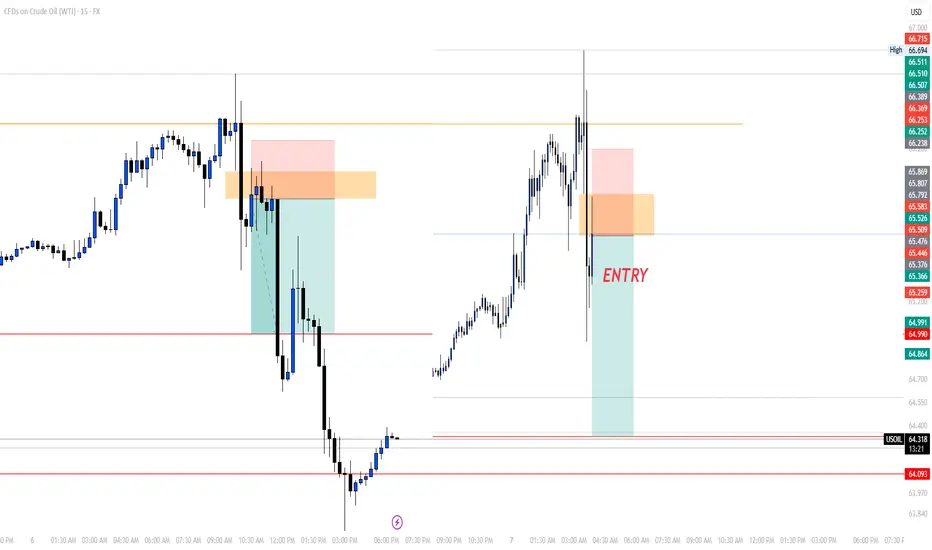
BUY USOILI'm sharing with you our trade today on OIL.
The reason we're buying is because yesterday the market grabbed the LQ now it is reversing to climb higher to fill all of the FVG we got in the previous movement.
For a safe entry, wait for the price to come back to our entry poin at 65.800 since I myself am waiting for the price to come to our entry point.
Follow for more!

GOLD trades in narrow range, leading market pulseThe current market pulse is still mainly revolving around the Trump-initiated tariff story, with spot OANDA:XAUUSD trading in a fairly narrow range and currently reported at $3,376/oz, down 0.13% on the day. Gold is also awaiting further impact from the Fed's interest rate cut, with a weaker Dollar providing support for non-yielding gold.
Tariff News Update
US President Donald Trump said on Tuesday (August 5) that US tariffs on imported semiconductors and pharmaceuticals will be announced “in about a week”. The progressive tariffs on imported pharmaceuticals could be as high as 250%.
US news agency Bloomberg News said the Trump administration is now preparing to target key economic sectors and pledge to reshape global trade.
“We’re going to start with a lower tariff on drugs, but within a year, not more than a year and a half, it’s going to be 150%, then 250% because we want drugs made in our country,” Trump said in an interview with CNBC on Tuesday. He did not specify what the initial tariff would be.
“We’re going to be announcing measures on semiconductors and chips, which is a different category,” Trump added. However, Trump did not provide further details.
The U.S. Commerce Department has been investigating the semiconductor market since April as it prepares for possible tariffs on an industry with estimated global sales of nearly $700 billion. The U.S. has imposed tariffs on imported cars, auto parts, as well as steel and aluminum under the Trump administration.
Tariffs on imported chips could significantly raise costs for major data center operators, including Microsoft Corp., OpenAI, Meta Platforms Inc. and Amazon.com Inc., which plan to spend billions of dollars on the advanced semiconductors needed to power their artificial intelligence businesses.
On the Fed’s interest-rate path
US job growth in July missed expectations, while nonfarm payrolls data for May and June were revised down significantly, with a combined loss of 258,000 jobs, suggesting a worsening labor market.
Furthermore, San Francisco Fed President Mary Daly said on Monday: "We may need more than two rate cuts, and more is likely." She also noted: "The labor market is not too weak, but it is weakening, and further weakening would be detrimental."
Surprising US labor market data and Daly’s dovish comments have all but confirmed the likelihood of a Fed rate cut in September. According to CME’s FedWatch tool, the market is now pricing in a 90% chance of a Fed rate cut in September.
OANDA:XAUUSD is often seen as a safe haven asset during times of political and economic uncertainty, and performs better in low-interest-rate environments.
Technical Outlook Analysis OANDA:XAUUSD
Gold is still trading in a fairly narrow range yesterday, but the price action is still mainly held above the EMA21 and it still has all the conditions for a possible increase. However, although the range is quite large, the overall situation is still showing a sideways accumulation trend.
Currently, gold is supported by the EMA21, followed by the short-term $3,310 level and the raw price point of $3,300. As long as it remains above the psychological $3,300 level, it is still eligible for a short-term bullish outlook.
Meanwhile, a break above $3,400 would open the door for a new short-term bullish cycle with the next target around $3,430 – $3,450.
On the momentum front, the RSI maintains its price action above 50 and is still far from the overbought zone (80 – 100) suggesting that there is still plenty of room for upside ahead.
During the day, in terms of technical position, gold has unchanged conditions that are inclined to increase in price, and the notable positions will be listed as follows.
Support: 3,350 – 3,340 – 3,310 USD
Resistance: 3,400 – 3,430 – 3,450 USD
SELL XAUUSD PRICE 3431 - 3429⚡️
↠↠ Stop Loss 3435
→Take Profit 1 3323
↨
→Take Profit 2 3317
BUY XAUUSD PRICE 3329 - 3331⚡️
↠↠ Stop Loss 3325
→Take Profit 1 3337
↨
→Take Profit 2 3343
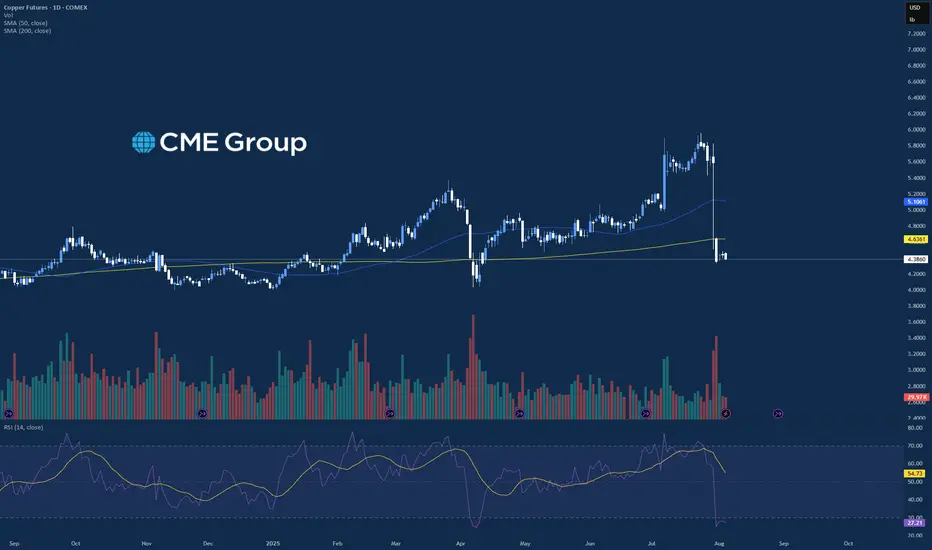
Strength in Precious Metals ContinuesThere was a good mix in price action across many asset classes on the day today where the precious metals traded higher led by the Silver market, which traded up near 1.3% on the day. There was a mixed set of data being released today with manufacturing data and PMI, and the S&P and Nasdaq finished the day lower. Over the past few weeks, there has been significant volatility in the precious metals looking at Gold, Silver, and Copper, and the last few trading days Gold and Silver have strung together a few positive days in a row. Both Gold and Silver have been trading at or near all time high prices and have been able to hold at these levels even with slight selling pressure.
Copper on the other hand has continued to struggle after the 50% tariff on all imports was announced last week, and the market has dropped from “overbought” to “oversold” levels on a daily basis in a matter of a few days. There will be a good amount of earnings coming out for the remainder of the week that could add additional volatility to the equity indices along with the precious metals to wrap up the week.
If you have futures in your trading portfolio, you can check out on CME Group data plans available that suit your trading needs tradingview.com/cme/
*CME Group futures are not suitable for all investors and involve the risk of loss. Copyright © 2023 CME Group Inc.
**All examples in this report are hypothetical interpretations of situations and are used for explanation purposes only. The views in this report reflect solely those of the author and not necessarily those of CME Group or its affiliated institutions. This report and the information herein should not be considered investment advice or the results of actual market experience.
ES THOUGHTSES is on the verge of retracing to its monthly 50% correction mark, so my bias is bearish. Price retrace up nicely, looking for shorts to go lower. simple, sweet and short.

US30; Heikin Ashi Trade Idea📈 Hey Traders!
Here’s a fresh outlook from my trading desk. If you’ve been following me for a while, you already know my approach:
🧩 I trade Supply & Demand zones using Heikin Ashi chart on the 4H timeframe.
🧠 I keep it mechanical and clean — no messy charts, no guessing games.
❌ No trendlines, no fixed sessions, no patterns, no indicator overload.
❌ No overanalyzing market structure or imbalances.
❌ No scalping, and no need to be glued to the screen.
✅ I trade exclusively with limit orders, so it’s more of a set-and-forget style.
✅ This means more freedom, less screen time, and a focus on quality setups.
✅ Just a simplified, structured plan and a calm mindset.
💬 Let’s Talk:
💡Do you trade supply & demand too ?
💡What’s your go-to timeframe ?
💡Ever tried Heikin Ashi ?
📩 Got questions about my strategy or setup? Drop them below — ask me anything, I’m here to share.
Let’s grow together and keep it simple. 👊

SELL USOILI'm sharing with you our trade for this morning on OIL, which we caught based on a reversal and the 2:25am (NY Time) FVG.
Follow for more!

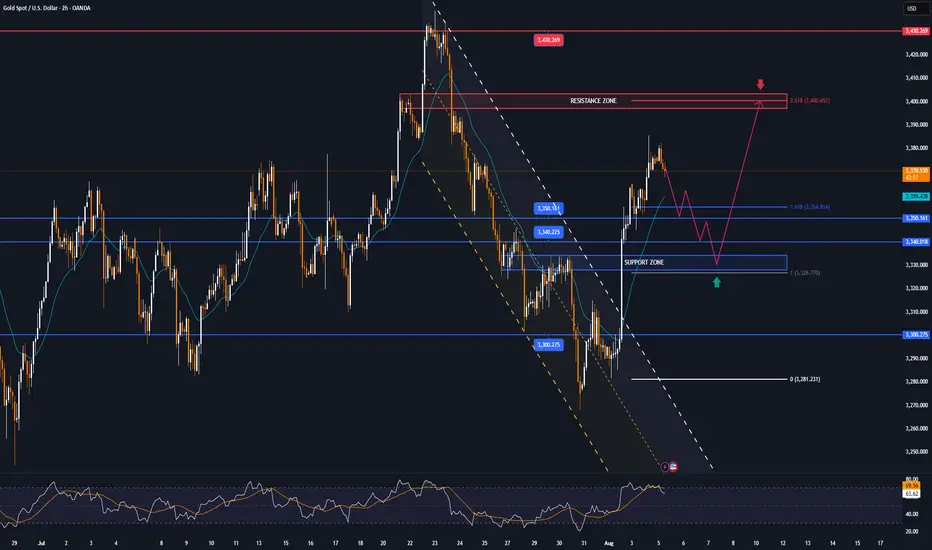
GOLD down slightly, watch today's data, technical conditionsOANDA:XAUUSD edged lower in Asian trading on Tuesday (August 5), currently trading around $3,380/ounce. On Tuesday, the US ISM services PMI will be released, which is the most important economic data of the week and is expected to impact the gold market.
OANDA:XAUUSD prices surged after weak jobs data increased the possibility of the Federal Reserve cutting interest rates.
Data released last Friday showed that the number of new jobs in the US non-farm sector in July was much lower than expected, and the total number of non-farm jobs in the first two months was revised down by 258,000, indicating a sharp deterioration in the labor market.
Traders now see an 87% chance of a rate cut in September, up from 63% last week, according to CME Group's FedWatch tool. Expectations of a rate cut have boosted gold prices, as the dollar provides support for the precious metal.
The US ISM non-manufacturing purchasing managers index (PMI) for July will be released today (Tuesday) and is expected to be 51.5, up from 50.8 previously.
The July ISM services PMI could impact the US dollar and gold, depending on whether it is biased towards supporting a rate cut or pausing rate cuts for an extended period.
Gold itself does not generate interest, but generally performs well in low-interest-rate environments and is seen as an inflation hedge.
On the trade front
Today (August 5), US President Donald Trump threatened to raise tariffs on Indian goods in protest at India's purchase of Russian oil. New Delhi called Trump's attack "absurd" and pledged to protect its economic interests, deepening the trade rift between the two countries.
Trump posted on the social media platform Truth Social: "India not only buys massive amounts of Russian oil, but also sells much of it on the open market at a huge profit. They don't care how many people are being killed in Ukraine by the Russian war machine."
Trump added: "Accordingly, I will be substantially increasing the tariffs that India pays to the United States."
However, Trump did not specify the specific tariff amount.
Responding to Trump's remarks, an Indian foreign ministry spokesperson said on Monday that India would "take all necessary measures to protect its national interests and economic security." The spokesperson added: "These actions against India are unjustified and unjustifiable."
Over the weekend, Reuters reported that India would continue to buy oil from Russia despite Trump’s threats.
In July, Trump announced that he would impose a 25% tariff on imports from India, and US officials have also pointed to a range of geopolitical issues as holding up the signing of a US-India trade deal.
Trump has also described the BRICS group as generally hostile to the US. Those countries have rejected Trump’s accusations, saying the group protects the interests of its members and the developing world as a whole.
Technical Outlook Analysis OANDA:XAUUSD
On the daily chart, although gold has been very volatile in recent times, it is still moving sideways, with price action clinging to the EMA21. And after a strong recovery in the past three trading sessions, gold is temporarily limited by the 0.236% Fibonacci retracement level, which was the bullish target that readers paid attention to earlier. The return above the EMA21 provides gold with initial conditions for bullish expectations, but a new trend has not yet formed.
If gold takes its price action above the 0.236% Fibonacci retracement level and stabilizes above it, it will have room to continue rising with the next target being the raw price point of $3,400 rather than the $3,430-$3,450 target. But at its current position, it still has no clear trend either up or down.
Meanwhile, once gold sells below the 0.382% Fibonacci retracement level, it could continue to decline with a target of $3,246 in the short term, which also means that the $3,300 – $3,292 area is the current key support area.
Momentum-wise, the Relative Strength Index (RSI) is also hovering around 50 with little fluctuation, indicating a hesitant sentiment in the market without leaning to either side.
For the day, the technical outlook for gold is a sideways consolidation but the technical conditions are slightly more bullish, and the notable positions are listed as follows.
Support: $3,350 – $3,340 – $3,300
Resistance: $3,400 – $3,430
SELL XAUUSD PRICE 3402 - 3400⚡️
↠↠ Stop Loss 3406
→Take Profit 1 3394
↨
→Take Profit 2 3388
BUY XAUUSD PRICE 3329 - 3331⚡️
↠↠ Stop Loss 3325
→Take Profit 1 3337
↨
→Take Profit 2 3343
After data shock, GOLD has bullish conditions againOANDA:XAUUSD rose more than 2% on Friday, hitting a one-week high, as weaker-than-expected U.S. non-farm payrolls data boosted hopes of a Federal Reserve rate cut and the announcement of new tariffs boosted safe-haven demand.
On the economic data front
Gold prices rose more than 2% in U.S. trading on Friday (Aug. 1), hitting a one-week high, as weaker-than-expected U.S. non-farm payrolls data fueled hopes of a Federal Reserve rate cut and safe-haven demand was boosted by the announcement of new tariffs.
The U.S. Department of Labor's Bureau of Labor Statistics reported that nonfarm payrolls increased by just 73,000 jobs in July, well below market expectations of 110,000. June's data was revised down to just 14,000, indicating a significant slowdown in job growth. The unemployment rate rose to 4.2%, indicating a cooling labor market.
The jobs data was weaker than expected, but slightly higher than the market's lowest forecast. This increases the likelihood of a rate cut by the Fed later this year. As a non-yielding asset, gold typically performs better in a low-interest-rate environment.
According to CME Group's FedWatch tool, market participants now expect the Federal Reserve to cut rates twice before the end of the year, starting in September. Earlier this week, the Fed held rates steady at 4.25%-4.50%. Chairman Powell said it was too early to determine whether a rate cut would be forthcoming in September, citing inflation and employment data.
On the trade front
Trump has imposed a new round of tariffs on exports from dozens of trading partners, including Canada, Brazil, India and Taiwan, causing a global market crash.
Countries are scrambling to negotiate a better deal. In times of economic and geopolitical uncertainty, safe-haven gold is in high demand.
So far in 2025, gold prices have risen more than $400, hitting a record high of $3,167.57/oz on April 3, driven by safe-haven demand and central bank buying.
Weak jobs data also sent the dollar lower against major currencies, further supporting gold prices as a weaker greenback makes gold more attractive to investors holding other currencies.
Investors' Attention Turns to September FOMC Meeting
Markets are now focused on the September Federal Open Market Committee (FOMC) meeting. Facing the dual pressures of volatile inflation, slowing employment and escalating global trade tensions, the Fed will have to balance its inflation target with economic growth.
Markets are betting on the Fed to begin a new round of easing, and gold, as a hedge against currency devaluation and economic uncertainty, is expected to continue to benefit.
Gold prices have risen more than 30% year-to-date, reflecting the market’s preference for safe-haven assets. If weak U.S. economic data continues in the coming weeks, or if new geopolitical conflicts emerge, gold prices are expected to continue their upward trend, challenging new highs for the year.
Summary, Commentary
Weak employment, new tariffs and a slumping stock market have all contributed to a strong recovery in gold prices. With the possibility of the US Federal Reserve cutting interest rates in September increasing significantly, gold market sentiment has warmed and risk aversion has returned.
Investors will need to keep a close eye on inflation data, Fed officials’ speeches, and whether Trump continues to stoke trade tensions, which could lead to greater volatility in the gold market.
Against the backdrop of the unexpected non-farm payrolls report and moderate inflation, the market has essentially “locked in” the possibility of a rate cut in September, but whether the cut will be 25 or 50 basis points, and whether there will be further rate cuts in the future, will depend on the interaction between the Fed members’ verbal guidance and market expectations.
Technical Outlook Analysis OANDA:XAUUSD
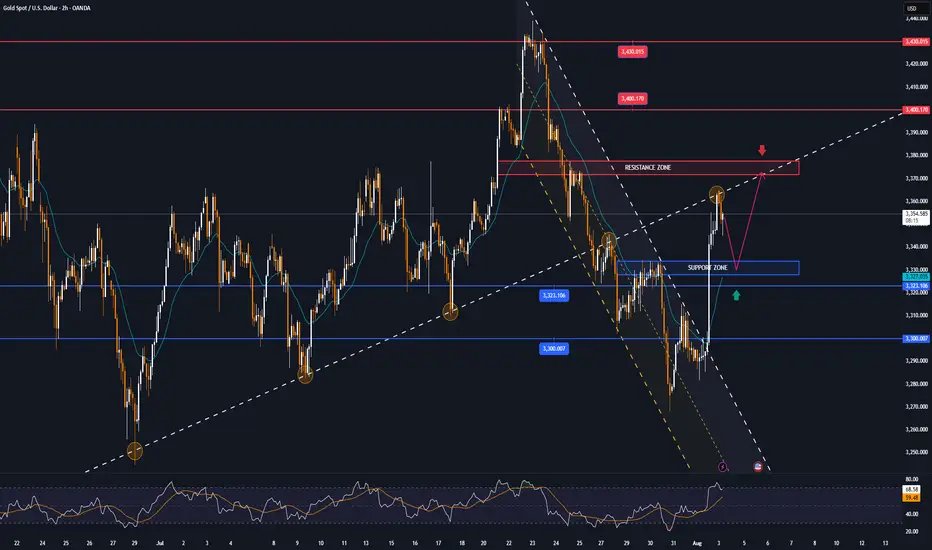
On the daily chart, affected by the sudden weak data that shocked the market, gold broke most of the technical structure that was leaning towards the downside. Price action was pushed above the EMA21, while the short-term downtrend channel was also broken above and the Relative Strength Index crossed above 50.
These are the initial conditions for a short-term uptrend. But to confirm an uptrend and a new uptrend in the near term, gold needs to continue to break above the 0.236% Fibonacci retracement level (3,371 USD) first, then the target will be around 3,400 USD in the short term.
If gold breaks above $3,400 again, traders should set a new target of $3,430 in the short term, rather than $3,450 which is the all-time high.
Motivationally, the RSI has not reached oversold territory to provide pure reversal support, but it has been pushed by the market shock after the NFP data release, so this rally may not be sustainable in a purely motivational way either.
Overall, gold is now more bullish after a rally on Friday, opening up initial conditions for expectations of a new uptrend. And the notable points will be listed as follows.
Support: 3,323 – 3,310 – 3,300 USD
Resistance: 3,371 – 3,400 – 3,430 USD
SELL XAUUSD PRICE 3376 - 3374⚡️
↠↠ Stop Loss 3380
→Take Profit 1 3368
↨
→Take Profit 2 3362
BUY XAUUSD PRICE 3327 - 3329⚡️
↠↠ Stop Loss 3323
→Take Profit 1 3335
↨
→Take Profit 2 3341
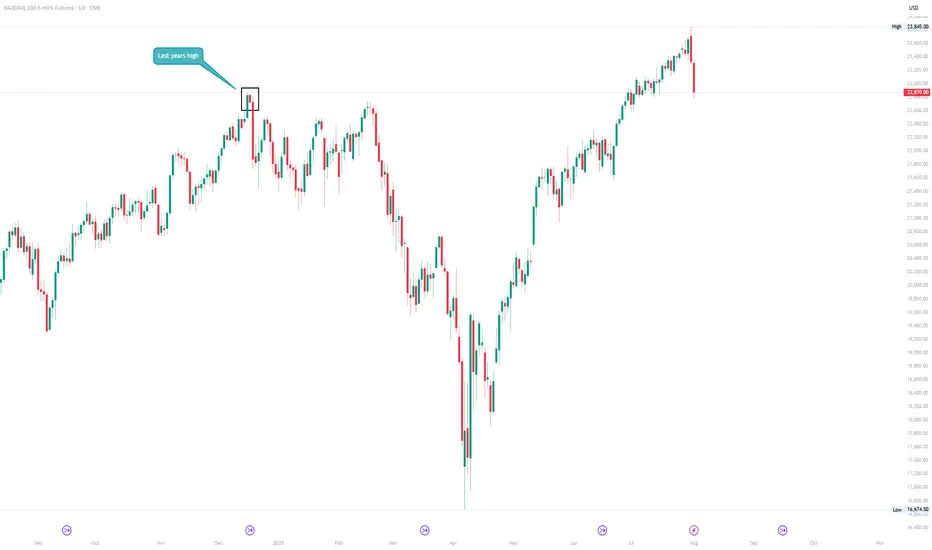
E-Mini Nasdaq Futures Markets Close at a Major Inflection PointAs the new month begins, the market just closed right at last year’s high, a critical level that could act as either resistance or new support.
These return-to-origin zones aren’t random. They often mark key decision points for institutional capital.
The question now:
Does this level hold as a launchpad, or does it reject?
What to watch :
VIX curve: contango or hedging pressure?
Bond market: confirming risk-on or signaling caution?
Breadth: is this rally broadening or narrowing?
No need to predict. Let price and flow do the talking.
See you on the inside. CME_MINI:NQ1!
NQ | NASDAQ - Weekly Recap & Gameplan - 03/08/25📈 Market Context:
The market is pricing in a potential 0.25% rate cut in the September FOMC meeting, keeping the overall structure bullish.
Although we saw a retracement after the Non-Farm Employment Change came in weaker than expected, bullish sentiment remains intact.
Currently, market sentiment has shifted to neutral from last week’s greed. Augusts are often choppy and prone to retracement/accumulation, but structurally, bulls still hold the upper hand.
🧾 Weekly Recap:
• NQ started the week strong with price discovery, pushing higher from Monday to Thursday.
• Eventually, price ran a key 4H swing liquidity, which led to another all-time high.
• That move was followed by the start of a healthy retracement, signaling short-term distribution.
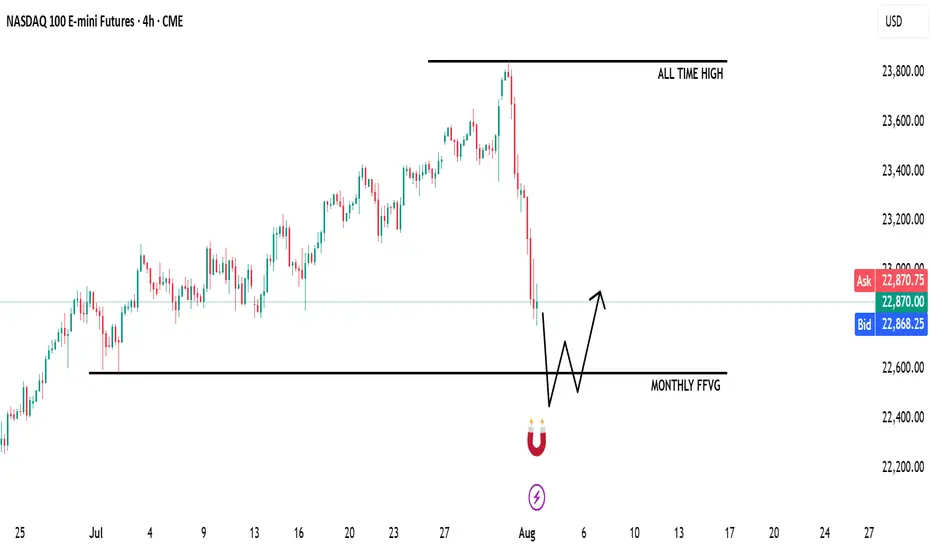
📌 Technical Outlook & Game Plan:
→ I'm expecting price to run into the Monthly Fair Value Gap — a major liquidity magnet in my model.
→ That move could generate significant bullish energy — at least a short-term bounce, if not a full reversal.
→ Until then, I remain bearish targeting 22,583 (my marked black line).
🎯 Setup Trigger:
After price takes 22,583, I’ll watch for:
• 4H–1H break of structure (BOS)
• Formation of fresh demand zones
→ Upon LTF confirmation, I’ll look to go long aiming for another test of all-time highs.
📋 Trade Management:
• Stoploss: Below the 1H–4H demand zone
• Target: Trailing stop strategy; aggressive profit-taking on the way up
• Note: Final target could be all-time highs, but I’ll manage the position actively
💬 Like, follow, and comment if this outlook adds value to your trading. Educational content and more setups are coming soon — stay tuned!
SAHARA ANALYSIS🔮 #SAHARA Analysis 💰💰
📊 #SAHARA is making perfect and huge rounding bottom pattern in daily time frame, indicating a potential bullish move. If #SAHARA retests little bit and breakout the pattern with high volume then we will get a bullish move📈
🔖 Current Price: $0.1043
⏳ Target Price: $0.1062 and above
⁉️ What to do?
- We have marked crucial levels in the chart . We can trade according to the chart and make some profits. 🚀💸
#SAHARA #Cryptocurrency #Pump #DYOR

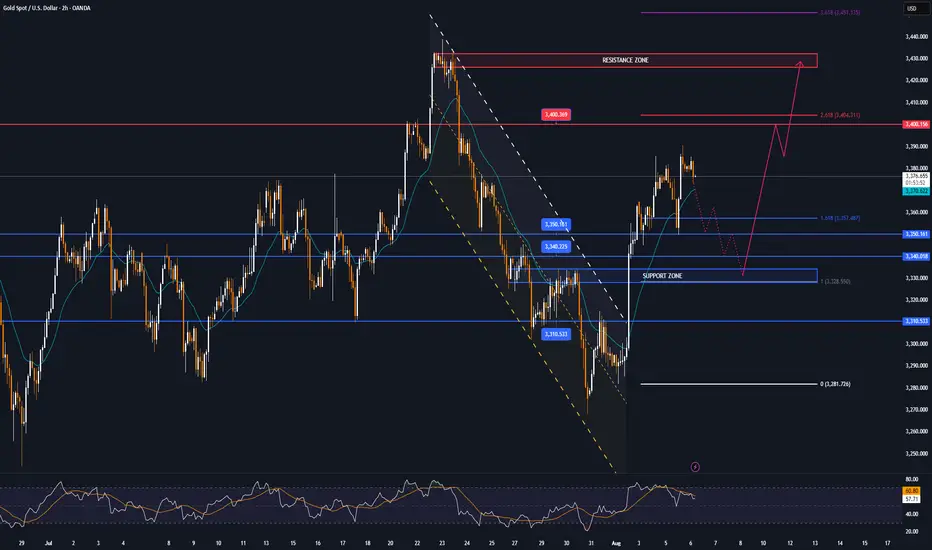
GOLD MARKET ANALYSIS AND COMMENTARY - [Aug 04 - Aug 08]This week, the price of OANDA:XAUUSD fell sharply from $3,345/oz to $3,268/oz after the FED Chairman said that the FED has no plans to cut interest rates at the upcoming September meeting. However, at the end of the week, the US Bureau of Labor Statistics announced that the number of non-farm jobs (NFP) in the US reached only 73,000 jobs in July, much lower than the forecast, and the unemployment rate increased higher, up to 4.2%. This pushed the price of gold up sharply from $3,281/oz to $3,363/oz.
The weak labor market has significantly changed expectations for the Fed's interest rate.
With a relatively light economic data calendar next week, investors will continue to monitor Friday's jobless claims report. Meanwhile, some analysts predict that the risk of global economic uncertainty after President Donald Trump announced new tariffs will continue to boost safe-haven demand for gold.
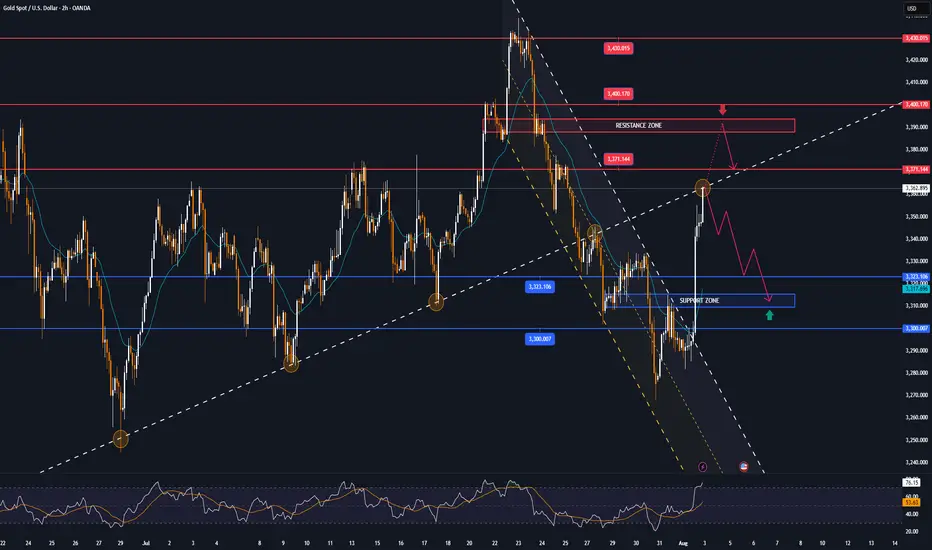
📌Technically, the resistance level for gold next week will be the round resistance of 3,400 USD/oz, followed by 3,440 USD/oz. Meanwhile, the support level is around 3,268 USD/oz.
Perspective on the H4 chart, gold is currently in a corrective recovery cycle testing the Trendline, it is likely that early next week there will be an increase around 3375 and then a correction decrease again.
Notable technical levels are listed below.
Support: 3,323 – 3,310 – 3,300USD
Resistance: 3,371 – 3,400 – 3,430USD
SELL XAUUSD PRICE 3394 - 3392⚡️
↠↠ Stop Loss 3398
BUY XAUUSD PRICE 3310 - 3312⚡️
↠↠ Stop Loss 3306
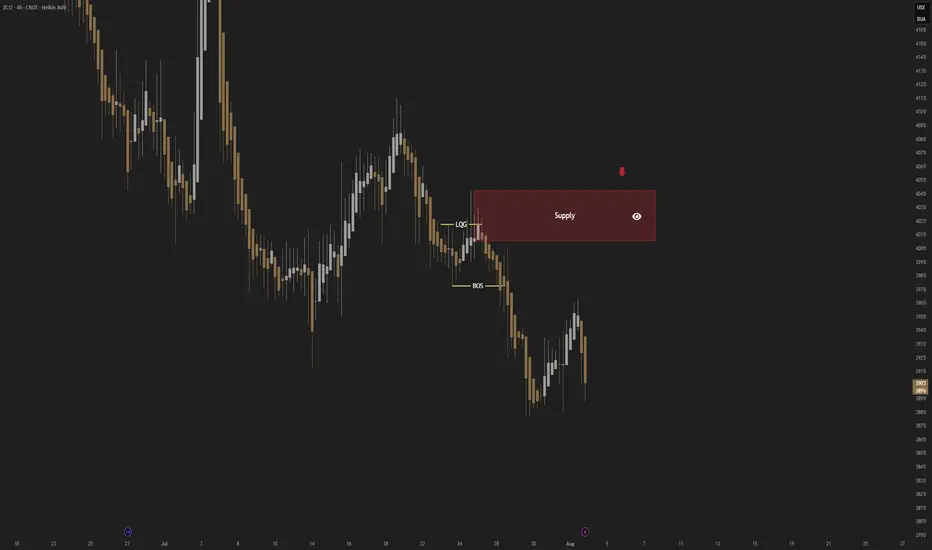
CORN; Heikin Ashi Trade Idea📈 Hey Traders!
Here’s a fresh outlook from my trading desk. If you’ve been following me for a while, you already know my approach:
🧩 I trade Supply & Demand zones using Heikin Ashi chart on the 4H timeframe.
🧠 I keep it mechanical and clean — no messy charts, no guessing games.
❌ No trendlines, no fixed sessions, no patterns, no indicator overload.
❌ No overanalyzing market structure or imbalances.
❌ No scalping, and no need to be glued to the screen.
✅ I trade exclusively with limit orders, so it’s more of a set-and-forget style.
✅ This means more freedom, less screen time, and a focus on quality setups.
✅ Just a simplified, structured plan and a calm mindset.
💬 Let’s Talk:
💡Do you trade supply & demand too ?
💡What’s your go-to timeframe ?
💡Ever tried Heikin Ashi ?
📩 Got questions about my strategy or setup? Drop them below — ask me anything, I’m here to share.
Let’s grow together and keep it simple. 👊
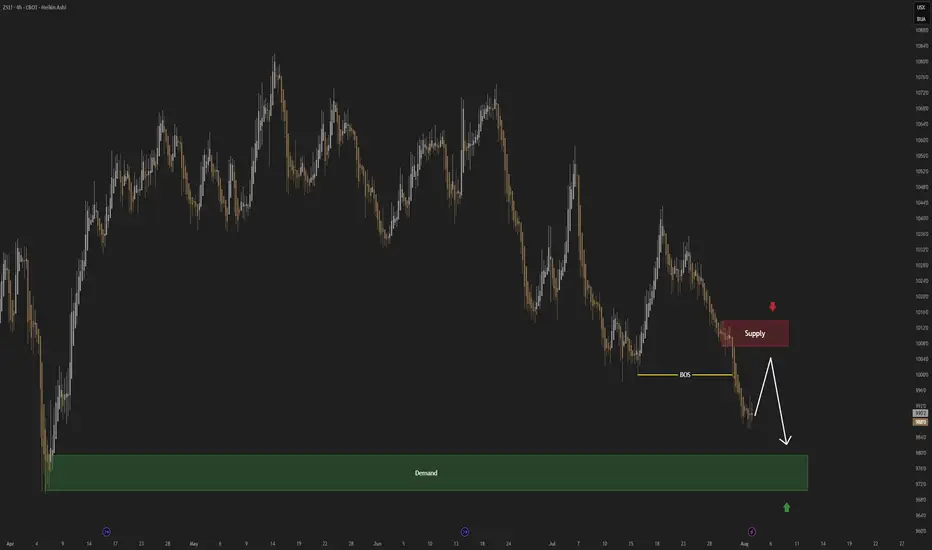
SOYBEAN; Heikin Ashi Trade Idea📈 Hey Traders!
Here’s a fresh outlook from my trading desk. If you’ve been following me for a while, you already know my approach:
🧩 I trade Supply & Demand zones using Heikin Ashi chart on the 4H timeframe.
🧠 I keep it mechanical and clean — no messy charts, no guessing games.
❌ No trendlines, no fixed sessions, no patterns, no indicator overload.
❌ No overanalyzing market structure or imbalances.
❌ No scalping, and no need to be glued to the screen.
✅ I trade exclusively with limit orders, so it’s more of a set-and-forget style.
✅ This means more freedom, less screen time, and a focus on quality setups.
✅ Just a simplified, structured plan and a calm mindset.
💬 Let’s Talk:
💡Do you trade supply & demand too ?
💡What’s your go-to timeframe ?
💡Ever tried Heikin Ashi ?
📩 Got questions about my strategy or setup? Drop them below — ask me anything, I’m here to share.
Let’s grow together and keep it simple. 👊