Natural Gas Futures (Road Map)!!!🗺️What are Natural Gas Futures ❗️❓
Natural Gas Futures can be used for hedging or speculating and can be traded nearly 24 hours per day, 6 days per week. Trading Natural Gas Futures allows hedgers to manage risk within the highly volatile natural gas price, which is driven by weather-related demand.
Natural Gas Futures is running in Heavy Resistance Zone & Important Trendlin & Resistance Line, and at the same time, it was able to pass the main wave 5 in this zone. So I expect Natural Gas Futures to go down to my🎯targets🎯 that I showed in my chart.
Where can Natural Gas Futures go (🎯Targets🎯)❗️❓
Target🎯: 4.67$-4.55$
Target🎯: 2.98$-2.84$
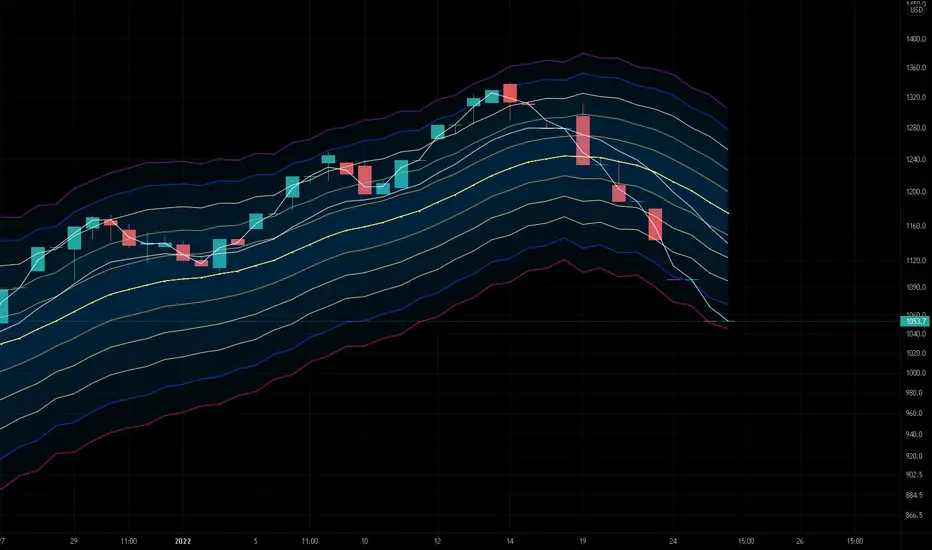
Natural Gas Futures Analyze, Monthly Timeframe (Logscale).
Also, we can see one of the valid candlestick reversal patterns (💫Shooting Star💫) at a weekly timeframe 👇
Do not forget to put Stop loss for your positions (For every position you want to open).
Please follow your strategy, this is just my idea, and I will be glad to see your ideas in this post.
Please do not forget the ✅' like '✅ button 🙏😊 & Share it with your friends; thanks, and Trade safe.
Futuresmarket

S&P Futures Surprise!We have watched Futures price unable to climb above resistance at 4002.
Today buyers gave strong indication that they were not ready to let price reject and drop form here. Closing the day with strength above 4000.
What can we expect next?
Next target for Futures is 4090 and 4132
If price is able to build above resistance near 4090-4132 we might see a push to 4199 without breaking the Macro Bear structure.

Nasdaq support levelslooking at my preditcion, nasdaq will be bullish, going forward will be a big jump in prices like youve never seen before

Nasdaq NQ hovering @wma200/mma50/June low zone;Diamond again?Nasdaq, si,liar to SPY has made 2 diamond patterns in May & June leading to a reversal with positive Rsi divergence.
Could it be repeating similar set-up this Sept-Oct?
It is currently hovering around the mma50+wma200+June low zone. Sometimes prices break a little below the diamond pattern first eating away the cut-losses before a reversal. If NQ makes another new low after Thursday’s economics data, it will be bad news.
Not trading advice

HERO MOTOCORP FUTURES Rising Wedge Pattern Breakdown. *HERO MOTOCORP FUTURES*
Time Frame: Daily
Observation:
* Rising Wedge Pattern Breakdown on daily time frame.
Support/Target: 2439 2154
Resistance: 2817 2949

TATA STEEL FUTURES Breakdown on Daily Time Frame. *TATA STEEL FUTURES*
Time Frame: Daily
Observation:
* Triangle Breakdown on Daily time frame.
* Significant Support Breakdown on Daily time frame.
Support/Target: 92 82.75
Resistance:111

ZW DAILY.Hello everyone, there is a High potential for a bullish tend, the market has a big probability to break the level 825'6
the market may go to retest the level 868'0 with an engulfing candle, then continue up.
FIRST TARGET IS 494'4, Second target is 1047'6.

6E1! Futures Ideas for the next daysSome ideas of possible operations on Future FX 6E for the next few days. I intend to apply them as intraday hedging positions, as an alternative to my usual scalping.
Specifically, before carrying out my possible operations, I will need to have volumetric confirmation and volatility indications that reflect the previous conditions to determine a real interest in those price areas
Let's see how the situation will evolve.
Please do not take any of these ideas as a possible operational invitation.
These are personal impressions, and do not want to give rise to any kind of investment

LUNA/USDT by CryptoTradersWWThe major issue is how low this can go and whether it can rebound from such a massive sell-off. I've seen some massive drops in Crypto, and Luna is up there with the most memorable. Is it approaching zero? Nobody is aware. Technical levels are one thing we may look at. The price is currently hovering around the Weekly level set about a year ago. This occurred when the UST coin was subjected to FUD, which resulted in a drop a year ago. The dump was not as big as it is now. There isn't much support below the weekly level till beneath $1, according to the market structure.
The Terra Foundation is also expected to release a rescue plan soon, which will add to the uncertainty. It's nearly impossible to catch the bottom of a plunge like this; patience is key, and risk management should be prioritized. This dump can be seen in two ways. Trying to catch the lows can either pay out handsomely, or you will lose 99 percent of your money.
<---------------------------->
☑️ Follow, Comment & Like
☑️ Create a civil and healty discuss in the comments and share with me your thoughts
Thanks and Happy Trading!

BTC/USDT by CryptoTradersWWBTC/USDT
Looking at the BTC chart on the hourly timeframe price lost the $39K support which held throughout the weekend and has been retested and is now acting as resistance. The key level to watch if we gt there is $37K this is where I believe the bulls will likely become very interested. If we see $39K reclaimed then we could get a push higher from there. These are the two levels I am paying attention to today

XRP/USD - Update🎯 Target 1 Hit on XRP/USD!
Signals has been shared for free a week ago and now its running at
+9.5% profit ( calculated without leverange ).
Feel free to move up your StopLoss or take some profits!

XRP/USD by CryptoTradersWWOn the lower timeframes, price has been in a bullish market structure for a few days now (higher lows and higher highs, with price challenging this multi-month resistance once more. If price can break through barrier with volume, we can expect higher prices.
For our entry, we'd like to see $0.82 turn into support and 4-hour and daily closes rise above it.
On the chart, I've highlighted a few potential profit targets that I'd like to hit if we get an entry: $ 0.88, $0.91, and $1.00.
My stop loss will be triggered if the price falls back below the trendline after a breakout above it. I'll close the trade after this confirms a fake-out.
<---------------------------->
☑️ Follow, Comment & Like
☑️ Create a civil and healty discuss in the comments and share with me your thoughts
Thanks and Happy Trading!

Luna Can Go a Little Higher 30MinDay Trading Futures - Luna Trade Set Up
Entry: 86.52- 87.18
Take Profit 1 - 88.33
Take profit 2- 88.84
Take Profit 3- 89.67
Take Profit 4- 90.00
Leverage - 20x
Stop Loss- 85.20

BTC/USD - UpdateI'm still waiting for BTC to make a decision on which way to go between these two daily levels.
We are more likely to hit the lower daily level because we have witnessed repeated rejections around the upper daily level and we have bearish CVD divergence. If we see a correction to the downside, we could see a bounce at about $39K.
Following that, we must observe order flow in order to evaluate whether the price is likely to hold or not.
<---------------------------->
☑️ Follow, Comment & Like
☑️ Create a civil and healty discuss in the comments and share with me your thoughts
Thanks and Happy Trading!

Lumber Long Scalp SoonHey lumber has been taking a nice dump for the last few weeks, waiting for some momentum.
/ES Better Hold This LineThe /ES better hold this important trendline, of it could go down to 4440. Companies voluntarily stop buying back their stock 35 days prior to earnings. That does not mean markets automatically go down. It means that bearish patterns are MORE LIKELY to work.

MNQ futures short After a strong bullish day MNQ is in need of consolidation as it runs up into previous resistance. Cycling into contracts in the short zone between 16,390 and 16,455 with a stop at 16,460. Taking profit at the .236 & .382 fib

Double Bottom at DYDX 💰Analyzing DYDX we are starting to see volume kicking in right now. Looking very very nice for DYDX to start breaking that $18.
As soon as we break through the resistance this will be a major support.
In my opinion it's very likely that we will be hitting ATH in the next few weeks, but the first target would be around $22.
Keep your trading simple guys, have exit targets, protect your positions ...

SAND Approaching to Buying ZoneIf we do come all the way down to the buying points of the Fibonacci retracement I wouldn't even think of buying SAND.
0.5 Is a very good entry level and 0.62 golden pocket even better. I am looking forward to start accumulating from these points because the run up all the way to the ATH is very very large.
Due to the insane support we won't be breaking below the 2 dollar level making these even a better opportunity for futures or even spot market.
Be patient and wait until we see thee levels.

GOLD Perpetual Futures Contract Breaks Daily High and MoreThe GOLD perpetual futures contract just made a new daily high, which exceeds the daily highs of the last several days prior. Chart displayed shows daily low and high, range of highs and lows for past days, trend using last 3 pivots, money flow, volume accumulation percentage indicator, and bull/bear power.
Day traders may wish to look for an opportunity to short this as it may correct while longer term traders could interpret this as a long term uptrend.

How to trade any Market, Like the institutionsMy 11 years of experience just been simplified into a 20 minutes video. There's no difference between normal supermarket and futures market. They all work around a fair value. if you wanna learn more, let me know in the comment

SP500 TREND ANALYSISThe price confirmed de down turn crossing EMAs and didn't break up the angle red lineand the 0.38 fibonacci level the RSI is weak with 38.85 points and the pattern is convergent with the trend.

Long ES with uptrendTrend is up on the Daily chart and we are looking for entry below the Previous High.
Drumming down to the 4 hour chart it is evident there has been an accumulation close to the pivot before the impulsive move (big green candles).
Looking to buy at the BUY AREA with my Stop Loss set below the prior impulsive green 4 hour candle should the buy area fail. If it does there may be more opportunities closer to the swing low.
The only concern is that price is very close to the area at the time of writing and may not get the trade volume needed for movement out of the Buy Area.
