Gold near $5,000 — this is where bull markets turn parabolic🚨 As we are closing in 5,000 USD in gold prices, the bull market is entering its parabolic stage. Let’s review the current bull market stats + historic bull markets in more detail. Let’s go.
________________________________________
✅ Executive Summary — Top 10 Key Takeaways
1.🟡 Gold just printed a new ATH: $4,887.82/oz (Jan 21, 2026) and is hovering around $4,885.
2.🧠 From the 2016 low (~$1,080) to today: ~+352% (≈ 4.5×).
3.🎯 $5,000 is the magnet level: Reuters notes traders are watching/holding for the $5,000 psychological threshold.
4.🏦 This cycle’s signature: central banks remain the anchor buyer — 1,045t added in 2024 (3rd straight 1,000t+ year).
5.💧 ETFs are back: physically backed gold ETFs saw record-setting demand bursts
6.🧨 The 2026 catalyst (right now): fresh safe-haven demand tied to elevated geopolitical/trade stress.
7.🧱 Structure matters: the multi-year base/breakout thesis (2024) has evolved into an “ATH staircase” into 2026.
8.🥈 Silver is also in a historic move: it hit an all-time high around $95.87
9.📊 Relative performance: S&P 500 finished 2025 up ~16.39%, while gold’s 2025 run was widely described as exceptional
10.🔥 Upside framing is now mainstream: some strategists explicitly model paths to $7,500/oz in 2026
________________________________________
🔥 What’s Different About This Bull Market 2026
•🏦 Central-bank dominance is the backbone
•💸 ETF flows returned in size, adding a powerful Western liquidity bid.
•📉 Rates/real-yield expectations still matter, but now gold also trades as a trust/sovereign-risk hedge during political and trade shocks.
________________________________________
🏆 Historic Gold Bull Markets — Timeline & Stats
1) 1968–1980 “Super Bull”
•Start/End: ~$35 → $850
•Gain: ~2,330%
•Drivers: End of Bretton Woods, oil shocks, double-digit inflation, geopolitics
•Drawdown: ~–45% before the final blow-off run
2) 1999–2011/12
•Start/Peak: ~$252 → ~$1,920
•Gain: ~650%
•Drivers: Commodities supercycle, EM demand, USD weakness, GFC safe-haven bid
3) 2016/2018–Present The “CB-Led” Cycle
•Cycle low (key anchor): ~$1,080 (2016)
•Latest / ATH: ~$4,885 spot; ATH $4,887.82 (Jan 21, 2026)
•Gain since 2016 low: ~+352%
•Primary drivers:
o🏦 Central banks: 1,045t added in 2024 (3rd straight 1,000t+ year)
o💧 ETF inflows: major re-acceleration, including record Q3 2025
o🌍 Geopolitics/trade shocks: renewed safe-haven urgency into Jan 2026
________________________________________
📊 At-A-Glance Comparison
Metric 1968–80 Super Bull 1999–2012 2016–2026 Current
🚀 Total Gain ~2,330% ~650% ~+352% (from ~$1,080)
⏲️ Duration 12 yrs 13 yrs ~10 yrs (ongoing)
💔 Max Drawdown ~–45% ~–30% ~–20%ish (not a deep secular washout so far)
🏦 Main Buyer Retail/Europe Funds/EM Central banks + ETFs/investors
🏛️ Pattern Secular parabolic Cyclical ramps Breakout → staircase ATHs → $5k magnet
________________________________________
📈 Top 10 Stats of the Current Bull Jan 2026 Edition
1.🟡 Price / ATH: $4,885 spot; ATH $4,887.82
2.🧮 Bull-cycle gain (2016 low): ~+352% from ~$1,080
3.🧲 Next magnet: $5,000 psychological level
4.🏦 Central banks: +1,045t in 2024 (3rd straight 1,000t+ year)
5.💧 ETF surge: Q3 2025 logged the strongest quarter on record (WGC)
6.🌍 2026 impulse: safe-haven bid tied to geopolitical/trade escalation
7.🥈 Silver confirmation: record ~$95.87 (Jan 20, 2026)
8.🧱 Demand pulse: WGC-linked commentary highlighted record-strong quarterly demand in 2025 (investment + CBs)
9.📊 Equity comparison anchor: S&P 500 2025: +16.39% (gold’s run continued to new records in Jan 2026)
10.🎯 Street framing: credible scenario work explicitly targets $5,000/oz as a 2026 outcome case
________________________________________
🎯 Strategy Ideas 2026+
Core simple + durable
•🧱 Hold/add on pullbacks via allocated physical, high-liquidity ETFs, and quality royalty/producer names.
•⚖️ Size it like insurance: you want enough to matter, not enough to force emotional selling.
Satellite torque, optional
•🥈 Silver (higher beta) + select miners only if you accept volatility (silver just proved it can go vertical).
Risk management
•🧯 Define your trim rules before the chart goes vertical:
otrim a slice into euphoric spikes, keep the core
oavoid leverage if you can’t stomach violent swings
________________________________________
🧪 Reality Check — What Could Cool This Bull?
•💵 Sustained USD strength + higher real yields
•🏦 Meaningful slowdown in official-sector buying
•📉 Big reversal in safe-haven demand if geopolitical/trade risk de-escalates fast
________________________________________
🔚 Updated Key Takeaways
•🏦 Central banks + ETFs are the twin pillars of this cycle.
•🟡 Gold is printing fresh records into Jan 2026 and $5,000 is the next psychological battleground.
•🧠 From $1,080 (2016) to ~$4,885, we’re up ~+352% — and the tape is behaving like a late-stage trend.
Fvg

NQ Weekly Levels: Reversal Zone 24775/24900 → Target 25425/2544🔱 NQ WEEKLY SNAPSHOT — EXECUTIVE SUMMARY (NEW WEEK | JAN 2026)
✨ Liquidity collection → bounce setup is the focus — patience until sell-side is swept
🧲 Fresh overhead sell-side liquidity magnet / massive FVG target: 25425–25440
📌 Context: Plan is not to chase strength — wait for price to collect liquidity below market first
🧲 Bull FVG: ~25000 but noted as weak — treat as minor support / reaction only
🛡 Preferred reversal / long scale zone: 24775–24900
🛡 Failure zone / risk-off trigger: sustained acceptance below
24770 opens downside continuation / no-bid conditions
🎯 Bull target: rotation into 25425–25440 to tap fresh overhead liquidity pocket
🏦 Core play: let NQ sweep lower liquidity → scale buys 24775–24900
→ manage risk if 24770 fails → take profit into 25425–25440
________________________________________
🗳️ NQ Weekly Scenarios — What’s Your Play?
🅰️ Hold 24775–24900 → reversal works → reclaim 25000 → rotation into 25425–25440
🅱️ Sweep below 24770 → reclaim back into 24775–24900 → squeeze higher → tag 25425–25440
🅲 Drive into 25425–25440 → rejection from fresh sell-side liquidity
→ pullback toward 25000 → 24900
🅳 Break/hold below 24770 → weakness confirms → bounce thesis invalid → downside continuation (stand aside / reassess)
________________________________________
Your key levels: 25440 / 25425–25425 / 25420 / 24900 / 24770
Your FVGs: ~25000 bull / 25425–25440 massive overhead liquidity pocket

US30 Buy Price at struggling to move up side , its come downs at VA-H and Golden Zone are then give you 5 mints clear Buy Conformation we take BUY Order a clear conformation is any Order Block or FVG or Demand Zone.

My Nas100 forcast for the dayNas100 has been in a range for a while now so i am very "seating on my hand" kind of week. but if i get a liquidity sweep of London high and FVGs are rejected i will look for sell opportunity

Gold Weekly Levels: Break above 4630 → 4720/4725🔱 GOLD WEEKLY SNAPSHOT — EXECUTIVE SUMMARY (NEW WEEK | JAN 2026)
✨ Bullish bias stays active for the week — but the upside is capped
🧲 Fresh overhead sell-side liquidity: 4630–4635 = first magnet
🟣 Max overbought + January ceiling: 4720–4725
📌 Expectation: limited upside from Point C in January
🧲 Fresh buy-side liquidity : 4500–4510 = preferred reload area
🛡 Bull structure invalidation: 4450 — break below invalidates outlook
🎯 Bull targets: first 4630–4635 → on valid breakout, ext 4720–4725
🏦 Core play: accumulate dips 4500–4510 reduce risk into 4630–4635
________________________________________
🗳️ Gold Weekly Scenarios — What’s Your Play?
Which path do you have for XAUUSD next week?
🅰️ Hold 4500–4510 → accumulate zone performs → rotation into 4630–4635
🅱️ Early sweep below 4510 → reclaim 4500–4510 → squeeze into 4630–4635
🅲 Direct drive into 4630–4635 → reaction/rejection → dip back toward 4500–4510 for reload
🅳 Break below 4450 → bullish outlook invalidated → downside opens further (risk-off shift)
Your key levels: 4500–4510 (buy-side) / 4450 (invalidation) / 4630–4635 (sell-side) / 4720–4725 (max-out)
________________________________________
🔥 GOLD WEEKLY SNAPSHOT — BY PROJECTSYNDICATE
🏆 Swing Structure
Gold remains in a bull-controlled tape for the new week, with the plan centered around dip accumulation + controlled upside targets:
• 4500–4510 is the fresh buy-side liquidity zone and the preferred area to build/scale long exposure.
• Bulls’ first major objective is 4630–4635, which is fresh sell-side liquidity — expect profit-taking, supply, and reaction risk there.
• If price breaks and holds above 4630–4635 (valid breakout), the market can extend into 4720–4725, defined as:
o max overbought zone
o AB swing 1.62 extension
o January 2026 max-out ceiling (expectation: limited upside beyond this in January)
• 4450 is the line in the sand: a break below invalidates the bullish outlook and exposes broader downside risk.
________________________________________
📈 Trend
Higher-timeframe bias: Bullish (new week)
Tactical: Two-phase week
Phase 1: Dip Accumulation & Rotation Higher
• Bulls ideally defend the 4500–4510 zone
• Accumulation/reloading happens on dips
• Rotation targets the overhead liquidity magnet 4630–4635
Phase 2: Breakout Decision at Supply
• 4630–4635 becomes the decision zone
• If rejected: expect rotation lower / reload behavior (watch 4500–4510 again)
• If valid breakout: extension unlocks toward 4720–4725 (January max-out zone)
________________________________________
🛡 Supports — Demand / Buy-Side Liquidity Zones
✅ 4500–4510 (Fresh buy-side liquidity)
• Primary dip-buy / accumulation zone this week
• Expect strongest bid response / “reload” behavior here
⚠️ 4450 (Bullish invalidation level)
• Break below = bullish thesis invalidated
• Opens risk for further downside continuation (structure shifts)
________________________________________
🚧 Resistances — Upside Objectives / Liquidity Zones
🎯 4630–4635 (Fresh sell-side liquidity)
• Primary bull target for the week
• High probability reaction zone (scale out / reduce risk)
🚀 4720–4725 (Max overbought + AB 1.62 extension | Jan 2026 max-out)
• Only in play after a valid breakout beyond 4630–4635
• Treated as January’s ceiling — upside expected to be limited from Point C this month
• High-risk zone for chasing longs; prioritize execution + protection
________________________________________
🧭 Bias Next Week
Primary bias: Bullish
What you’re trading this week:
• Bulls: accumulate dips 4500–4510 → target 4630–4635 → breakout continuation toward 4720–4725
• Bears: look for rejection signals at 4630–4635 and especially 4720–4725 (January max-out)
________________________________________
⚖️ Base Case Scenario (Most likely path)
Early week: dips are bought / accumulation near 4500–4510
Mid-week: rotation higher toward 4630–4635
Late week: decision at 4630–4635
• If acceptance occurs → extension attempt toward 4720–4725
• If rejection occurs → pullback for reload toward 4500–4510
________________________________________
🚀 Breakout / Invalidation Triggers
✅ Bullish continuation trigger
• Strong push into 4630–4635 and clean breakout/acceptance above it
• Opens the path to 4720–4725
⚠️ Supply reaction trigger
• Tap/sweep into 4630–4635 + rejection behavior (stall/wicks/displacement down)
• Signals pullback risk back toward 4500–4510
🛑 Bullish invalidation trigger
• Break below 4450
• Bullish outlook invalidated; downside opens further
________________________________________
🔓 Bull / Bear Structural Lines (Updated)
🟢 Bull control zone: Above 4500–4510 (dip-buy regime intact)
🟡 Transition / decision zone: 4630–4635
🟣 January max-out zone: 4720–4725
🔴 Invalidation line: Below 4450
________________________________________
🧭 Recommended Strategy Framework (Updated)
1️⃣ Primary Play — Accumulate the dips (with structure)
Idea: bullish week → build exposure where liquidity is fresh
• Scale longs near 4500–4510
• Prefer confirmation via stabilization/reclaim behavior
• Keep risk defined with 4450 as the structural line
2️⃣ Profit-taking Plan — Sell into the first magnet
• Scale out into 4630–4635 (fresh sell-side liquidity)
• Tighten risk aggressively as price enters the zone
• Assume reaction risk increases near 4635
3️⃣ Breakout Play — Only if price proves acceptance
• If 4630–4635 breaks and holds → target 4720–4725
• Treat 4720–4725 as January max-out: reduce risk quickly, don’t overstay
________________________________________
✅ Weekly Levels
• 4720–4725: January max-out / max overbought / AB 1.62 extension
• 4630–4635: fresh sell-side liquidity (primary bull target / reaction zone)
• 4500–4510: fresh buy-side liquidity (dip accumulation zone)
• 4450: bullish invalidation (break below flips the outlook)

Trump Imposes Tariffs on EU – Gold Creates a Rare GAP, Will It BMarket Context
Trump’s announcement of new tariff measures on EU goods has triggered a strong risk-off wave, pushing capital out of risk assets and into Gold as a safe-haven.
The USD shows mixed reactions, while Gold rallies sharply and forms a rare bullish GAP, clearly reflecting defensive market sentiment.
The key question now is not whether Gold is strong or weak, but:
Will this GAP be filled, or held for trend continuation?
Technical Structure (H1)
The broader structure remains bullish, confirmed by multiple Breaks of Structure (BOS).
The latest impulsive move has created a bullish Fair Value Gap (GAP) above the equilibrium zone.
Price is currently holding above the FVG, with no clear acceptance back into lower levels.
➡️ In a geopolitical and trade-risk environment, GAPs are not required to be filled immediately.
Decision Zones
Upper FVG / GAP: 4,634.188
Equilibrium Zone: 4,619.928
Lower Support / GAP Base: 4,596.602
Scenarios (If – Then)
Scenario 1 – GAP Holds & Continuation
If price holds above 4,619.928, the GAP remains protected.
Bullish continuation toward higher levels becomes likely as safe-haven flows persist.
Scenario 2 – Technical GAP Fill
If price loses 4,619.928, a retracement toward 4,596.602 is likely for rebalancing.
Only a clear H1 close below 4,596.602 would confirm a deeper GAP fill.
Summary
Trade-related confrontation is changing price behavior, causing Gold to react more aggressively than usual.
At this stage, the GAP represents the decision point between continuation and correction.
Reaction at the GAP will define the next move.
Trade the reaction, not the headline.

Gold Clear UP MoveCurrent time Gold made a Bullish ENGULFING Candle and also closed last candle High Price ,its a clear Gold Move is up-Direction ,wait for Buy Order in Clear as per your conformation

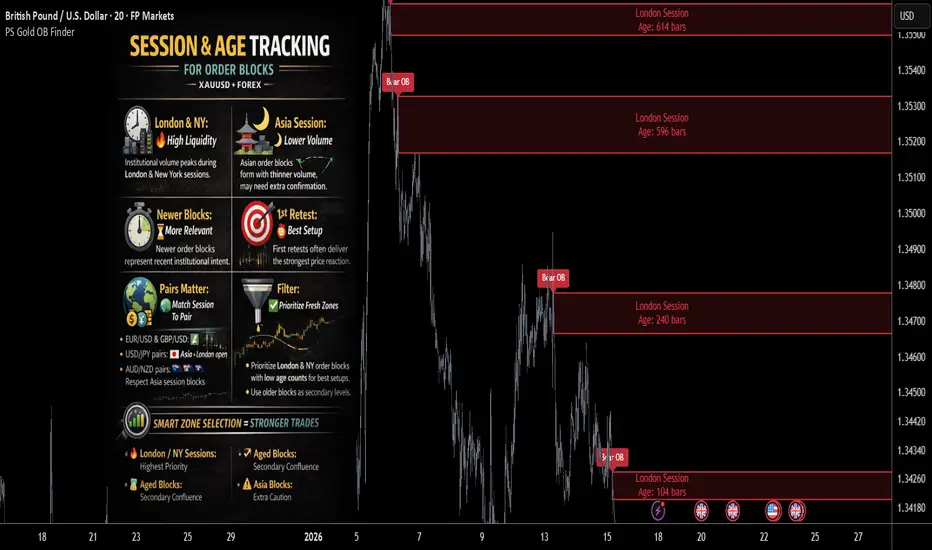
Trade Fresh Order Blocks Only: Gold and ForexLatest version Order Block Finder | Gold | ProjectSyndicate
labels all sessions automatically and assigns the order block age.
Just enable it with ON from indicator settings.
🕒 Session context = understanding who is moving the market
Session identification matters because institutional order flow changes a lot across the trading day. London and New York sessions typically bring the highest liquidity and volatility for XAUUSD and most major Forex pairs, because that’s when big banks, funds, and macro players are most active. Order blocks formed during these sessions often reflect real institutional positioning and tend to react more cleanly when price revisits them.
🇦🇸 Asian session order blocks can be lighter weight
During the Asian session, volume is often thinner—especially for Gold (XAUUSD) and many GBP/EUR crosses—so order blocks created there can be easier to invalidate and sometimes form from smaller liquidity runs. That said, Asian session blocks can be very relevant for region-tied pairs (JPY, AUD, NZD, and Asia-led flows), but they usually need extra confirmation to match the reliability of London/NY blocks.
💧 Liquidity differences affect how order blocks form and hold
Higher-liquidity sessions tend to create cleaner displacement moves, clearer breaks of structure, and more defended zones—because there’s real participation behind them. Lower-liquidity conditions can create choppier swings and weaker footprints, so session tracking helps you prioritize order blocks that are more likely to represent meaningful supply/demand.
🧠 Order block age = relevance and strength over time
Order block age acts like a freshness score. Newer order blocks low age count often matter more because they reflect recent institutional intent and potentially unfilled orders that price may return to. As an order block gets older without producing meaningful reactions—or as structure shifts—it may lose relevance as new supply/demand zones replace it.
🎯 The first retest is often the highest-probability opportunity
A fresh, untouched pristine order block commonly delivers the cleanest reaction on the first return, because it’s more likely that resting liquidity is still sitting there. Once a zone has been tapped, partially filled, or repeatedly retested, its edge can decrease—especially if it stops producing strong displacement afterward.
🧩 Forex-specific note: session relevance depends on the pair
Not all Forex pairs behave the same across sessions. 🌐 EURUSD/GBPUSD often show strong setups during the London → NY overlap. 🇯🇵 JPY pairs can show key moves during Asia, but also react heavily when London opens. 🇦🇺 AUD/NZD pairs may respect Asia session blocks more than EUR/GBP pairs do. Session tagging helps you match order block “quality” to the pair’s natural liquidity cycle.
🏗️ Together, session + age create a repeatable filtering hierarchy
When you track both metrics, you can build an objective ranking system:
🔥 Prioritize London/NY order blocks with low age counts for primary entries.
🧷 Use older blocks as secondary confluence (targets, reaction zones, structure reference).
⚠️ Treat Asian session blocks with more caution unless supported by structure, displacement, HTF bias, or liquidity confirmation.
📊 This turns zone selection from subjective to systematic
Instead of picking order blocks based on feel, you’re applying consistent rules: who created it (session) and how current it is (age). That makes your strategy easier to backtest, optimize, and execute with confidence.
ARB 1D 71 LONG SCOREARB — quick snapshot (17 Jan 2026)
Positives (weighted)
Fundamentals: Grayscale funds list (+1), Arbitrum stablecoin settlement layer (+1), ARB in Grayscale candidates (+1), Wyoming stablecoin on Arbitrum (+1).
TA components: EMA order +30 (strong trend), deviations +5 (normal range), series +0.5 (mild impulse), spreads +3 (healthy spread), FVG +7 (bullish gaps), liquidations +2.5 (short squeeze), narrative +20 (long bias), plan +14 (validated plan).
Price action: downtrend slowdown +2, HH/HL +4, microstructure +1, rising channel +2.
Total positive weight: +95.0
Negatives (weighted)
Fundamentals: ARB share 0.94% / $19.7m (−2).
Unlock pressure −10; next on 16 Feb 2026 — strong downside pressure.
Price action: equal highs (−3).
Total negative weight: −17.5
Context (unweighted risks)
Flat macro regime; Jan–Feb high‑risk window (US budget/shutdown, FOMC 27–28 Jan, BoJ minutes 28 Jan).
Bias: Long, but tactical only; keep risk tight.
EMA STRATEGY:
TA:
LIQUIDATIONS:

OP 1D LONGBINANCE:OPUSDT
Long Score: 70.5 (me) / 47.5 (system)
Panel context:
- Narrative: global + local = LONG
- Fundamentals: buyback proposal (vote Jan 22; 50% Superchain rev) + institutional push + RLUSD to OP (bullish)
- Risk: major unlock supply (next unlock Jan 31) → expect volatility
- Phase/EMA: TOTAL_BULL EMA stack (trend-follow bias)
- PA: HH/HL + ascending channel; “hunt up” possible
- FVG: bull support 0.33–0.3488 / 0.28–0.3035; nearby bear FVG 0.34–0.366 (reaction zone)
My charts:
EMA PHASE:
TA:
LIQUIDATIONS:

BTCUSDT M30 FVG Hold and Short-Term Bullish Reaction Setup📝 Description
BINANCE:BTCUSDT is trading above a key H1 FVG after a sharp sell-side sweep, showing stabilization and early signs of short-term accumulation. The recent pullback appears corrective rather than impulsive, with price holding above local demand.
________________________________________
📈 Signal / Analysis
Primary Bias: Bullish while price holds above the M30 / H1 FVG base
Preferred Setup:
• Entry: 95,215
• Stop Loss: Below 94,970
• TP1: 95,600
• TP2: 95,980
• TP3: 96,410 (H1 FVG / higher liquidity)
________________________________________
🎯 ICT & SMC Notes
• Sell-side liquidity has been swept before stabilization
• Price reacting from H1 FVG support
• Current structure suggests a relief bounce within range conditions
________________________________________
🧩 Summary
As long as CRYPTOCAP:BTC holds above the H1 FVG and recent sell-side low, a short-term bullish continuation toward higher liquidity pools remains the preferred scenario.
________________________________________
🌍 Fundamental Notes / Sentiment
Market sentiment remains neutral-to-constructive, with no immediate macro pressure forcing risk-off behavior, allowing technical support reactions to play out.
________________________________________
⚠️ Risk Disclosure
Trading involves substantial risk and may result in capital loss. This analysis is for educational purposes only and does not constitute financial advice. Always apply proper risk management, predefined stop-loss levels, and disciplined position sizing aligned with your trading plan.

SOL - Descending Wedge Rejection at $145 | FVG Retest Incoming
What's up traders! 👋
SOLUSD is setting up for a key move. We've got a symmetrical wedge pattern with price respecting the descending resistance perfectly - hitting it and getting rejected. Let me break down what I'm seeing on the 45-minute chart.
The Setup
SOL is trading at $144.85 on the 45-minute timeframe. Price is inside a symmetrical wedge pattern - descending resistance on top (lower highs) and ascending support on bottom (higher lows). The key here: price just hit the descending resistance near $145-$147 and got REJECTED.
This is textbook wedge behavior. Price respects the trendlines until breakout. Right now, it's following the wedge DOWN toward the FVG zone.
Why I'm Leaning Bearish (Short-Term)
Price rejected from descending resistance at $147
Failed to clear $150 resistance - sellers defending
Dropped below $146 and $145 - now below 100-hour SMA
Hourly RSI below 50 - bearish momentum
MACD showing bearish pressure
Long/short ratio at 0.7569 - traders leaning short
$10.5M in liquidations - $7.7M were longs
3M performance: -20.40% | 1Y: -29.60% - macro downtrend
The Wedge Structure
DESCENDING RESISTANCE (Top): Lower highs forming - sellers capping rallies at $145-$147
ASCENDING SUPPORT (Bottom): Higher lows forming - buyers defending around $138-$140
CURRENT ACTION: Price hit descending resistance and rejected
FVG ZONE: $140-$142 is the next target for retest
TREND: Following the wedge DOWN until breakout
The News Context - January 16, 2026
Mixed signals but leaning bearish short-term:
SOL failed to hold above $146 - entered short-term correction
Price below 100-hour simple moving average
Broke below 61.8% Fib retracement of $138-$149 move
$10.5M liquidations - mostly longs ($7.7M)
Long/short ratio 0.7569 - traders positioning short
RSI below 50, MACD bearish
Bullish Catalysts (Watch For Breakout)
Solana ETF inflows $23.57M - highest in 4 weeks
Forward Industries building largest SOL treasury (6.9M SOL)
Alpenglow upgrade coming - transaction finality 100-150ms (from 12.8s)
RWA ecosystem hit $1.15B record valuation
Network processed $1.6T in 2025 trading volume
68M active addresses (up 14%) - most used network
Open Interest jumped from $6.8B to $8.8B
"Clarity Act" could ease SEC requirements for SOL
Key Levels I'm Watching
Resistance:
$145.50 - Day's high / immediate resistance
$146 - First major resistance
$148.29 - MAJOR RESISTANCE (breakout level)
$150 - Psychological round number
$155 - Next target if breakout
$162 - Extended bullish target
$200 - Analyst target (if network growth continues)
Support:
$144.85 - Current price
$141 - Bullish trendline support
$140-$142 - FVG ZONE (key retest target)
$140.23 - MAJOR SUPPORT (76.4% Fib)
$138 - Swing low
$137.72 - CHANNEL BOTTOM
$132 - Next support if breakdown
$124 - Extended bearish target
Two Scenarios
BEARISH CONTINUATION (PRIMARY):
Price continues following the descending wedge. After rejecting from $145-$147 resistance, SOL drops to retest the FVG zone at $140-$142. If FVG fails to hold, continuation to $137.72 channel bottom.
First target: $141 (trendline support)
Second target: $140.23 (major support / 76.4% Fib)
Extended target: $137.72 (channel bottom)
Breakdown target: $132, then $124
Triggers: Continued rejection at descending resistance, break below $140, risk-off sentiment, no major bullish catalyst.
BULLISH BREAKOUT (ALTERNATE):
Big news hits and price breaks above the descending wedge resistance. SOL clears $148.29 with volume and targets higher levels.
First target: $150 (psychological)
Second target: $155 (next resistance)
Extended target: $162, then $173
Moon target: $200 (if network growth accelerates)
Triggers: Break above $148.29 with volume, major ETF news, Alpenglow upgrade hype, institutional buying.
My Take - BEARISH BIAS (Short-Term)
I'm leaning BEARISH here. Here's why:
1. Price respecting descending resistance - SOL hit the wedge top at $147 and got rejected. This is textbook - follow the trend until breakout.
2. Technical indicators bearish - RSI below 50, MACD bearish, below 100-hour SMA. Momentum favors sellers.
3. Liquidation data bearish - $7.7M in long liquidations vs $2.8M shorts. Longs getting squeezed.
4. Long/short ratio bearish - At 0.7569, traders are positioning short. Smart money leaning bearish.
5. Macro structure weak - Down 20.40% in 3 months, down 29.60% in 1 year. Still well below $295 ATH.
BUT - Watch for the Breakout
The bullish catalysts are real:
ETF inflows strongest in 4 weeks
Alpenglow upgrade is massive (100ms finality)
Institutional adoption growing (Forward Industries)
Network fundamentals strong (68M addresses, $1.6T volume)
If big news hits, SOL could spike above $148.29 and invalidate the bearish thesis. But until that happens, I'm following the wedge DOWN.
Trade Plan
Bearish Entry (PRIMARY):
Entry: Rejection at $145-$146 resistance OR break below $141
Stop: Above $148.29 (above major resistance)
Target 1: $141 (trendline)
Target 2: $140.23 (major support)
Target 3: $137.72 (channel bottom)
R:R: ~1:2
Bullish Entry (if breakout):
Entry: Break above $148.29 with volume
Stop: Below $144
Target 1: $150 (psychological)
Target 2: $155
Target 3: $162
R:R: ~1:2.5
The Bottom Line
SOLUSD is respecting the symmetrical wedge perfectly. Price hit descending resistance at $147 and got rejected - now heading toward the FVG zone at $140-$142 for a retest.
Short-term, I'm BEARISH. Follow the wedge until it breaks. The FVG zone at $140-$142 is the next target. If that fails, $137.72 channel bottom is in play.
Long-term, the fundamentals are strong (ETF inflows, Alpenglow upgrade, institutional adoption). But technicals say DOWN until we break above $148.29.
Watch the FVG zone. That's your tell.
What do you think? Continuation down or breakout up? Drop your thoughts below! 👇

CAKE LONG 2026-01-16 My Long/Short Score: 77
- Narrative: global + local = LONG
- Fundamentals: proposal to cut max supply by ~50M (~11%) (positive)
- Phase/EMA: TOTAL_BULL EMA stack (strong trend)
- Dev: 4H + 1D in normal range (no major overheat)
- FVG: New Bull FVG support 1.914–1.893 (HTF); extra support 1.997–2.028 (LTF)
- PA/Liquidity: upside liquidity sweep → follow-through possible, but expect stop-hunt noise
- Fakes: elevated (choppy) → accept volatility, keep strict risk rules
My personal indicators dashbord:

EURUSD H1 Bearish Continuation After BOS and Weak Pullback Setup📝 Description
EURUSD is trading within a clear bearish structure on H1 after a confirmed HTF BOS. The recent upside move is corrective and capped below H1 resistance and FVG, showing lack of bullish acceptance.
________________________________________
📈 Signal / Analysis
Primary Bias: Bearish while price remains below the H1 FVG and descending trendline
Preferred Setup:
• Entry: 1.1618
• Stop Loss: Above 1.1625
• TP1: 1.1609
• TP2: 1.1600
• TP3: 1.1590 (HTF draw / lower liquidity)
________________________________________
🎯 ICT & SMC Notes
• HTF BOS confirms bearish market structure
• Current pullback is corrective into H1 FVG
• Sell-side liquidity below remains the primary draw
________________________________________
🧩 Summary
As long as price stays below the H1 resistance and FVG zone, EURUSD is expected to continue its bearish leg toward lower liquidity targets.
________________________________________
🌍 Fundamental Notes / Sentiment
Macro sentiment remains supportive of USD strength, with no near-term catalyst favoring sustained EUR recovery, reinforcing downside continuation scenarios.
________________________________________
⚠️ Risk Disclosure
Trading involves substantial risk and may result in capital loss. This analysis is for educational purposes only and does not constitute financial advice. Always apply proper risk management, predefined stop-loss levels, and disciplined position sizing aligned with your trading plan.

COSMOS / USDT – Daily OutlookDaily structure shows a bullish Market Structure Shift (MSS), confirming a short-term trend change.
Price is currently trading above key structure, however:
The 50% retracement (~2.30) marks the optimal discount zone
Multiple unfilled FVGs remain below current price, increasing pullback probability
Key considerations:
- Long continuation is favored after retracement
- Lower timeframe confirmation remains required
- Aggressive entries above current price carry elevated risk
Bias remains bullish, but patience is required.
If this analysis added value or offered a new perspective, consider leaving a like 👍
Feel free to share your view in the comments — constructive discussion helps everyone improve.
MrC

xauusd sell!"Unfortunately, the entry didn’t trigger yesterday 😕, but no worries, we’ll try again today! Let’s go! Be careful though—America is very unpredictable, and as we see, anything can happen! Please hit a like if you enter!

BITCOIN Institutional Levels: Buy 94.4k–92.6k → Target 98k–100k🔱 BITCOIN SMC OUTLOOK — EXECUTIVE SUMMARY M30 TF
✨ Bitcoin remains in bullish market structure with higher-timeframe continuation bias
🟢 Trend context: Accumulation → Expansion sequence still intact
🧱 Bullish Breaker Blocks:
• 94,400 (primary BB – first dip zone)
• 92,600 (secondary BB – deeper mitigation)
🟩 Bullish Order Block: 90,600 (last-defense demand)
🔺 MTF Bearish Order Block: 98,000 (HTF supply / reaction zone)
💧 Sell-Side Liquidity Pool: 98,000 → 100,000 (equal highs / psychological round number)
📈 Bias remains bullish while price holds above 90,600
🚀 Expect continuation toward overhead sell-side liquidity after mitigation
⏳ Short-term consolidations likely before expansion legs
⚠️ Invalidation: sustained acceptance below 90,600
🎯 Strategy:
Accumulate dips into Bullish Breaker Blocks, scale out into fresh sell-side liquidity above 98k
🏦 Expect profit-taking and reaction near 98k–100k before next directional decision
________________________________________
🗳️ BITCOIN M30 SCENARIOS — WHAT’S YOUR PLAY?
Which path do you see for BTC next?
🅰️ Hold 94.4k BB → continuation toward 98k–100k liquidity sweep
🅱️ Deeper mitigation into 92.6k BB, then expansion higher
🅲 Full draw into 90.6k OB, strong reaction → continuation leg
🅳 Your level: drop the BTC price you’re watching most next
All levels generated automatically with ProjectSyndicate Free Indicators.
Order Block Finder | Gold | ProjectSyndicate
Breaker Blocks Finder | Gold | ProjectSyndicate

US30 SELL sideStrong sell move wait for clear point then we take a sell enter ,everything's I show here where to entry and where is TP and SL and please must be sure as per your conformation Rule then enter

BTC M15 HTF FVG Rejection and Liquidity Pullback Setup📝 Description
On the M15 timeframe, BTC is trading within a broader bearish context after a strong impulsive sell. Price has retraced into a clear H1 FVG / supply zone, where sell-side interest is active again. The current bounce looks corrective rather than impulsive, suggesting a potential continuation lower toward nearby liquidity pools.
________________________________________
📈 Signal / Analysis
Primary Bias: Bearish below 90,600
Preferred Setup:
• Entry: 90,650
• Stop Loss: Above 90,800
• TP1: 90,356
• TP2: 90,027
• TP3: 89,425
________________________________________
🎯 ICT & SMC Notes
• Price reacting inside unmitigated H1 FVG
• Current move classified as a bearish pullback, not reversal
• Below-price sell-side liquidity remains intact
________________________________________
🧩 Summary
BTC is showing a classic bearish retracement into premium HTF supply. As long as price remains capped below the H1 FVG, downside continuation toward 90k and sub-90k liquidity levels remains the higher-probability scenario. Rejection from this zone strengthens the bearish case.
________________________________________
🌍 Fundamental Notes / Sentiment
US labor data supports a stronger USD, reinforcing higher-for-longer rates and weighing on risk assets. With dollar strength in play, a bearish move in Bitcoin is favored, and any short-term upside is likely corrective.
________________________________________
⚠️ Risk Disclosure
Trading involves substantial risk and may result in capital loss. This analysis is for educational purposes only and does not constitute financial advice. Always apply proper risk management, predefined stop-loss levels, and disciplined position sizing aligned with your trading plan.

BTC Side-waives for BUY BTC this move on side-waives ,its come a down side below FVG hit back to up-side at RED-Line target OR 2nd is current price goes up and re-test back to up side for a BUY Formation its a clear up side make, and normal volume is down-ward its price doesn't want move for sell side, its made a trip where i said price come down then Movie UP-side. now lets see

MNQ LONGS head and shoulders was pretty obvious today bear flag and trap after trap. We havent quite swept NYSE PM low;s. For a short term scalp im targetting my neckline with a SL of 822.5. forming a possible tripple bottom bear just be cautious you still are in a bear flag but that doesnt mean you can scalp longs for free money within a bearish pattern

US100 M15 FVG Reaction and Bullish Continuation Setup📝 Description
US100 on M15 is trading inside a corrective phase after a clear impulse. Price has dipped into a 15M FVG and is showing early signs of support and absorption, suggesting this move is a liquidity-driven pullback rather than a trend reversal.
________________________________________
📈 Signal / Analysis
Primary Bias: Short-term bullish continuation while holding above 25,540–25,560
Long Setup (Preferred):
• Entry (Buy): 25,560
• Stop Loss: Below 25,530
• TP1: 25,597
• TP2: 25,620 (15M FVG)
• TP3: 25,657 (BSL / range high)
________________________________________
🎯 ICT & SMC Notes
• Clean pullback into 15M FVG
• Signs of absorption, not acceptance lower
• Market structure still bullish on LTF
• BSL resting above recent highs
________________________________________
🧩 Summary
This looks like a classic pullback-to-continue setup. As long as US100 holds the current FVG, odds favor a push higher to collect buy-side liquidity near the highs. Acceptance below the FVG invalidates the long idea.
________________________________________
🌍 Fundamental Notes / Sentiment
With US indices still sensitive to macro headlines and rate expectations, shallow pullbacks into liquidity zones often resolve with continuation. Trade reactions, keep risk tight, and scale out into targets.
________________________________________
⚠️ Risk Disclosure
Trading involves substantial risk and may result in capital loss. This analysis is for educational purposes only and does not constitute financial advice. Always apply proper risk management, predefined stop-loss levels, and disciplined position sizing aligned with your trading plan.

Gold strong low level for BUYGold strong low level for BUY. Now at time price move on up-side if price closed up at 4456.801 then price goes more up side OR price Resistance that level and price sweep the liquated level then again price move its more chance hits the point A ,B and C.
lets see
