PLUMEUSDT 4H – EMA Deviation Long on RWA + USDC CatalystSetup
BYBIT:PLUMEUSDT just printed a fresh 4H EMA Deviation long signal after a sharp flush below the EMA stack. Price is trading around 0.038–0.039, with all key timeframes (15m, 1H, 4H, 1D, 3D) in “Below / Oversold” state on my EMA Dev dashboard. Current 4H deviation is ~28%, above the historical oversold average (~26%), which fits my rules for a mean-reversion long.
I am looking for a bounce back into the 4H EMA band and the nearest supply zone, where the previous distribution leg started.
Technical context
The downtrend from 0.055–0.056 pushed price under the 4H and 1D EMAs and into the lower ATR corridor. The last impulsive candle washed out local longs and expanded deviation to one of the highest readings in the current sample.
Key levels on the chart:
• Entry zone: 0.038–0.039 (current 4H demand / max negative deviation)
• First target: 0.0485–0.0490 (4H EMA cluster + local supply)
• Optional second target: 0.055–0.056 (prior breakdown area / 1D EMA region)
• Invalidation: sustained 4H close below the spike low around 0.034–0.035
As usual with this strategy, I’m not trying to catch the exact bottom – the edge comes from entering when deviation is stretched and closing into the EMA / resistance band.
Strategy stats (PLUME, 4H EMA Dev long)
Backtest sample: 20 trades, long only.
Winrate: 75%.
Avg PnL per trade: +3.75%, avg winner +8.15%, avg loser −9.45% (win/loss ratio ~0.81).
Largest winner +17.4%, largest loser −15.4%.
Losing trades tend to last longer (≈62 bars) than winners (≈25 bars), so if price sits under EMAs too long without mean reversion, I prefer to cut rather than “marinate” in drawdown.
Given the current ~28% negative deviation, the upside to the 4H EMA/supply (~+25–28%) is larger than the historical average winner, while downside to invalidation is kept near the typical loss profile.
Fundamentals & narrative
Plume is positioning as an RWA chain with a focus on compliant tokenized assets:
CCTP V2 and native USDC are now live on Plume, enabling smoother cross-chain liquidity flows.
Nest Protocol is relaunching on Plume using Pendle-style mechanics with TVL in the hundreds of millions, supporting the yield/RWA narrative.
There is active collaboration with Circle (CCTP + USDC workshop) and a growing stack of institutional RWA products (WisdomTree funds, Galaxy allocation, prior SEC transfer-agent registration, etc.), although some of those catalysts are already “spent” in the short term.
Main overhang: an upcoming unlock of ~239.65M PLUME (~2.4% of supply) on 21 December, which can cap the upside if spot demand doesn’t keep up. My fundamental score here is around BBB+ – constructive RWA + USDC story, but with clear unlock risk.
Trade plan
Base case: fade the current oversold deviation on 4H, ride the move back into 0.048–0.049, and optionally trail a small remainder toward 0.055–0.056 if momentum and flows improve.
If price fails to bounce and closes 4H below 0.034–0.035, I consider the EMA Dev setup invalid for now and step aside until a new deviation cluster forms.
Not financial advice – this is a systematic mean-reversion long based on my EMA Deviation framework plus the current RWA / USDC catalysts on Plume.
Fvg

Bitcoin – From Break to Battle: Will the Bulls Hold the Line?Bitcoin has broken its four-hour downtrend line, marking a potential shift in momentum after an extended bearish phase. The move has sparked renewed interest from buyers, signaling the first real attempt to reclaim structure after consistent lower highs. Despite this progress, the market remains trapped beneath a strong resistance area that has historically acted as a ceiling for price action.
Structure and Key Levels
Following the breakout, Bitcoin left behind a fair value gap, which has now been fully filled, resulting in a healthy bullish reaction. This confirms that the imbalance served as an effective demand zone, attracting buyers back into the market. Above current price, however, lies a key resistance zone that aligns with a previous liquidity sweep, keeping the risk of rejection in play.
Bullish Scenario
If buyers can maintain control above the filled gap and sustain momentum, the structure could expand higher as liquidity above recent highs becomes the next target. A decisive break and hold above the resistance zone would confirm the continuation of bullish intent and potentially establish a higher low formation on the four-hour timeframe.
Bearish Scenario
If price struggles to gain acceptance above resistance and fails to hold its current structure, a rejection could trigger a deeper retracement. This would likely drive the market back into the range below, turning the breakout into a liquidity grab rather than a true reversal. A return toward previous demand areas would then become likely as sellers reclaim control.
Price Outlook
At this point, Bitcoin appears to be consolidating between the strong resistance above and the fair value gap below. This range may act as a decision zone for the next leg. A clean break to the upside would confirm strength and validate the recent shift in structure, while a hard rejection would suggest that the broader downtrend is not yet over.
Conclusion
Bitcoin is at a crucial juncture, trading between a proven supply area and a fresh demand zone that just produced a strong reaction. The market’s next move will reveal whether this breakout can evolve into a sustained trend reversal or if it was simply another liquidity sweep within a broader bearish context.
___________________________________
Thanks for your support!
If you found this idea helpful or learned something new, drop a like 👍 and leave a comment, I’d love to hear your thoughts! 🚀

Gold’s Tight Range = Big Opportunity! Watch These Key Levels.COMEX:GC1! COMEX:GC1! (Gold Futures) | Market Analysis & 2025 Outlook
After hundreds of requests since my last ideas, I’ve decided to share another detailed breakdown — this time for Gold Futures COMEX:GC1! . Let’s dive in.
COMEX: COMEX:GC1! Breakdown
Fundamental Analysis → NEUTRAL to BULLISH
Gold remains range-bound as markets await clearer direction from global inflation data and U.S. rate expectations. Safe-haven demand continues to support the metal, but a strong dollar has kept price capped.
Technical Analysis → RANGING (Neutral Bias)
Currently consolidating within a 4H range since October 25th, with price bouncing between resistance near 4045 and support around 3940.
A close below 3940 opens the door for lows near 3823.
A close above 4045 could trigger a move toward the fair value gap around 4235.
If price sustains above 4235, the next major target would be a breakout beyond the all-time high at 4398.
This sideways structure suggests accumulation before a decisive move — traders should stay patient for a confirmed breakout before committing heavy capital.
Sentimental Analysis → Market in Waiting Mode
Gold traders are showing hesitation — institutions and retail alike are waiting for key macro catalysts. The current equilibrium reflects indecision rather than reversal.
My Suggestion:
While the bias remains neutral, a smart strategy is to wait for confirmation from the range extremes.
Trade Plan:
BUY Setup: If we see a strong 4H or daily close above 4045, aim for 4235, then 4398.
SELL Setup: If price closes below 3940, look for continuation to 3823 before considering long re-entries.
Use proper risk management — risk small until direction confirms.
Conclusion
Gold’s current range offers both opportunity and caution. Be patient and let the breakout guide your next move. Remember — the market rewards discipline more than prediction.
If you enjoyed this breakdown, drop a LIKE, COMMENT, and FOLLOW for more updates and technical setups.
See you soon on the next trade idea! ✨📊

Bitcoin - Deathcross is coming!Bitcoin has shown a strong move over the past week, reaching the predicted downside target.
The price action is currently hovering around key technical levels that influence market sentiment on both higher and lower timeframes.
Recap of Last Week
Last week, it was noted that BTC had made a liquidity sweep, inversed the bullish daily FVG, and formed a fake-out, all pointing toward further downside movement. The target was set just above $103,000, and this was convincingly reached, with a decline of roughly 7–10%. The prediction played out accurately, and the market clearly demonstrated that the bears remain in control.
Daily Timeframe
On the daily timeframe, it’s notable that the major low around $98,000 has not yet been taken out. At the same time, BTC is trading below a strong resistance zone just above the current price.
This area will be difficult to break and could create downward pressure, making a sweep of the $98,000 level more likely. However, if BTC manages to reclaim these resistance zones, sentiment could shift to a more bullish outlook, but for now, the bears are still in charge.
4h Timeframe
On the 4-hour timeframe, there’s a 4h FVG located just above the current price.
From a technical standpoint, this is a logical area for a potential rejection.
The expectation is that BTC will first move up toward this FVG before facing a rejection and then drop again toward the $98,000 zone.
Death Cross
A death cross may form within the next 1–2 weeks, occurring when the 50-day MA crosses below the 200-day MA. This is a well-known bearish signal, but historically, it often appears toward the end of a downtrend. In this cycle, we’ve already seen three death crosses, all of which either marked or came close to marking a bottom.
However, during 2017 and 2021, death crosses also appeared at the end of bull markets — followed by a sharp decline, and then a relief rally that pushed prices back above the death cross level. Therefore, it’s crucial to stay alert to whether this signals the end of the bull market or rather a final shakeout before a new rally.
Conclusion
BTC has reached the expected downside target and is currently trading below strong resistance. It’s likely that BTC will first test the 4h FVG and then move toward the $98,000 zone.
The upcoming death cross could add pressure, but historically, such signals often mark the end of a downward phase. The coming weeks will be crucial in determining whether this is a deeper correction or the start of a new bullish impulse.
-------------------------
Thanks for your support. If you enjoyed this analysis, make sure to follow me so you don't miss the next one. And if you found it helpful, feel free to drop a like 👍 and leave a comment 💬, I’d love to hear your thoughts!


EURJPY – Dealing Range + BB + FVG Confluence SetupPrice has clearly defined a Dealing Range between the 4H highs (DRH) and lows (DRL).
After sweeping the Buy-Side Liquidity (BSL) we observed a Market Structure Shift (MSS) to the downside — signaling a potential bearish dealing range rotation.
Now, price is retracing into a confluence zone between the Breaker Block and Fair Value Gap (FVG) around 177.20–177.50, aligning perfectly with the equilibrium of this dealing range.
Expecting continuation lower toward Sell-Side Liquidity (SSL) around 174.80.
📊 Flow Summary:
Buy-side liquidity taken (BSL ✅)
Market structure shifted bearish (MSS ⚡️)
Retracement into premium zone (Breaker + FVG confluence 🎯)
Targeting sell-side liquidity below DRL (174.80 📉)
🔁 ICT Logic:
Liquidity → Shift → Retrace → Deliver

ETH/USD – Potential Bullish Reversal from Key Demand ZoneETH/USD – Potential Bullish Reversal from Key Demand Zone
🧭 Market Structure Overview
The Ethereum (ETH/USD) pair has been trading within a strong bearish trend, forming a consistent sequence of Lower Highs and Lower Lows across the 1-hour timeframe. Recent price action shows exhaustion near the latest Lower Low, where price is now reacting inside a well-defined Demand Zone (around 3,250–3,300).
This demand zone aligns with a previous structural support and a zone of liquidity sweep, indicating a potential area of institutional accumulation before a bullish retracement phase.
📉 Current Bearish Context
* The sustained downside move created multiple Lower Lows, reflecting continuous selling pressure and liquidity grabs below swing levels.
* Each impulsive drop filled prior Fair Value Gaps (FVGs), maintaining a clean bearish order flow.
* The final drive lower into the green demand zone suggests a possible displacement shift—a point where sellers could lose momentum, allowing buyers to re-enter.
📈 **Bullish Reversal Potential**
* Price is currently reacting near a high-probability Demand zone, which historically coincides with liquidity sweeps and smart money entries.
* The projected recovery path shows a potential bullish displacement toward key supply regions.
* The Bullish Liquidity band near 3,700 represents the first likely draw on liquidity, followed by mitigation of the Bearish Order Block (BE-OB) at the 3,850–3,950 region.
This aligns with the institutional logic of price seeking liquidity inefficiencies before continuing its higher timeframe narrative.
🎯 **Target Zones**
TP1: 3,700 → Bullish liquidity pocket; potential partial take-profit zone.
TP2: 3,900 → Major Bearish Order Block (BE-OB) and equilibrium target (0.79 FVG fill) TP3: 4,100 → Deep premium level, possible continuation target if momentum strengthens.
⚙️ **Trading Outlook (Educational Perspective)**
**Buy Scenario:**
* Wait for confirmation of a **Bullish Change of Character (CHOCH)** from the 3,250–3,300 zone.
* Confirmation can occur through a strong bullish candle closing above minor structure highs with volume expansion.
* A break of structure to the upside would confirm intent toward the 3,700–3,900 region.
**Sell Scenario:**
* If price fails to hold above 3,250 and breaks below 3,195, continuation of bearish structure remains valid, targeting deeper liquidity levels.
💡 **Summary Insight**
Ethereum is approaching a key turning point. The confluence of a demand zone, prior liquidity sweep, and potential for bullish displacement presents an opportunity for a short-term reversal rally toward premium zones (3,700–3,900). However, maintaining patience for confirmation remains crucial, as invalidation below 3,195 would reaffirm the macro bearish continuation.
🧠 *This analysis reflects institutional market behavior and is for educational use only.


$BTC insane range for this week ! CRYPTOCAP:BTC last week low effect !
if we want higher we have to see :
London high 108.3K
109.4K FVG
and monday high 110.7K ! step by step .
and we can hope to see range high at 117k.
otherwise we might revisit october low 103K
lets see daily close for today .

Fair Value Gaps: The Market Secret You Shouldn’t IgnoreEver scrolled through a chart and spotted a weird empty space in the candles — like the market just skipped a beat? That’s a Fair Value Gap (FVG). It’s one of those subtle price imbalances smart traders love to hunt for. Understanding how these gaps form and how price reacts around them can seriously level up your chart-reading game.
What Is a Fair Value Gap in Trading?
A Fair Value Gap happens when there’s a sudden surge in buying or selling pressure that causes price to move so fast, it doesn’t fully balance out between buyers and sellers. In simple terms, it’s an imbalance — a zone where the market skipped over potential orders.
When you hear traders talking about FVG in trading, they’re referring to those little pockets of unfilled liquidity left behind during strong moves.
So, what is FVG in trading, and why does it matter? Because price often comes back to those areas later to “rebalance” — filling the gap before continuing in the original direction. That’s the core logic behind Fair Value Gap trading.
Bullish and Bearish FVGs
There are two main types of Fair Value Gaps — bullish and bearish:
Bullish Fair Value Gap (bullish FVG): Forms during a strong upward move, when aggressive buyers push price higher, leaving a void below. Price might later dip back into that zone before continuing upward.
Bearish Fair Value Gap (bearish FVG): Forms in a sell-off, when sellers dominate and the market drops quickly, skipping over potential buy orders. Later, price often retraces upward to “fill” that gap.
Both can act as magnets for liquidity — areas where smart money likes to re-enter the market.
Fair Value Gap Example
Let’s say Bitcoin jumps from $110,000 to $120,000 in a single bullish candle, with almost no trading in between. That sudden move leaves a Fair Value Gap — the zone between the candle’s high and low where little to no trading took place.
If the market later pulls back to that range and finds support before bouncing, you’ve just witnessed a textbook Fair Value Gap example in action.
Using a Fair Value Gap Indicator
You can spot these zones manually by looking for three-candle structures — one candle that “leaves the gap” and two surrounding it that don’t overlap. But if you prefer automation, you can use a Fair Value Gap indicators:
Fair Value Gap Trading Strategies
Fair Value Gap trading isn’t about chasing price — it’s about waiting for the market to come back to you. Within Smart Money Concepts, traders often combine FVGs with CHoCH (Change of Character) to confirm a potential shift in structure before entering.
A common approach is to mark recent FVGs, identify the broader trend, and wait for price to revisit a gap in line with that trend.
In a bullish trend , traders look for bullish FVGs below current price as potential demand zones — ideally after a CHoCH confirms that buyers are stepping back in.
In a bearish trend , they watch for bearish FVGs above current price as potential supply zones, again validated by a CHoCH showing a shift in control.
Still, it’s important to remember — these setups are not guarantees. The market doesn’t owe you a fill. Use FVGs and CHoCH as part of the Smart Money framework, not as standalone signals. Always manage risk and make your own trading decisions based on your personal strategy and comfort level.
Final Thoughts
So, what is a Fair Value Gap really? It’s not magic — just the market showing where it moved too fast. Learning to read Fair Value Gaps gives you insight into liquidity, momentum, and potential reversals. Whether you use a Fair Value Gap indicator or mark them by hand, mastering FVG in trading can give you a serious edge in spotting high-probability zones.
Just keep in mind — no indicator or setup replaces good judgment.
Observe, adapt, and let the charts speak for themselves.

Upcoming Gold Correction WaveLong XAUUSD Trading Position on 4H timeframe
Take Profit: 2300.00
SL: 3,886.5
Opportunity of +3,700 Point
🔎 Chart Breakdown
Elliott Wave Context: After the 5-wave impulse, the structure suggests a potential A–B–C correction forming.
Trendlines: Price is currently respecting the long-term ascending support (yellow lines), just newly above the trending channel (red).
Entry Zone: A possible entry has been identified near the lower boundary of the channel, where risk-to-reward is more favourable.
Risk Management: The red zone highlights the invalidation level — if price breaks and closed below, the setup is no longer valid.
Target Projection: A breakout from the channel could trigger a move toward the green zone, aligning with the Take Profit (TP) level, which is inside the last 4H FVG
📊 Trading Plan
Bias: Short-term correction before resumption of trend.
Entry: Near support / channel bottom.
Stop-Loss: Below the invalidation zone.
Take Profit: Toward the upper resistance / green target zone.
⚠️ Note
This is a technical outlook based on my POV to the chart, Elliott Wave structure and support/resistance confluence. Always manage risk carefully and adapt if market conditions change
I would be grateful to get your feedback on this idea if you have any opinions to share.
✽
Improve your awareness to seek a great analysis ⌁↝✔
@AbdullahTech ♾

Bitcoin - Liquidity grab signals further downside!Bitcoin (BTC) is currently in a crucial phase within a broader consolidation structure. After a strong upward move, the price has encountered significant resistance and is showing signs of weakening buying pressure. On the daily chart, it is clear that the price has re-entered the triangle structure after a brief breakout above resistance.
Liquidity Grab
Around $116,000, a clear liquidity sweep can be observed. Above this level, many stop orders and short-position liquidity were clustered. After this liquidity was taken, the price reversed sharply downward — indicating that large market players likely used this move to take profits or open short positions.
Fake-Out from the Triangle Pattern
The breakout above the triangle structure turned out to be a fake-out. Instead of holding above the trendline for confirmation, the price quickly fell back within the formation. This indicates buyer weakness and strengthens the bearish scenario. A fake-out above a consolidation pattern often leads to a move in the opposite direction — toward the lower boundary of the structure.
Daily FVG
The current candle is positioned within an important daily Fair Value Gap (FVG). If the daily close remains as it is, this bullish FVG will convert into a bearish FVG, meaning the area will now act as resistance. This suggests that bears are taking control and further downward price action is likely.
Target
After an upward fake-out that collects liquidity, price often moves to the opposite side of the pattern. In this case, that would be the lower side of the triangle. A drop toward $103,000–$104,000 is therefore the most likely scenario. This zone aligns with previous structural support and can serve as a logical target area.
Conclusion
Bitcoin is showing clear signs of exhaustion near the top of the range. The liquidity grab and fake-out from the triangle reinforce the bearish outlook. With the daily FVG flipping bearish and bullish momentum fading, a move down toward the $103,000–$104,000 zone appears to be the most probable next step — unless BTC unexpectedly manages to close above the FVG.
-------------------------
Thanks for your support. If you enjoyed this analysis, make sure to follow me so you don't miss the next one. And if you found it helpful, feel free to drop a like 👍 and leave a comment 💬, I’d love to hear your thoughts!

Bitcoin - Will the bears push the price towards $104.000?Introduction
Bitcoin is currently in a phase of consolidation following the recent sharp decline. For several days, the price has been forming a symmetrical triangle, indicating increasing tension between buyers and sellers. This phase is often seen as a period of preparation for a larger move. However, clear bullish momentum is still lacking, which increases the risk of a downward breakout.
Triangle pattern
The price is moving within a triangle pattern, where the highs are decreasing and the lows are slightly rising. This suggests a compression of liquidity and declining volatility. The upper boundary of the pattern acts as dynamic resistance, while the lower boundary serves as support. Once the price breaks out of this structure, the direction of the next major move will likely be determined. For now, the price seems trapped between these two key levels.
Liquidity at the top with the bearish 4h FVG tested
Yesterday, the upper side of the structure was tested, just above the 4-hour bearish Fair Value Gap (FVG). In that area, liquidity from previous highs was also located. The price reacted with a strong rejection and quickly fell back. This reaction confirmed that sellers still have control and that demand has weakened. The signal indicates that the market is struggling to break above $114,000.
4h bearish FVG
The 4-hour bearish FVG is located between approximately $108,600 and $111,300. This zone now serves as a key resistance area. Each time the price touches this region, selling pressure increases, limiting further upside movement. As long as this zone is not convincingly broken with volume, the short-term trend remains bearish. A breakout above this level could open the door to higher targets.
Liquidity area at the bottom
At the lower end of the triangle, there is a clear liquidity area around $103,500. This is where stop-losses from long positions and potential buy orders from large players are located, waiting for a liquidity grab. If the price moves into this area, a short wick downward could occur before a potential bounce takes place. Therefore, this level is important to monitor in case of a downward breakout.
Conclusion
BTC still shows no signs of strength. The rejection from the 4-hour bearish FVG above the liquidity zone points to a lack of buying interest. As long as the price remains within the triangle and trades below $113,000, the likelihood of a downward move remains higher. Only a convincing breakout above the upper boundary could temporarily improve market sentiment. Until then, the bears remain in control, with focus on the support around the lower liquidity zone.
-------------------------
Thanks for your support. If you enjoyed this analysis, make sure to follow me so you don't miss the next one. And if you found it helpful, feel free to drop a like 👍 and leave a comment 💬, I’d love to hear your thoughts!

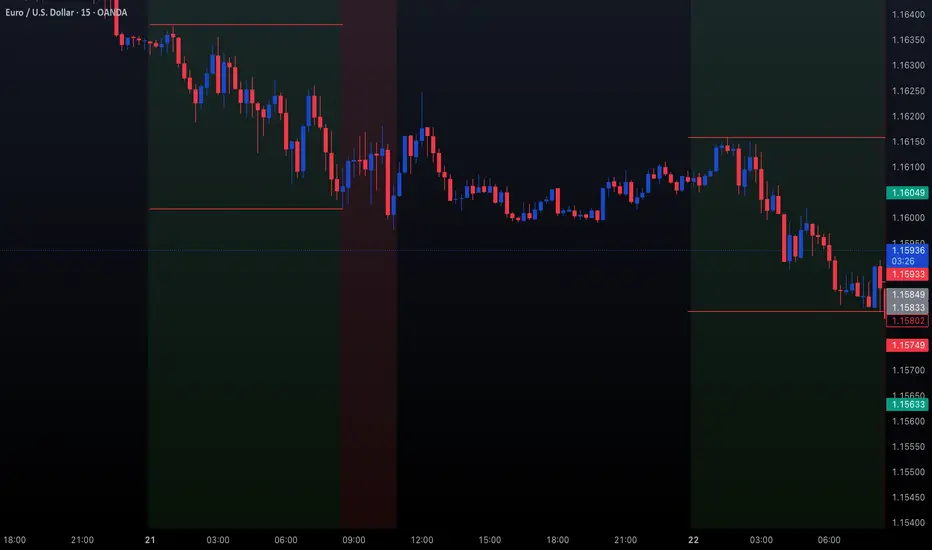
Trading EURUSD | Judas Swing Strategy 22/10/2025The Judas Swing strategy continues to show how patience and structure can consistently produce high-probability setups. Yesterday FX:EURUSD offered a clear example of how the market manipulates early liquidity before revealing its true move.
Heading into 08:30EST, price had been trading in a tight range throughout 00:00 - 08:30EST. Our attention was on the highs and lows, key zones that often set the stage for the Judas Swing’s liquidity sweep.
Price ran below the low at 08:35EST, taking out liquidity resting beneath those lows. This was our first signal, a potential false move designed to trap early sellers. Once that downside sweep occurred, we shifted our focus to the upside looking for buys. The key confirmation came shortly after with a clean break of structure to the upside, showing that momentum was reversing. At this point, all we needed was patience. We waited for price to retrace into the fair value gap (FVG) formed during the impulsive move up.
Once price tapped into the imbalance, we executed our long position with 1% risk, targeting a 2% reward. Initially, the market dipped slightly below our entry, testing our patience but our stop was well-placed beneath the liquidity sweep, giving the trade enough room to breathe
Within minutes, the bullish momentum kicked in. The move from discount pricing quickly turned into a strong rally as price reclaimed the earlier range and pushed firmly into premium levels.
Our target was hit decisively, delivering a +2R return in just an hour and 45 minutes. A clean execution, following the exact sequence of events the Judas Swing strategy thrives on:
1. Liquidity sweep
2. Break of structure
3. Retrace into FVG
This trade was a perfect reminder that discipline and structure always win. It’s easy to get tempted by early entries or impulsive setups, but the Judas Swing strategy continues to show that following your rules pays off
AVNT Bullish Reversal / Accumulation Entry on the 2H macro phase.
2H Manipulation phase (0.7258 - 0.4316) is confirmed as {COMPLETE}. Price is now in the high-probability {Accumulation} phase—the institutional setup for a massive directional shift.
ENTRY CONFLUENCE (UNICORN MODEL)
MAIN ENTRY 0.5007
exact boundary of the 30m FVG (0.5007 - 0.4990), strategically placed for optimal mitigation and nested within the 30m Breaker Block for supreme structural support.
SL 0.4866 (Placed below the 30m Breaker Block for absolute invalidation control

Price Doesn’t Move Randomly: It Hunts Liquidity1. Introduction
Every trader starts by learning “supply and demand.”
Sounds logical: buyers push price up, sellers push it down.
But that’s not how it really works.
Price doesn’t move because of demand.
It moves toward liquidity — where orders exist.
The market’s goal is simple: find liquidity, fill it, and move on.
2. What Is Liquidity?
Liquidity is the pool of pending orders sitting on the chart — stop losses, limit orders, and resting positions.
Think of them as magnets.
Above highs: stop losses from shorts.
Below lows: stop losses from longs.
Around major levels: limit orders waiting to be filled.
Institutions and large players can’t just “market buy” or “market sell” huge positions — they need liquidity to fill them efficiently.
So, price hunts it.
3. The Game of Stop Hunts
You see it all the time:
A breakout above resistance → instant reversal.
A sweep below support → immediate bounce.
That’s not coincidence — that’s a liquidity grab.
Big players push price to trigger stop losses, collect those orders, and then reverse in the true direction.
Retail traders call it “manipulation.”
Smart traders call it “the business model.”
4. How to Read It
Stop focusing on predicting direction — start identifying where liquidity sits.
Look for:
Equal highs/lows → obvious stop clusters.
Clean levels that everyone sees → perfect trap zones.
FVGs or inefficiencies → likely rebalance points post-hunt.
Instead of asking “where will it go,” ask “who’s trapped?”
5. Takeaway
The market isn’t random. It’s strategic.
Every wick, every fake breakout, every stop hit — it all serves one purpose: to find liquidity.
Stop trying to predict the next candle.
Start understanding why the candle exists.
Price hunts liquidity — not logic.
EUR/USD forms a daily range after reacting to the weekly key levThe price is reacting to the weekly key level and is forming a daily range with new structural zones. On the daily chart, we can see a break of the D FVG, which indicates the strength of the sellers. However, the price is moving into discount areas, which by themselves are zones of buyers’ interest. The key factor will be the daily candle close — if it closes above the 0.5 level of the range, it will indicate that the range has been balanced, and we can start considering long positions.

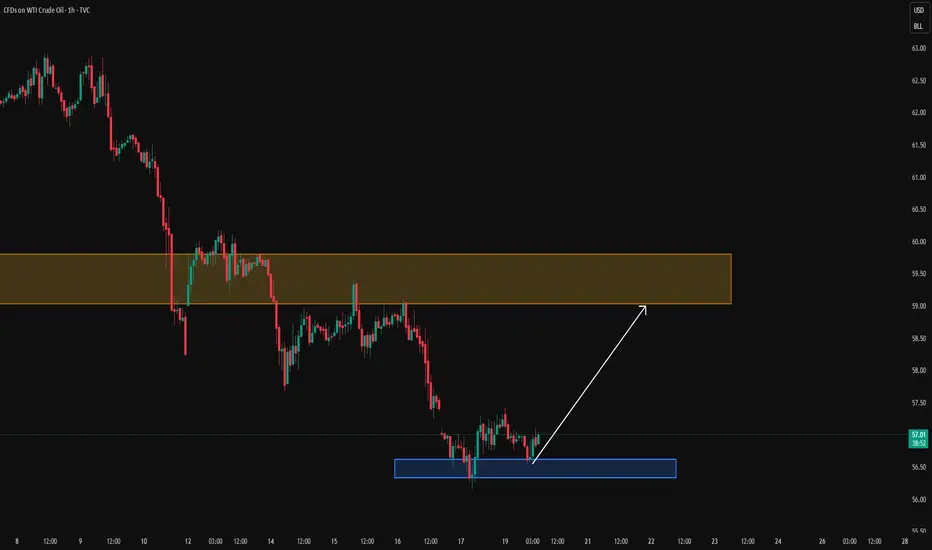
USOIL: Buy setups during higher-timeframe correctionOIL PRICE WEEKLY OUTLOOK
(Week of Oct 20-24, 2025)
Key Drivers & Risks
Updates in Supply, Demand, and Geopolitical News
EIA (week ending Oct 10): Crude inventories +3.5 million bbl; distillates −4.5 million bbl.
IEA OMR (Oct 2025): Upgraded global supply forecast: +3.0 mb/d in 2025 and +2.4 mb/d in 2026, while demand grows only ~0.7 mb/d per year ⇒ signaling a large surplus risk and downward pressure on prices.
OPEC (Oct 2025): Maintains demand growth outlook of +1.3 mb/d for 2025, but acknowledges a smaller deficit in 2026 as OPEC+ output rises; September production increased by ~630 kb/d.
Maritime risk in the Red Sea / Gulf of Aden: Over the weekend, a gas carrier reportedly caught fire following a possible attack off Yemen’s coast, leading to higher shipping risk premiums, though no major disruption to trade flows has been reported yet.
Watchlist for the Week Ahead
EIA Weekly Report (Oct 22): Focus on crude and distillate inventories, and any signs of policy or flow adjustments.
Maritime security updates in the Red Sea / Gulf of Aden / Strait of Hormuz — monitor frequency and severity of incidents.
China data: imports, refinery runs, and inventories — potential signals of stockpiling at lower price levels.
Any notable demand-side surprises (if any emerge).
Overall View
Oil prices are expected to gradually decline within a relatively narrow range of $70–$50 through mid-2026.
Short-term rebounds may occur due to low price levels and heightened transport risk headlines.
China’s potential restocking activity could provide limited demand-side support.
* Trend: assessed using at least three trend indicators, with market structure as the primary guide.
** Weak or Reversal Signals: Assessed based on one of our criteria for trend reversal signals.
*** Support/Resistance: Selected from multiple factors – static (Swing High, Swing Low, etc.), dynamic (EMA, MA, etc.), psychological (Fibonacci, RSI, etc.) – and determined based on the trader’s discretion.
**** Our advice takes into account all factors, including both fundamental and technical analysis. It is not intended as a profit target. We hope it can serve as a reference to help you trade more effectively. This advice is for informational purposes only and we assume no responsibility for any trading results based on it.
George Vann @ ZuperView
DXY AnalysisOn the weekly chart, the price has formed a new trading range. We mark it out and move down to the daily timeframe.
After the correction, the price reacted from an inefficiency zone, showing buyer interest.
At the moment, I’m considering two bullish scenarios:
1️⃣ An impulsive breakout of the daily FVG zone followed by an expansion of the current range.
2️⃣ A reaction from the FVG zone, then a sweep of Friday’s low, after which the price could resume its upward movement.
I see the second scenario as more likely, as it would allow the market to collect liquidity before continuing higher.

Top-Down Analysis Strategy: How I Open and Manage TradesLearn how I use top-down analysis from senior to junior timeframes to find high-probability entry points and confidently follow through on trades.
On the weekly chart, I identify point A and the presumed point B — this is my idea. Then, gradually shifting through the timeframes, I need to confirm this idea. I get confirmation when volume appears on the chart.
On the daily chart, I note the formation of a new trading range, which arises as a result of the interaction of the price with the key level. I determine the POI in the form of a daily FVG — my idea is confirmed, and the price is ready to move towards point B.
I also note the daily SNR as a potential zone of interest. If the price reacts to the SNR, it will mean that I am working in a strong trend. If the reaction occurs on the FVG, the movement simply continues along the trend.
If you are interested in the topic of working in ranges, write in the comments — I will definitely cover it.
As a result of the daily SNR test, the price confirms the presence of volume through the formation of a 4-hour True SNR. You can open a position from it with a limit order with a target beyond point B and fix the risk/profit ratio at 1:2.
If you found this article interesting and my method useful, I would appreciate your support — please like, share, and help promote this article so that it reaches more traders.

Bitcoin - First Signs of the Bear AwakeningBitcoin recently swept the previous all-time high, taking liquidity from the major external range. After that sweep, price reacted sharply downward, leaving behind a significant daily imbalance. This gap is now acting as resistance, with clear rejection seen on the daily timeframe. The move signals exhaustion from buyers and an early sign that the market could be preparing for a deeper retracement phase.
Consolidation Structure
Following the rejection, Bitcoin is moving within a short-term consolidation range, sitting between the daily imbalance above and a major demand zone below. This structure represents indecision as the market transitions from expansion to a potential reaccumulation or redistribution phase. The large wick left behind during the last drop suggests that liquidity was collected below the previous range, but it remains unfilled, hinting at unfinished business in that area.
Bullish Scenario
In the short term, a bounce from the lower zone could play out as the market attempts to correct the imbalance. This would align with a 50% fill of the previous large wick, providing the liquidity needed before resuming any sustained downside movement. If buyers manage to reclaim control temporarily, the move would likely target the unfilled 4-hour gaps sitting above current price.
Bearish Scenario
However, any upside reaction is expected to face resistance at the daily imbalance. Once those 4-hour gaps are filled, the likelihood of another rejection increases. If that rejection confirms, it could trigger a larger selloff targeting the strong support area below, where the next round of liquidity rests. The reaction from that zone will determine whether the market continues lower or begins forming a new base for accumulation.
Price Target and Expectations
The ideal flow would see Bitcoin dip to fill 50% of the large wick, find temporary support, then stage one final bounce into the 4-hour imbalance zone before resuming its bearish leg. This structure keeps the overall narrative intact, combining liquidity behavior with efficient price delivery.
Conclusion
Bitcoin’s current setup remains technically balanced between two key inefficiencies. A short-term bounce is likely before continuation lower, with the daily gap rejection acting as the main pivot point in this structure. Until the wick fill and 4-hour gaps are resolved, the path of least resistance remains to the downside.
___________________________________
Thanks for your support!
If you found this idea helpful or learned something new, drop a like 👍 and leave a comment, I’d love to hear your thoughts! 🚀

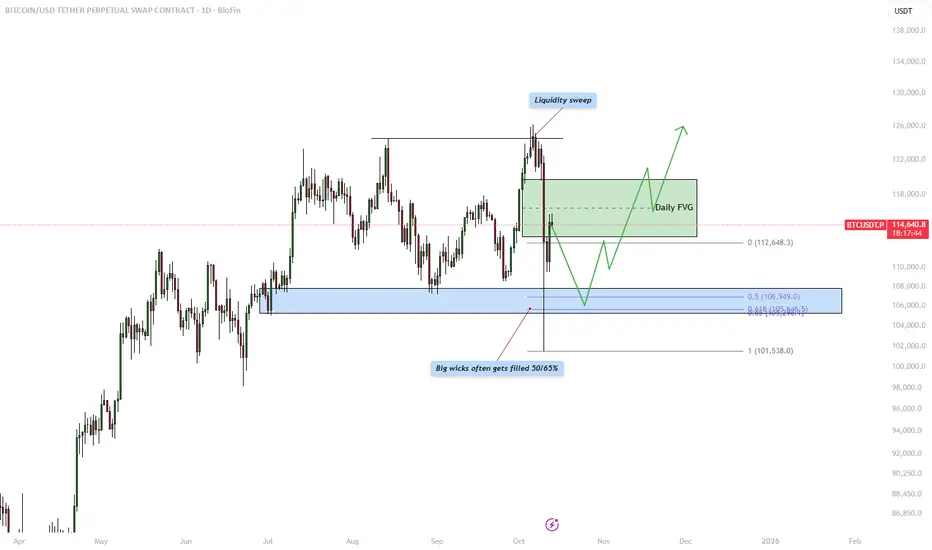
Bitcoin - What to expect from this week?Introduction
This analysis examines the recent price behavior of Bitcoin against USDT on the daily timeframe. The chart highlights several key technical concepts, including a liquidity sweep at the highs, a daily Fair Value Gap (FVG) acting as resistance, and the likelihood of a wick fill within a major imbalance zone. Together, these elements provide valuable insight into how institutional traders may be engineering liquidity and preparing for the next significant move. Understanding these areas can help traders anticipate high-probability reaction zones and better align with the market’s underlying structure.
Liquidity sweep
The market recently executed a liquidity sweep above previous swing highs, triggering buy stops and attracting breakout traders into the move. This sudden push to the upside was quickly rejected, signaling that smart money likely used this moment to gather liquidity and distribute positions. Liquidity sweeps often serve as the market’s way of collecting orders before a reversal or retracement, indicating that the bullish momentum may be temporarily exhausted. This event sets the stage for price to rebalance inefficiencies left behind during the rapid move.
Daily FVG resistance
Following the liquidity sweep, price left behind a clear daily Fair Value Gap, which represents an area of imbalance caused by strong displacement. This gap often acts as resistance, where price is expected to return and mitigate before potentially continuing lower. The FVG provides an ideal area for institutional traders to reposition, as it offers a point of confluence between inefficiency and structure. If price reacts bearishly within this zone, it would strengthen the bearish outlook and suggest a continuation toward lower levels.
Wick fill
The large wick seen during the recent sell-off is an important feature of this chart. Historically, big wicks tend to get filled by 50% to 65%, reflecting the market’s tendency to rebalance inefficiencies over time. The marked blue zone below shows where this fill is most likely to occur. This zone aligns closely with previous support levels and Fibonacci retracement levels, further reinforcing it as a potential area of interest. A wick fill into this region could provide liquidity for future bullish movement, allowing the market to establish a more solid foundation for the next impulsive leg upward.
Conclusion
In summary, the current daily structure of Bitcoin suggests that price has completed a liquidity sweep at the highs and is now in the process of rebalancing inefficiencies through a possible retracement. The daily Fair Value Gap above serves as a critical resistance zone where sellers may re-enter, while the wick fill area below marks a high-probability target for price to revisit before establishing new direction. Traders should monitor how price reacts to these two regions, a rejection from the FVG coupled with a move toward the wick fill zone could signal the next significant swing opportunity. In this environment, patience and precision are key, as the market seeks equilibrium before its next major directional move.
-------------------------
Thanks for your support. If you enjoyed this analysis, make sure to follow me so you don't miss the next one. And if you found it helpful, feel free to drop a like 👍 and leave a comment 💬, I’d love to hear your thoughts!
GOLD (XAUUSD) – Smart Money Setup | Bullish Outlook Above 3985 Price is currently trading near a key FVG & Demand Zone (Fib 0.5–0.618), showing signs of potential bullish reversal.
If the structure holds above 3985–3970, buyers could target the Weekly High at 4059 after reclaiming the Previous Day High (4022).
Analysis Highlights:
HTF Bias: Bullish – Rejection from demand + liquidity sweep.
Key Levels:
Support: 3985 / 3970 / 3947
Resistance: 4022 / 4059
Trade Idea: Waiting for liquidity grab → bullish CHoCH → entry confirmation.
Target Zones: 4022 → 4059
Invalidation: Break and close below 3947 zone.
