DXY FRGNT Daily Forecast -Q4 | W47| D21 | Y25 |📅 Q4 | W47| D21 | Y25 |
📊 DXY FRGNT Daily Forecast
🔍 Analysis Approach:
I’m applying Smart Money Concepts, focusing on:
Identifying Points of Interest on the Higher Time Frames (HTFs) 🕰️
Using those POIs to define a clear trading range 📐
Refining those zones on Lower Time Frames (LTFs) 🔎
Waiting for a Break of Structure (BoS) for confirmation ✅
This method allows me to stay precise, disciplined, and aligned with the market narrative, rather than chasing price.
💡 My Motto:
"Capital management, discipline, and consistency in your trading edge."
A positive risk-to-reward ratio, paired with a high win rate, is the backbone of any solid trading plan 📈🔐
⚠️ Losses?
They’re part of the mathematical game of trading 🎲
They don’t define you — they’re necessary, they happen, and we move forward 📊➡️
🙏 I appreciate you taking the time to review my Daily Forecast.
Stay sharp, stay consistent, and protect your capital
— FRNGT 🚀
TVC:DXY
Gann

AUDUSD FRGNT FUN COUPON FRIDAY Forecast - Q4 | W47| D21 | Y25 |📅 Q4 | W47| D21 | Y25 |
📊 AUDUSD FRGNT Daily Forecast
🔍 Analysis Approach:
I’m applying Smart Money Concepts, focusing on:
Identifying Points of Interest on the Higher Time Frames (HTFs) 🕰️
Using those POIs to define a clear trading range 📐
Refining those zones on Lower Time Frames (LTFs) 🔎
Waiting for a Break of Structure (BoS) for confirmation ✅
This method allows me to stay precise, disciplined, and aligned with the market narrative, rather than chasing price.
💡 My Motto:
"Capital management, discipline, and consistency in your trading edge."
A positive risk-to-reward ratio, paired with a high win rate, is the backbone of any solid trading plan 📈🔐
⚠️ Losses?
They’re part of the mathematical game of trading 🎲
They don’t define you — they’re necessary, they happen, and we move forward 📊➡️
🙏 I appreciate you taking the time to review my Daily Forecast.
Stay sharp, stay consistent, and protect your capital
— FRNGT 🚀
OANDA:AUDUSD

LongAccording to the analysis of the waves and the help of the Gann method, it can be expected that the price will return to the green zone again.
This is my personal opinion. Please don't use it as your trading criteria. Good luck

Geopolitical Risks: US-China, Middle East, and Russia-Ukraine1. US–China Strategic Rivalry
The US–China geopolitical competition is the single most important strategic rivalry of the 21st century. It extends far beyond military issues and deeply penetrates technology, supply chains, trade policies, cyber security, and political influence.
A. Trade and Economic Decoupling
Since 2018, the US and China have been locked in a trade war that has evolved into a broader process of economic decoupling. The US seeks to reduce its dependency on China in areas such as:
Semiconductors
Critical minerals
Electric vehicle batteries
Pharmaceuticals and APIs
Artificial intelligence and telecommunications
Tariffs, sanctions, and export controls have disrupted global supply chains. Many companies are pursuing “China+1” strategies by shifting production to India, Vietnam, and Mexico. However, true decoupling remains complicated because China is deeply integrated into global manufacturing.
B. Technology War and the AI Race
Technology is at the core of the rivalry. The US is restricting China’s access to:
Advanced semiconductor equipment
AI chips
Quantum computing technologies
Meanwhile, China accelerates investment in self-sufficiency through initiatives like “Made in China 2025” and its national AI strategy. The global tech ecosystem is splitting into two competing blocs, affecting equipment standards, supply networks, and cybersecurity frameworks.
C. Taiwan and Military Tensions
Taiwan remains the most explosive flashpoint. China considers Taiwan a breakaway province and has intensified military activities around the island. The US supports Taiwan’s defense through arms sales and political backing. Any major escalation could disrupt:
Global semiconductor supply (TSMC)
East Asian shipping lanes
Global equity markets
Even minor incidents raise volatility across global markets.
D. Geopolitical Influence in Asia and the Global South
Both nations compete for influence:
The US strengthens alliances through Quad, AUKUS, NATO partners, and Indo-Pacific initiatives.
China expands influence via Belt and Road (BRI) investments, infrastructure financing, and strategic partnerships with Africa, the Middle East, and Latin America.
This rivalry affects voting patterns at the UN, trade agreements, and global governance systems.
Overall, the US–China rivalry increases strategic uncertainty, reshapes supply chains, and compels nations to navigate between two superpowers.
2. Middle East Geopolitical Risks
The Middle East remains a region of enduring conflict, energy dependency, and shifting alliances. Three major developments define current risks:
A. Israel–Palestine and Regional Escalations
The conflict between Israel and Palestinian groups has intensified after recent escalations. The risk lies in the potential regionalization of the conflict involving:
Hezbollah (Lebanon)
Iran
Syria
US interests in the region
Any escalation could disrupt vital energy corridors, oil shipments, and global market stability.
B. Iran–US Tensions and the Gulf
Iran’s nuclear ambitions and proxy networks in Iraq, Yemen, and Lebanon create persistent risk. The Strait of Hormuz—through which 20% of global oil passes—remains one of the most vulnerable chokepoints in the world. Threats to tanker traffic can cause immediate spikes in oil prices.
The US maintains its military presence to secure maritime routes, while Gulf states diversify politically and economically to reduce vulnerability.
C. Saudi Arabia’s Strategic Realignment
Under Vision 2030, Saudi Arabia is diversifying its economy and recalibrating its global alliances:
Improving ties with China
Balancing relations with the US
Leading OPEC+ production strategies
Mediating regional disputes
Saudi Arabia’s decisions on oil output influence global energy markets and inflation trends.
D. Fragmentation and New Alliances
The Middle East is witnessing a major geopolitical reconfiguration:
Abraham Accords brought some Arab countries closer to Israel.
Turkey is becoming more assertive in the Eastern Mediterranean.
China has brokered surprise diplomatic agreements (e.g., Saudi–Iran rapprochement).
These shifts illustrate rising multipolarity, reducing the dominance of Western diplomatic frameworks.
In short, the Middle East remains a source of energy risk, regional power struggles, and global market volatility.
3. Russia–Ukraine War
The Russia–Ukraine conflict is the largest military confrontation in Europe since World War II and has deep global consequences.
A. Energy Shock and Global Commodity Markets
The war triggered massive disruptions in:
Natural gas supply to Europe
Crude oil markets
Fertilizer exports
Grains (Ukraine and Russia are major wheat exporters)
Europe accelerated its shift toward renewables and alternative gas supplies, but global energy markets remain sensitive to military developments.
B. Sanctions and Financial Fragmentation
The US, EU, and allies have imposed comprehensive sanctions on Russia. This has:
Restricted Russia’s access to global banking networks
Frozen central bank assets
Limited technology and military imports
Forced Russia to redirect oil to China and India
Global finance has become more fragmented, accelerating the creation of alternative payment systems such as:
China’s CIPS
Russia’s SPFS
Local-currency trade agreements
This undermines the dominance of the US dollar over the long term.
C. Military Escalation and NATO Expansion
The conflict has reshaped European security:
Finland and Sweden joined NATO
Eastern Europe increased defense budgets
The US reinforced military presence in Europe
Russia has strengthened ties with China, Iran, and North Korea, forming an alternative geopolitical camp.
D. Long-Term Economic Impact
Ukraine’s infrastructure has suffered devastating damage, while Russia faces prolonged isolation. Global investors now factor geopolitical risk into investment decisions, especially in Europe.
The war also accelerates trends such as:
Defense industry investment boom
Energy transition
Rerouting of global commodity flows
The Russia–Ukraine war marks a major shift toward long-term confrontation between Russia and Western powers.
Conclusion
US–China rivalry, Middle East volatility, and the Russia–Ukraine conflict collectively define a new era of global uncertainty and multipolar competition. These conflicts disrupt supply chains, raise commodity prices, accelerate military spending, and reshape global alliances. The world is transitioning from unipolarity (US dominance) to a multipolar order where regional powers assert greater influence. Nations and businesses must navigate these risks carefully, as geopolitics will continue to drive market behavior, trade flows, and strategic decisions in the decade ahead.

I will be going long on gold after the market opens.Are youreadyGold prices remained relatively stable this week, offering traders some room for maneuver. This week, after reaching a high of 4132, gold prices fluctuated between 4000 and 4110, showing greater stability compared to the previous volatile market. This provided favorable conditions for implementing trading strategies, and several short-selling operations during this period also achieved the expected results.
From a weekly chart perspective, the chart shows a doji pattern, indicating that the forces of bulls and bears are relatively balanced in the short term, lacking a clear one-sided trend, suggesting that investors are generally cautious. Historical data shows that Fridays are often prone to price fluctuations, so it is necessary to remain vigilant about risk management. Looking at the hourly chart, prices have entered a key support/resistance zone, currently trading near the Bollinger Band's middle line. If it can effectively hold this position, it is expected to retest the resistance levels of $4090 and $4100. In terms of trading strategy, it is recommended to place long orders in batches within the 4050 to 4070 range after the market opens, and closely monitor market dynamics. If there are any further changes, we will promptly notify you of any adjustments to the plan.
The above are my personal thoughts! If they are helpful to you or you agree with my ideas, please like and follow to support me! All strategies have a limited lifespan, so while referring to them, you should also closely monitor market changes. I will also respond flexibly according to actual market fluctuations, and I will announce the specifics in the channel!

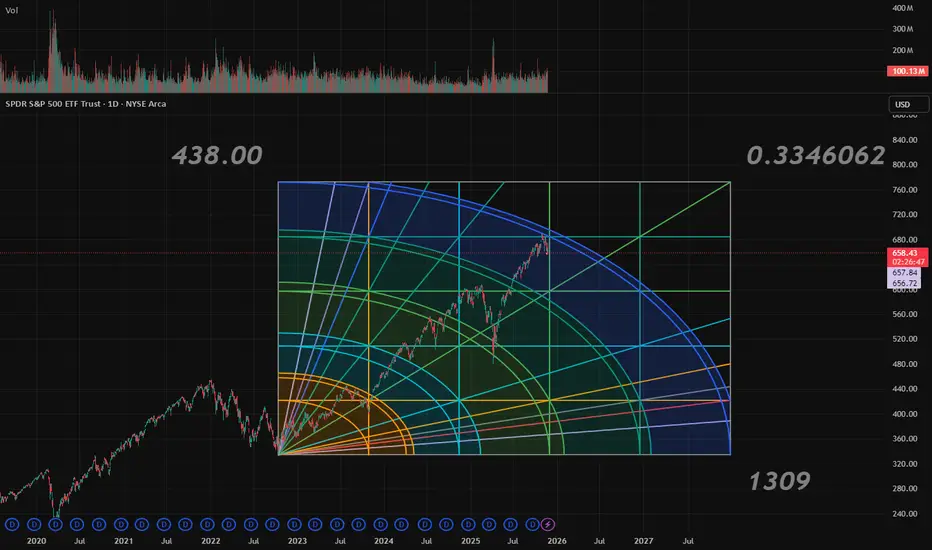
The end - 2026 Financial panicSince 2300, I’ve marked a zone and made a personal commitment: no matter what happens in the market, when this zone is approached, I will begin reducing my exposure and carefully exit all financial markets—with extreme caution and tight stop losses.
Yesterday, I received an alert I never expected to see. It signaled the approach of the zone I identified back in 2021 as the escape point—where major crashes are likely imminent and the urge to invest must be resisted.
This zone aligns with the 0.786 trend-based Fibonacci level from the 2009 bottom to the 2020 peak, as well as the April 2020 bottom. It also coincides with the 2.618 and 3.618 Fibonacci extensions from the 2007–2010 cycle, and the 3.618 trend Fibonacci from the 2002–2009 cycle. But that’s not all.
According to Gann’s Square of 9, if you examine closely, you’ll notice that whenever the trend reaches one of its primary or secondary angles since the 2009 bottom, it consistently triggers a significant drop. The end cycle at the 360° angle corresponds to 7926—perfectly aligning with all the previously mentioned Fibonacci zones.
And for those skeptical of technical analysis, consider this: the upcoming year, 2026, is a pivotal year in the Samuel Benner chart developed in 1875 to identify periods of financial disorder. Benner’s chart indicated when to buy, when to sell, and when to expect chaos. Remarkably, it has accurately forecasted major financial crashes over the past 150 years—including the Great Depression, the Dot-Com bust, and the 2020 COVID crash. According to this chart, selling during the crash year and re-entering post-crash has historically led to profitable outcomes with a +-2 Years at a 87.5% accuracy.
When you combine all these signals, it feels reckless not to take them seriously—especially since this marks the end of a cycle measured from 2009. That’s how significant it is.
To those who dismiss technical analysis, this may sound like smoke and mirrors. But for those who’ve seen its power firsthand, the sheer number of confluences here is too substantial to ignore. If I know such big crash may happen - I would be happy to wait 1-2 years on cash and take opportunity of big red markets to buy.
Curious to hear your thoughts on this.

#BTCUSD #Bitcoin Buy Setup🔼#BTCUSD #Bitcoin #Crypto Buy Setup
Currently Trading At 88564 , Buy On Dip Around 85916 And More Only At 83571 If Comes for The Target 95380—-104400

BTC END OF A LEGENDARY ERA.BTC — End of a Legendary Era
A decisive break of long-term support signals a major shift in Bitcoin’s market structure. Momentum has shifted, confidence is waning, and the chart suggests the end of an era that has defined the crypto market for years.
THE END.

I'm planning to go long on gold in the 4045-4065 range!This week, the gold market exhibited a generally volatile and consolidating pattern, offering traders some room for maneuver. Gold prices initially surged to a high of $4132 at the beginning of the week, but subsequently failed to maintain their upward momentum, gradually retreating and entering a range-bound consolidation phase, primarily fluctuating between $4000 and $4110. Compared to previous weeks' volatile price movements influenced by macroeconomic data or geopolitical situations, this week's trend was more moderate and orderly, with narrower fluctuations, weaker trends, and a relatively controllable overall pace. This volatile market provides numerous opportunities for short-term traders, especially with the high-sell-low-buy strategy proving particularly effective between key support and resistance levels. Some investors have successfully captured pullbacks and achieved ideal returns by accurately timing their short positions and decisively placing short orders in areas where prices encounter resistance during rebounds.
From a weekly technical perspective, this week's candlestick closed as a doji with upper and lower shadows. This signal typically indicates a short-term balance between bullish and bearish forces, with neither buyers nor sellers holding a clear dominant position. Based on an analysis of the recent global financial market environment, there is currently a lack of major driving factors sufficient to propel gold in a clear direction. On the one hand, inflation data from major economies are gradually stabilizing, and monetary policy expectations are becoming more moderate, reducing gold's short-term appeal as a safe-haven asset. On the other hand, while geopolitical risks still exist, they have not escalated to the point of triggering widespread risk aversion. Therefore, market participants are generally adopting a wait-and-see attitude, making it difficult for gold prices to form a sustained breakout.
It is worth noting that reviewing historical trends over the past few months reveals that the gold market often experiences sudden fluctuations at the end of the week, especially on Fridays. Examples include rapid rises or falls after the release of non-farm payroll data, or technical breakdowns caused by unexpected events. This "Friday effect" increases the risk of holding positions over the weekend. Therefore, even if the current market appears stable, traders need to remain highly vigilant, manage their positions reasonably, and set stop-loss orders to guard against potential unexpected fluctuations.
From the hourly chart, the short-term gold price has reached a key technical juncture—the so-called "bullish/bearish dividing line." Currently, the price is fluctuating narrowly around the middle Bollinger Band. This area is not only a convergence zone of short-term moving averages but also a significant psychological level that has been tested multiple times previously. As an important tool for measuring market volatility, the narrowing of the Bollinger Bands indicates that the market is currently in a low-volatility phase, suggesting a potential directional move. If the gold price can effectively hold above the middle band, accompanied by a moderate increase in trading volume, it may resume its upward trend, with the next target potentially pointing to the key resistance area of $4090 or even $4100. Conversely, if it fails to hold this support level and breaks below the lower band, it may resume its downward correction, testing even lower support levels.
Based on the current technical structure and market sentiment, the recommended trading strategy is to establish long positions in batches within the $4045 to $4065 range after the market opens.
The above are my personal thoughts! If they are helpful to you or you agree with my ideas, please like and follow to support me! All strategies have a limited lifespan. While referring to them, it's also important to closely monitor market changes. I will respond flexibly based on actual market fluctuations, and I will provide specific updates in the channel!

$SPY analysis that was made by me in april of 2024in the picture you can see how spy hit the tool i perfected after a year and a half of wait, i believe we are about to experience a really big drop, speaking from a long term view of the stock market
USDCHF I Daily CLS I Model 1 I Key Level - OBHi friends, new range created. As always we are looking for the manipulation in to the key level around the range. Don't forget confirmation switch from manipulation phase to the distribution phase to make the setup valid. Stay patient and enter only after change in order flow. If price reaches 50% of the range take partial or full close.
🧩 Complete proces and Strategy explained 👇 Click Below
🎯 Why your market approach also should be mechanical ?
NO Fixed Mechanical Trading Logic - You are guessing random patterns
NO Defined trading plan - Every trade different logic
NO Same logic in each trade - Not possible to backtest
NO Backtests on at least 300 trades - Not knowing Statistics
➡️ No Statistics ➡️ No Edge ➡️ Mindset ProblemS
🧠 Core of mindset problems
If you don't know your statistics on large enough data sample. You don't know your probabilities of win rate once the losing streak happen and it happens to every strategy. You will start doubting, hesitating to take next trade because you don't know statistics of your losses. In the end you will be doubting strategy and then jump to different one. You will be in the endless loop for years, looking for new better strategy. 👊 Your ultimate goal as a trader is not to be a generalist who knows 10 000 patterns. But rather create one system with narrowed criteria of each element of the trade to remove subjective and emotional decisions as much as possible and stick to this system no matter what. Practice it 10 000 times become a MASTER.
✨ Trading Mastery is reflection of your life
Have a longterm plan, No Alcohol & Drugs, Ignore others, Focus on your journey , Backtest regularly, Review your weeks, Journal mistakes, Exercise, Sleep well, Read books, Walks in nature (no phone) , Meditate, Reduce social media time, Spend time with family, Live Life.
Trading is hard, but not impossible. I believe in you 💪
David Perk aka Dave Fx Hunter

another victory added to the winstreekmtops-ai's forecast nailed it yet again
this one was a little harder than usual as the higher time frame is still towards the end of an already long transition
the lesson for me is to trust mtops-ai, as it knows the market better than any human ever could


XAUUSD: Market Analysis and Strategy for November 20thGold Technical Analysis:
Daily Resistance: 4150, Support: 4000
4-Hour Resistance: 4110, Support: 4015
1-Hour Resistance: 4085, Support: 4040
Technically, yesterday's daily chart closed with a "gravestone doji" candlestick. The resistance in the 4135/4150 area remains strong in the short term. The effectiveness of the 4040 support level needs to be monitored today. Meanwhile, the 4000 psychological level is being tested. A break below this level would warrant a short-term sell-on-trend move. Conversely, if the price recovers above 4100 in the short term, a buy-on-trend move would be appropriate, with the 4220/4250 area as a potential resistance level. The recent Fed minutes have brought the market back from its "interest rate cut euphoria" to reality: inflation remains the primary enemy, and interest rate cuts are not easily implemented. The foundation of gold's super bull market (low interest rates + strong safe-haven demand) is weakening, and short-term bulls need to be prepared for a rollercoaster ride.
Based on the 1-hour chart, gold prices fluctuated downwards during the European session, with the price action within a downward channel. After breaking below 4080, the short-term trend is likely to continue. Watch the MACD/KDJ indicators for bearish momentum.
Trading Strategy:
BUY: 4005~4000
SELL: 4085near
SELL: 4106near
More Analysis →

ETH / USDT (4H Timeframe)Pattern: Break of Structure + Retracement Into Major Supply Zone + Short Continuation Setup
The chart shows Ethereum forming a clean bearish structure with repeated Breaks of Structure (BOS) as sellers continue dominating the 4H timeframe. Price is currently pulling back toward a major supply zone, where strong institutional selling previously stepped in. This retracement is likely setting up a continuation to the downside.
Key Observations
🔹 Confirmed Bearish Structure:
ETH has printed multiple BOS levels, signaling that sellers remain firmly in control.
🔹 Major Supply Zone ($3,170–$3,143):
A strong supply block highlighted on the chart.
This is where ETH previously saw heavy sell pressure, creating an ideal zone for a bearish retest.
🔹 Retracement Before Rejection:
Price is currently climbing toward the supply zone, following the dotted bullish retracement path shown.
🔹 Liquidity Grab Potential:
The dotted move into supply suggests ETH may sweep short-term liquidity before reversing down.
🔹 Precise Downside Targets:
The chart clearly marks two realistic take-profit levels after supply rejection:
🎯 Target 1: $3,056.57
🎯 Target 2: $2,993.69
From there, the dotted path continues lower toward a deeper liquidity zone near the recent low:
Extended Target Zone: $2,900 → $2,887 → $2,873 (recent major low)
🔹 Strong Reaction From $2,873 Low:
ETH bounced from $2,873, but the bounce lacks structural strength and remains corrective unless it reclaims the supply zone.
Potential Move
If ETH taps the supply zone ($3,170–$3,143) and shows rejection:
🎯 Target 1: $3,056.57
🎯 Target 2: $2,993.69
🎯 Extended Target: $2,900 → $2,887 → $2,873 liquidity zone
A confirmed 4H close above $3,170 would weaken the bearish continuation setup and signal a deeper retracement instead of continuation.
Summary
Ethereum is retracing into a major 4H supply zone after multiple bearish structure breaks. The current bounce appears corrective, setting up a potential short entry around $3,170–$3,143. If sellers defend this zone, ETH is likely to continue lower toward $3,056, $2,993, and potentially back into the low-$2,900s. A clean break above $3,170 would invalidate the bearish setup.

FTT NEXT TARGET ?🔥 #FTT Update :
FTT is moving inside a falling wedge, and it has just tapped a very strong demand zone near the 0.786 Fibonacci level — a classic area for big reversals.
First bounce target: $0.8337
Main upside target: $0.9849
As long as FTT holds above the marked demand zone, a bullish reversal is the most likely outcome 📈🔥

DGB LONGMYX:DGB
#DGB Look at this beauty 👀🔥
A massive Inverse Head & Shoulders forming on the macro scale — pure accumulation before a breakout 🚀
I’m watching for a retest of the two key levels:
🎯 $0.03850
🎯 $0.07000
At least these targets should be hit. Momentum building… ⏳💥

I'm going to continue shorting gold! Are you ready?This week's gold price movement largely aligned with my trading strategy. I shorted gold at the opening on Monday, targeting a low of $4,000. After breaking below $4,000, the price rebounded, recovering its losses on the back of the initial jobless claims data and rising back above $4,100. It then encountered resistance near $4,130 and fell back. This price action was consistent with my view that shorting gold in the $4,125-$4,135 range was very effective, as the market subsequently fell by tens of dollars.
Due to the decline in gold prices and the shift in the center of gravity, the entry price also needs to be lowered. I plan to short gold in batches in the $4095-$4115 range. The technical outlook is currently dominated by a bearish trend, making this area relatively safe.
The above are my personal thoughts! If this is helpful to you or if you share the same ideas, please like and follow to show your support! All strategies have a limited lifespan. While referring to them, it's also important to closely monitor market changes. I will also respond flexibly based on actual market fluctuations!

Continue shorting gold in the 4085-4105 range!This week's gold price movement largely aligned with my trading strategy. Starting Monday, I shorted gold, targeting a low of $4000. After breaking below $4000, gold rebounded, recovering its losses on the back of initial jobless claims data and rising back above $4100. It then encountered resistance near $4130 and fell back. This price action was consistent with my initial view that shorting gold in the $4125-$4135 range was highly effective, with the market falling by tens of dollars. www.tradingview.com
The gold market is currently closed. Shorting gold can continue after the market reopens. Due to the decline in gold prices and the shift in the center of gravity, the entry price will also shift downwards. I plan to short gold in batches in the 4085-4105 range. Technically, the downtrend is currently dominant, and this area is relatively safe.
The above represents only my personal thoughts. If you find it helpful, please like and follow to show your support! Please note that any strategy is time-sensitive, and strategies will change as market conditions evolve. I will notify you in the channel based on the actual market situation!

EURUSD FRGNT Daily Forecast -Q4 | W47| D20 | Y25 |📅 Q4 | W47| D20 | Y25 |
📊 EURUSD FRGNT Daily Forecast
🔍 Analysis Approach:
I’m applying Smart Money Concepts, focusing on:
Identifying Points of Interest on the Higher Time Frames (HTFs) 🕰️
Using those POIs to define a clear trading range 📐
Refining those zones on Lower Time Frames (LTFs) 🔎
Waiting for a Break of Structure (BoS) for confirmation ✅
This method allows me to stay precise, disciplined, and aligned with the market narrative, rather than chasing price.
💡 My Motto:
"Capital management, discipline, and consistency in your trading edge."
A positive risk-to-reward ratio, paired with a high win rate, is the backbone of any solid trading plan 📈🔐
⚠️ Losses?
They’re part of the mathematical game of trading 🎲
They don’t define you — they’re necessary, they happen, and we move forward 📊➡️
🙏 I appreciate you taking the time to review my Daily Forecast.
Stay sharp, stay consistent, and protect your capital
— FRNGT 🚀
OANDA:EURUSD

AUDUSD FRGNT Daily Forecast -Q4 | W47| D20 | Y25 |📅 Q4 | W47| D20 | Y25 |
📊 AUDUSD FRGNT Daily Forecast
🔍 Analysis Approach:
I’m applying Smart Money Concepts, focusing on:
Identifying Points of Interest on the Higher Time Frames (HTFs) 🕰️
Using those POIs to define a clear trading range 📐
Refining those zones on Lower Time Frames (LTFs) 🔎
Waiting for a Break of Structure (BoS) for confirmation ✅
This method allows me to stay precise, disciplined, and aligned with the market narrative, rather than chasing price.
💡 My Motto:
"Capital management, discipline, and consistency in your trading edge."
A positive risk-to-reward ratio, paired with a high win rate, is the backbone of any solid trading plan 📈🔐
⚠️ Losses?
They’re part of the mathematical game of trading 🎲
They don’t define you — they’re necessary, they happen, and we move forward 📊➡️
🙏 I appreciate you taking the time to review my Daily Forecast.
Stay sharp, stay consistent, and protect your capital
— FRNGT 🚀
OANDA:AUDUSD

LongAccording to the analysis of the waves and the help of the Gann method, it can be expected that the price will return to the green zone again.
This is my personal opinion. Please don't use it as your trading criteria. Good luck

EURGBP FRGNT Daily Forecast -Q4 | W47| D20 | Y25 |
📅 Q4 | W47| D20 | Y25 |
📊 EURGBP FRGNT Daily Forecast
🔍 Analysis Approach:
I’m applying Smart Money Concepts, focusing on:
Identifying Points of Interest on the Higher Time Frames (HTFs) 🕰️
Using those POIs to define a clear trading range 📐
Refining those zones on Lower Time Frames (LTFs) 🔎
Waiting for a Break of Structure (BoS) for confirmation ✅
This method allows me to stay precise, disciplined, and aligned with the market narrative, rather than chasing price.
💡 My Motto:
"Capital management, discipline, and consistency in your trading edge."
A positive risk-to-reward ratio, paired with a high win rate, is the backbone of any solid trading plan 📈🔐
⚠️ Losses?
They’re part of the mathematical game of trading 🎲
They don’t define you — they’re necessary, they happen, and we move forward 📊➡️
🙏 I appreciate you taking the time to review my Daily Forecast.
Stay sharp, stay consistent, and protect your capital
— FRNGT 🚀
FX:EURGBP
