Axis Bank | Gann Square of 9 – No Trade Day Case StudyThis idea shares a historical intraday case study on Axis Bank Ltd, demonstrating how Gann Square of 9 degree + time rules help traders identify sessions with no valid trading opportunity.
On 11 April 2022, Axis Bank presented two separate Gann reference structures, yet neither fulfilled the conditions required for a high-probability trade.
📈 Upside Structure
0° reference: ₹786.05
Projected 45° level: ₹800.13
Price moved upward from the 0° base but failed to reach the 45° level within the intraday time window, resulting in no valid sell-side setup.
📉 Downside Structure
0° reference: ₹794.25
Projected 45° level: ₹780
Later in the session, price declined from the new 0° base, but once again did not complete the 45° downside move, eliminating any valid buy-side opportunity.
⏱️ Gann Time Rules Applied
As per Gann’s intraday principles, a tradable setup generally forms when:
45° is reached before 2:30 PM, or
90° is reached before 2:45 PM
Neither condition was met during this session.
🧠 Conclusion
April 11, 2022 stands out as a clear “No Trade Day”.
This chart reinforces a core Gann principle:
Capital protection begins with patience.
Not every session offers opportunity — and recognizing that is a skill.
Disclaimer:
This idea is shared strictly for educational and analytical purposes only. It does not constitute any trading advice or recommendation.
Gannangles

Axis Bank | Gann Square of 9 Intraday Case Study | 21 Apr 2023This idea illustrates how WD Gann’s Square of 9 helps identify normal intraday price capacity and high-probability reversal zones using price–time geometry.
On 21 April 2023, Axis Bank started showing downside momentum from the second 15-minute candle.
To measure the expected intraday decline, the day’s high near ₹873.85 was selected as the 0-degree (0°) reference point, following standard Gann methodology.
Using the Gann Square of 9, the stock’s normal intraday downside level was projected at:
45° → ₹858
Price reached the 45-degree level around 1:00 PM, completing its normal price capacity well before the ideal Gann timing window near 2:30 PM.
According to Gann’s time–price principles, early completion of a degree level often signals temporary exhaustion.
From this zone, Axis Bank reacted strongly and reversed upward, offering clean intraday recovery movement.
This case demonstrates how price geometry combined with time awareness can help traders define logical reaction zones, rather than relying on indicators or guesswork.
📌 Key Gann Levels
0° → 873.85
45° → 858
🔍 Educational Takeaways
Square of 9 defines price capacity
Time determines when reactions are likely
Early completion increases reversal probability
Structure > indicators
Disclaimer:
This idea is shared strictly for educational and analytical purposes only. It does not constitute trading or investment advice.

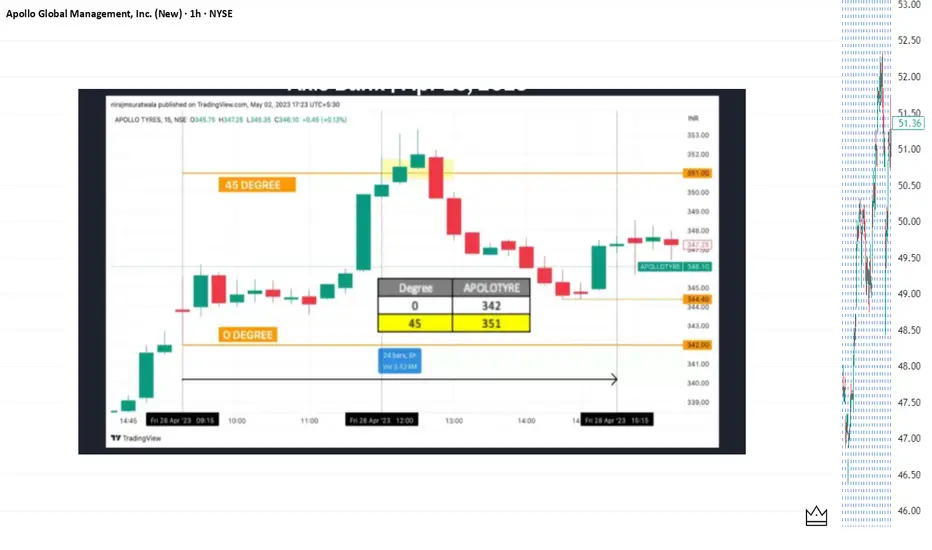
Apollo Tyres | Gann Square of 9 Intraday Case Study | 28 Apr 202This chart demonstrates a classic Gann Square of 9 intraday application, where price reached its normal capacity early in time, leading to a logical reversal.
On 28 April 2023, Apollo Tyres opened with strong upward momentum.
The low of the first 15-minute candle (₹342) was selected as the 0-degree (0°) reference point, following standard WD Gann methodology.
Using the Gann Square of 9, the stock’s normal intraday upside capacity was projected at:
45° → ₹351
Price reached the 45-degree level around 12:00 PM, which is well before the ideal Gann timing window near 2:30 PM.
According to Gann’s time–price relationship, early completion of a degree level increases the probability of exhaustion.
The market reacted immediately from this zone and moved lower, offering clear and logical intraday selling opportunities.
This example highlights how price geometry combined with time analysis helps traders identify high-probability reaction zones, rather than relying on guesswork.
📌 Key Gann Levels
0° → 342
45° → 351
🔍 Key Takeaways
Square of 9 defines price capacity
Time defines when that capacity matters
Early degree completion often signals exhaustion
Geometry + time = structured intraday decisions
Disclaimer:
This idea is shared strictly for educational and analytical purposes. It does not constitute investment or trading advice.
ETH/USDC: A Gentle Unfolding of Harmonious Flow (3H Timeframe)In the serene cadence of the market, ETH/USDC presently dwells within a balanced range of 2685–3065 on the 3-hour chart.
From the perspective of the Harmonious Flow of Energy, this consolidation is not mere hesitation, but a quiet accumulation — a space where forces align in subtle proportion, neither overpowering the other, yet preparing for natural resolution.
The structure speaks of restraint: proportional waves, measured volumes, and a context that favours continuity over disruption. The energy here feels contained, yet directed — pointing toward an upward release when the balance tips with clarity.
A breakout above the range carries a calm probability of extension toward 3800–4000, a zone where past resistance may gently invite reflection. There, the flow could pause, allowing a harmonious correction — not a reversal, but a respectful return to test the conviction of buyers who entered within 2685–3065.
Such a retracement would serve the deeper rhythm: affirming strength without excess, protecting positions with poise rather than force.
This reading requires no urgency. When the elements — flow, harmony, proportion, and context — converge without pressure, the path reveals itself simply. Until then, we observe with lightness.
Wishing you clarity in the flow.

Axis Bank | Gann Square of 9 Intraday Case Study | 11 Mar 2024This chart presents an intraday price-reaction study in Axis Bank using the Gann Square of 9.
After the first 15-minute candle showed upward momentum, the low of that candle (1104) was used as the 0-degree reference, following classical WD Gann price-angle principles.
Using Square of 9 calculations, the 45-degree level was projected at:
45° → 1121
Price moved into the 45-degree zone before the later part of the session, indicating completion of its normal intraday upside capacity.
As per Gann methodology, when price reaches a calculated angle earlier than expected, the market often responds with a temporary price reaction.
Axis Bank reacted from the 1120–1121 zone, respecting the projected level within a normal intraday margin.
🔍 Key Observations
First 15-minute structure defines the degree base
Square of 9 provides objective intraday price levels
Early arrival at angle levels highlights price exhaustion
Focus is on reaction zones, not trade recommendations
📌 Key Gann Levels
0° → 1104
45° → 1121
Disclaimer:
This idea is shared for educational and analytical purposes only and does not constitute trading or investment advice.

CNX AUTO | WD Gann Law of VibrationCNX AUTO | WD Gann Law of Vibration – Educational Case Study (Sept 2021)
Disclaimer:
This analysis is for educational purposes only.
I am not a SEBI-registered advisor.
This is not financial advice.
This idea presents an educational case study on CNX AUTO (Nifty Auto) using WD Gann’s Law of Vibration, focusing on how markets have historically behaved after interacting with specific vibration zones.
📌 Study Context
During September 2021, CNX AUTO was observed near a Gann vibration base zone around 9785
This zone was studied as a potential energy / pressure area, not as a trade signal
The objective was to observe price behavior after vibration alignment
📊 Observed Market Behavior
Price showed stability and reduced downside pressure near the vibration base
Sustained trade above the zone was followed by gradual strength development
Over time, the index expanded upward, reflecting range expansion after vibration alignment
🧠 Educational Insight
Gann vibration levels do not guarantee reversals
Some levels act as structural bases where energy builds over time
Expansion often follows time + price alignment, not indicators or news
Understanding why price reacts is more important than predicting how far
This study is shared to help traders understand how vibration-based zones have behaved historically in index movement and how patience and structure matter when applying WD Gann concepts.

NIFTY 50 | Vibration-Based Reversal Zone Study(September 2022 | WD Gann Framework)
This idea shares a historical market structure study based on WD Gann’s Law of Vibration, focusing on how specific price zones become sensitive when vibration balance shifts.
⚠️ This is not a trade recommendation or signal.
The post is shared strictly for educational purposes.
📌 Study Background
In mid-September 2022, NIFTY reached a price region where vibration alignment and structural symmetry became more relevant than short-term momentum.
Rather than reacting to price movement, this study observes:
Pre-defined vibration-sensitive zones
Market behavior near structural extremes
How reversals often occur when vibration conditions change
📊 What the Chart Demonstrates
A clearly defined resistance zone
A time-aligned price reaction
Expansion in volatility following vibration shift
How markets often move after internal balance changes, not news events
🧠 Educational Takeaways
Vibration governs when reversals become possible
Price reacts only after internal conditions shift
WD Gann analysis focuses on structure and balance
Studying completed cycles helps understand future behavior
⚠️ Disclaimer
This analysis is shared for educational and research purposes only and should not be considered financial advice.

NIFTY 50 | Natural Time Cycle Observation(Jan–Mar 2023 | WD Gann Framework)
This post presents a historical market study focusing on time-cycle behavior in NIFTY, using concepts derived from WD Gann’s Natural Time Cycle and Vibration framework.
⚠️ This is not a trading signal or forecast.
Shared strictly for educational and analytical purposes.
📌 Study Context
During mid-January 2023, NIFTY entered a period where time symmetry and vibration balance became more relevant than short-term price movement.
Instead of forecasting direction, this study focuses on:
Time windows
Structural reference levels
Volatility expansion zones
📊 What the Chart Illustrates
A clearly defined reference low
A broader time window extending into late March
How markets often resolve trends near time-cycle completion
Price reaction occurring after time alignment, not before
🧠 Key Educational Observations
Time plays a leading role; price responds later
Natural cycles often define when movement expands, not how
Gann analysis emphasizes market structure, not prediction
Studying completed cycles improves contextual market understanding
⚠️ Disclaimer
This content is for educational purposes only and does not constitute financial advice or a trading recommendation.

NIFTY 50 | Time & Price Interaction Study(26 Nov 2022 Reference | WD Gann Framework)
This idea presents a historical study of how time-based pressure zones can interact with important price levels, using concepts derived from WD Gann methodology.
⚠️ This is not a trading signal or forecast.
It is shared purely for educational and structural study purposes.
📌 Study Background
In late November 2022, NIFTY was trading near an important reference low formed around 26 November.
This study observes how markets often respond when time alignment and price structure intersect.
📊 What the Chart Shows
A clearly defined reference price zone
Subsequent increase in volatility once price closed below that zone
Expansion in directional movement after time–price imbalance
How pressure zones often act as decision points, not guarantees
🧠 Key Learning Takeaways
Time-based levels often define risk zones, not direction
Price behavior changes when pressure builds near reference dates
WD Gann analysis focuses on structure and balance
Studying past cycles helps traders understand market behavior, not predict outcomes
⚠️ Disclaimer
This content is for educational and research purposes only.
It does not constitute financial advice or market recommendations.

NIFTY 50 | Time-Based Market Structure Study(Oct–Dec 2022 | WD Gann Framework)
This idea shares a historical, educational study of how time-based market structure can be analyzed using principles derived from WD Gann methodology.
⚠️ This is not a forecast or trade call.
It is a post-event structural study for learning purposes only.
📌 Study Context
During October 2022, NIFTY was in a corrective phase with strong bearish sentiment.
Instead of focusing on momentum or news, this study highlights how time exhaustion and structural balance can be observed on the chart.
📊 What the Chart Demonstrates
A time zone where selling pressure began to lose effectiveness
Price behavior shifting from impulse decline to consolidation
How markets often pause or reverse when time symmetry completes
A subsequent time window where expansion stalled again
This study focuses on how time influences structure, not on predicting future market movement.
🧠 Key Learning Points
Markets often change behavior after time completion, not price extremes
Time-based analysis helps identify risk zones, not certainty
WD Gann methods emphasize structure and balance, not directional bias
Studying past cycles improves contextual understanding
⚠️ Disclaimer
This content is shared strictly for educational and research purposes.
It does not constitute investment advice, recommendations, or forecasts.

NIFTY 50 | Price–Time Square Structure Study(May 2023 | WD Gann Framework)
This idea shares a historical chart study explaining how Price–Time Square alignment can be observed in NIFTY using classical WD Gann methodology.
⚠️ This is a chart study for educational purposes only, not a forecast or trading recommendation.
📌 Concept Overview
WD Gann’s Price–Time Square concept focuses on:
Balance between price movement and time progression
Structural symmetry rather than indicators
Understanding when markets remain within a valid structural window
During May 2023, NIFTY was in an ongoing trend phase where price acceptance within a defined structure could be observed.
📊 What This Chart Demonstrates
A key structural price zone derived from price–time alignment
The importance of closing-basis support validation
How price behaved inside the projected structure during the period
The chart is shared only to demonstrate how structure is studied, not to suggest future direction.
🧠 Learning Insights
Price–Time Square works on mathematical balance, not prediction
Time windows help define structural validity
Trend continuation often depends on support acceptance, not momentum
Historical chart studies improve contextual market reading
⚠️ Disclaimer
This idea is intended purely for education and research.
It does not constitute financial advice or market forecasting.

Axis Bank | Gann Square of 9 Intraday Case Study | 11 Mar 2024This chart presents an intraday price-reaction study in Axis Bank using the Gann Square of 9.
After the first 15-minute candle showed upward momentum, the low of that candle (1104) was used as the 0-degree reference, following classical WD Gann price-angle principles.
Using Square of 9 calculations, the 45-degree level was projected at:
45° → 1121
Price moved into the 45-degree zone before the later part of the session, indicating completion of its normal intraday upside capacity.
As per Gann methodology, when price reaches a calculated angle earlier than expected, the market often responds with a temporary price reaction.
Axis Bank reacted from the 1120–1121 zone, respecting the projected level within a normal intraday margin.
🔍 Key Observations
First 15-minute structure defines the degree base
Square of 9 provides objective intraday price levels
Early arrival at angle levels highlights price exhaustion
Focus is on reaction zones, not trade recommendations
📌 Key Gann Levels
0° → 1104
45° → 1121
Disclaimer:
This idea is shared for educational and analytical purposes only and does not constitute trading or investment advice.

Axis Bank | Gann Square of 9 Intraday Case Study (12 Nov 2024)This idea shares an intraday case study illustrating how price reacted to a Gann Square of 9 angle level.
On 12 November 2024, Axis Bank showed early strength from the first 15-minute candle.
The initial intraday low around 1166 was considered the 0-degree reference, following WD Gann’s price–angle methodology.
Using Square of 9 calculations, the following key level was identified:
45° level → 1183
Price reached the 45-degree level very early in the session (around 9:30 AM), much before the ideal time window typically observed for balanced moves.
This early completion of price capacity indicated a potential price–time imbalance.
After touching the 45° level, Axis Bank showed clear rejection and downside follow-through, resulting in a clean intraday decline from that zone.
🔍 Key Takeaways from This Study
Identify a clear 0-degree base from intraday structure
Calculate the 45° angle as normal price expansion
Early arrival at an angle can signal exhaustion
Price–time imbalance helps locate high-probability reversal areas
This case demonstrates how structured geometric analysis can be used to study intraday market behaviour logically instead of guessing.
Disclaimer:
This idea is shared for educational and chart-study purposes only.
It does not constitute trading advice or recommendations.

Axis Bank | Gann Square of 9 Intraday Case Study (13 Nov 2024)This idea presents an intraday case study demonstrating how price reacted to a key Gann Square of 9 angle level during the trading session.
On 13 November 2024, Axis Bank opened with strength and moved higher from the first 15-minute candle.
The day’s first significant low near 1148 was used as the 0-degree reference point, following WD Gann’s price–angle principle.
Using Square of 9 calculations, an important intraday level was identified:
• 45° level → 1165 (normal intraday price capacity)
Price reached the 45-degree level very early in the session, indicating that the instrument had completed its expected upward capacity within a short time window.
After touching this level, price showed clear rejection and loss of momentum, followed by a sharp intraday decline from that zone.
🔍 Key Observations from This Study
• Define a clear 0-degree reference from an intraday pivot
• Calculate the 45° angle as normal price expansion
• Early achievement of an angle level can signal exhaustion
• Geometric levels help identify logical reversal zones, not random guesses
This case highlights how price, time, and angle alignment can be used together to study intraday behaviour in a structured, rule-based manner.
Disclaimer:
This idea is shared strictly for educational and chart-analysis purposes only.
It is not a trade recommendation or financial advice.

Axis Bank | Gann Square of 9 Intraday Case Study (07 Feb 2025)This idea documents a recent intraday example of applying WD Gann’s Square of 9 to estimate downside capacity and potential reaction zones using price–angle relationships.
On 07 February 2025, Axis Bank showed weakness from the very first intraday candle, indicating a potential one-directional move during the session.
In such situations, Gann methodology allows traders to evaluate how far price may travel based on its normal and exceptional intraday capacity.
Using the session’s reference price as the 0-degree base, the following projections were calculated:
• 45° level → normal intraday capacity
• 90° level → exceptional intraday capacity
As price declined, it reached the 45-degree projection around 10:30 AM, well before the late-session time window. Near this level, price showed stability and a visible pause, followed by a tradable intraday bounce.
🔍 Key Observations from This Case
• Early directional bias helps define intraday expectations
• Square of 9 allows pre-calculation of downside capacity
• Reaching 45° before the late session often signals normal exhaustion
• Reactions at geometric levels can provide structured study points
This case highlights how price geometry and time alignment can be used to study intraday behaviour in a disciplined and rule-based manner.
Disclaimer:
This content is shared strictly for educational and analytical purposes only.
It does not constitute trading advice or recommendations.

Axis Bank | Intraday Forecasting Using Gann Square of 9 (01 Apr This idea presents an intraday case study demonstrating how WD Gann’s Square of 9 can be applied to identify probable resistance zones using price–angle relationships.
On 01 April 2024, Axis Bank showed early intraday strength after the opening session.
The first 15-minute low was used as the 0-degree reference point, following classical Gann methodology.
Based on Square of 9 calculations, the following projected levels were derived:
• 45° level (normal intraday capacity) → 1064
• 90° level (expanded / rare capacity) → 1081
As price advanced during the session, it approached the 45-degree level before the late-session time window. Around this zone, price showed clear hesitation and rejection, followed by intraday weakness.
🔍 Key Observations from This Study
• Use the first intraday pivot to define the 0-degree base
• Calculate angle-based projections using Square of 9 logic
• Observe time alignment when price reaches projected levels
• Reactions near 45° often indicate normal resistance behaviour
This example highlights how rule-based price geometry helps traders study intraday behaviour in a structured and disciplined way, without relying on indicators.
Disclaimer:
This post is shared strictly for educational and chart-analysis purposes only.
It is not a trading recommendation or financial advice.

Axis Bank | Gann Square of 9 Intraday Case Study (08 Apr 2024)This idea documents an intraday price-angle behaviour in Axis Bank using Gann Square of 9 principles, focusing on how price reacted near a key geometric level during the session.
On 08 April 2024, Axis Bank showed strong intraday momentum after the open.
The intraday low was used as the 0-degree reference point, following classical Gann price–angle methodology.
From this reference, important Square of 9 levels were derived:
• 0° level → Intraday base
• 45° level → Normal resistance zone
• 90° level → Expanded resistance (exceptional strength area)
During the session, price advanced steadily and reached the 45-degree level before the late-session time window. Near this zone, price showed visible hesitation and rejection, leading to a short-term intraday pullback.
🔍 Observations from This Case Study
• Establish a precise 0-degree reference from the intraday pivot
• Track how price approaches 45° and 90° angle levels
• Observe time sensitivity when price reaches geometric zones
• Reactions near angle levels help identify logical pause or reversal areas
This case highlights how Gann’s price-angle structure can be used to study intraday behaviour in a disciplined and rule-based manner, without relying on indicators.
Disclaimer:
This post is shared for educational and chart-study purposes only.
It is not a trading recommendation or financial advice.

AUDJPY – SHORTA short position is proposed upon price rejection from the key resistance area. This area is defined by the confluence of the Supply Zone's POC level and a Dynamic Gann Resistance angle. The target is at the POC level within the next significant Demand Zone.
AUDJPY – SHORT
ENTRY PRICE - 98.150
SL - 99.400
TP - 94.400
Always follow the 6 Golden Rules of Money Management:
1. Protect your gains and never enter into a position without setting a stop loss.
2. Always trade with a Risk-Reward Ratio of 1 to 1.5 or better.
3. Never over-leverage your account.
4. Accept your losses, move on to the next trade and trust the software.
5. Make realistic goals that can be achieved within reason.
6. Always trade with money you can afford to lose.
Please leave your comment and support me with like if you agree with my idea. If you have a different view, please also share with me your idea in the comments.
Have a nice day!

USDCHF BUY TREND LONG POSITIONFormed a triangle for accumulation, now its broken and gave view it going to go upside slowly. So Buy USD for long time investment now

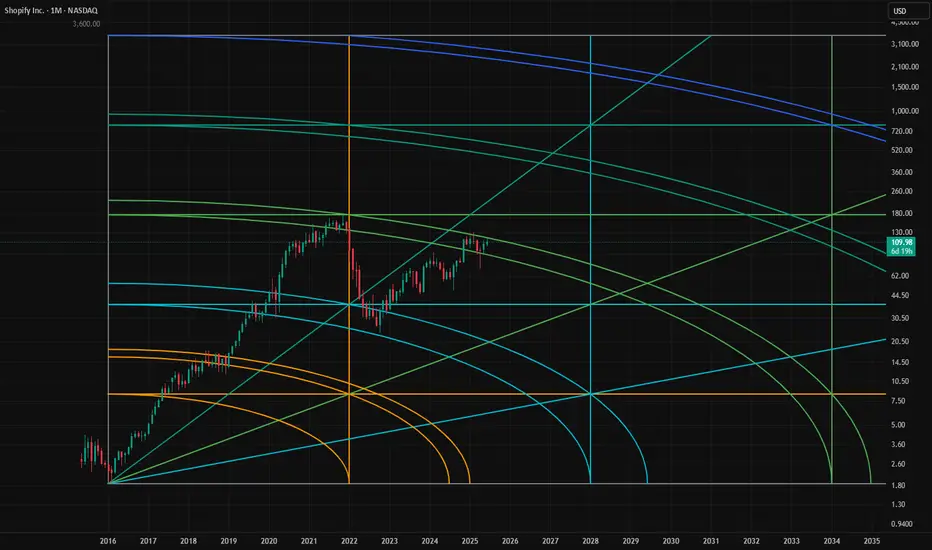
$SHOP will break out shortly! Shopify is dtuck under it's arc for a while now, Ones it breaks it will gravitade to the next one. Good Symmetry.
How Gann’s Square of 9 Reveals Hidden Time Cycles in the US500In today’s fast-moving markets, most traders are stuck reacting, chasing signals, hunting for breakouts, and trying to make sense of noise. But what if you could predict where the market might turn, not just based on price, but on time itself?
That’s exactly what W.D. Gann mastered. His tools, like the Square of 9, weren’t just about charts, they were about timing the rhythm of the market. Today, I’ll walk you through a real-world example on the US500, using Gann’s time technique on the 5-minute chart. This isn't theory. This is how you can bring Gann’s legacy to life in real-time trading.
Step 1: Don’t Start on the 5-Minute—Zoom Out First
The first thing to understand is that not every swing high or low is meaningful. To apply Gann’s time analysis correctly, you must choose swing points that matter—and that means looking at the higher timeframes.
Before diving into the 5-minute chart, I always analyze the 15-minute, 1-hour, and 4-hour charts. If a swing high or low on the 5-minute lines up with a key support or resistance zone from those larger timeframes, that’s your signal. These are levels where institutions and big players act, and that gives your analysis a real edge.
So, once I identified a swing high and low on the 5-minute chart that aligned perfectly with a 1-hour resistance zone and a 4-hour support level, I knew I had something solid.
Step 2: Counting Bars – The Foundation of Time Analysis
From the chosen swing low to the swing high, the market took 9 bars to complete the move. That number isn’t just a count—it becomes our anchor in time.
Using my custom-built Gann Square of 9 spreadsheet, I plugged in this value. The spreadsheet then calculated future bar counts where the 45-degree time angle repeats, based on Gann’s time rotation principle.
The output gave us these key numbers: 16, 25, 36, 49, 64, 81
These are not arbitrary. They are time-based vibration points derived from Gann’s spiral math—each one representing a future window where the market is likely to shift.
Step 3: Letting Time Lead the Trade
Let’s walk through what happened at each of these time windows:
Bar 16: The market attempted to push higher—a classic manipulation move. Then came a sharp reversal. The 45-degree vibration was in effect. This was a textbook Gann-style turning point.
Bar 25: No sharp reversal, but momentum slowed and price started consolidating. This was a structural pause—just as important as a reversal for those watching intraday shifts.
Bar 36: This one was dramatic. The market had been falling, but as we approached the 36th bar, rejection candles started appearing. Selling pressure dried up, and buyers stepped in. Soon after, a bullish breakout followed. The time vibration had called it again.
Bar 49: After a strong bullish run, the price stalled and reversed almost precisely at this time point. This marked a shift back to bearish sentiment.
Bar 64: The downtrend lost steam. Price began forming a new swing low, and as we passed the 64-bar mark, bullish momentum returned. Another clean reversal.
Bar 81: The final vibration in this sequence. The bullish move slowed, candles shrunk, and volume faded. Then came a breakdown. A bearish turn right on time.
What This Means for You as a Trader
This sequence—from bar 16 to 81—is a masterclass in how time drives the market. It shows that price action is not random. It's governed by hidden cycles that most traders overlook. But when you apply Gann’s methods with precision, the market reveals its rhythm.
All we did was:
Identify a meaningful swing (validated by higher timeframes)
Count the bars between the swing low and high
Let the Square of 9 calculate the future time vibrations
From there, we simply watched and waited. And the market played out almost to the bar.
Conclusion: From Reactive to Predictive Trading
The real power of Gann’s techniques lies not in magic, but in mathematical and astrological precision. When you understand how time and price interact, you stop reacting—you start forecasting.
You stop chasing trades—you start anticipating reversals.
Gann’s Square of 9 isn’t just an old-school tool. With the right application, it becomes a modern forecasting machine. And with the help of tools like my custom spreadsheet, the entire process becomes simple, streamlined, and incredibly effective.
So the next time you’re about to take a trade, ask yourself:
Are you following price? Or are you following time?
Because when time is on your side, the market moves in your direction—not the other way around.

92% Win Rate Strategy Using Gann’s Planetary LongitudeHave you ever wondered how some traders seem to anticipate market reversals with uncanny precision, almost as if they can see into the future?
Well, what if I told you that the secret doesn’t lie in guesswork or traditional retail indicators, but in the heavens themselves?
Let me walk you through one of the most powerful forecasting tools in Gann's arsenal—the Planetary Longitude Method and how I used it to identify the exact price level from which the market reversed.
The Power of Planetary Time Cycles in Trading
This technique isn’t based on patterns, trendlines, or lagging indicators. It’s rooted in precise planetary time cycles, the same natural laws that govern the movement of celestial bodies.
Gann believed the markets were not chaotic but deeply connected to universal rhythm and planetary motion. According to his planetary longitude method, each planet holds a specific degree of longitude at any given time. These degrees can be directly mapped onto price charts, turning astronomical data into actionable trade setups.
When price meets planetary longitude, something extraordinary happens. These degrees act as invisible support and resistance levels—ones that retail traders never see. They are silent yet powerful markers of change, and because they are rooted in cosmic cycles, they give you a strategic edge in timing your trades.
Why These Degrees Matter
As a trader, what you’re truly looking for is reaction zones, areas where price is likely to pause, reverse, or accelerate. When planetary time and market price converge at a particular degree, it creates what Gann called a "vibrational point", a moment of energetic alignment. These are high-probability zones where you can anticipate market turning points with accuracy.
By tracking the longitudes of key planets, such as the Sun, Moon, Mars, Jupiter, or Saturn—you can identify these critical junctures. Each planet brings its own cycle, its own tempo. For deeper, longer-term reversals, I often rely on the slower-moving planets like Pluto, while for short-term setups, I look at the faster ones like the Moon or Mars.
How I Forecasted the US100 Reversal from 19,384.6
Now, let’s get practical.
In this recent example, I was closely watching the US100 index, where I anticipated a potential reversal around the level of 19,384.6. Was this just another support/resistance zone? Absolutely not.
Here’s how I arrived at this precise level using Gann’s Planetary Longitude Technique:
First, I took the price level of 19,384.6 and converted it into degrees. To do this, I simply subtracted 360 repeatedly from the price until I arrived at a number less than 360. This process is based on the 360° circle of the zodiac—once the price cycles through the full circle multiple times, what's left is the vibrational degree associated with that price. In this case, the price level of 19,384.6 converted to approximately 304.6°.
Then, I checked the planetary position of Pluto which was 303.55° in longitude.
This created a near-perfect alignment between Pluto’s time cycle and the vibrational price degree. When planetary time meets price, it forms a cosmic convergence zone—a point of natural balance where the market is highly likely to react. So, I wasn’t just guessing—I was waiting for that moment of planetary resonance.
And as the chart clearly shows, the market reacted sharply the moment it touched 19,384.6, confirming the sensitivity of this degree. It wasn’t random. It was a harmonic response, echoing the laws of cosmic vibration that Gann so strongly emphasized.
This is a real-time example of how combining planetary time with price geometry can give you a decisive trading edge, especially in forecasting major turning points.
Why This Method Works
The market respects these planetary degrees not because of mysticism, but because it moves in cycles—natural cycles that repeat. The alignment of price with planetary longitude often marks pivot points in the market.
And this method doesn’t just help with identifying reversals. It also enhances your entry and exit timing, allowing you to trade with confidence, knowing you're aligned with the larger cosmic structure that influences all things—including financial markets.
Final Thoughts
This is just one example of how planetary geometry, when applied correctly, can lead to powerful trade setups. While Pluto offers long-term signals, don’t underestimate the value of the Moon, Mars, or Jupiter for shorter timeframes. The market dances to their rhythm too.
And once you learn to listen to that rhythm, you'll never look at price the same way again.

Gann Astro Trading Strategy with 92% Win Rate !Gann Astro Trading Strategy with 92% Win Rate !
Unlocking Gann's Secrets: Time Cycles, Square of 9, and Planetary Influence
In this video, we will dive deep into Gann’s trading methods, uncovering how time cycles, Square of 9 calculations, and planetary influences — especially the Mars-Jupiter cycle and lunar cycles — shape market movements. We’ll explore how numerology shifts and square roots reveal hidden support and resistance levels, plus how planetary declinations influence both price action and market psychology. Whether you’re a seasoned trader or just discovering Gann’s techniques, this breakdown will give you powerful insights to time the markets more effectively.
What You’ll Learn in This Video:
- How to apply Gann’s Square of 9 to track market highs and lows.
- The power of Mars-Jupiter cycles in driving momentum and expansion.
- How lunar cycles and faster planets like Mercury influence short-term moves.
- Using numerology shifts and square roots to uncover hidden support and resistance levels.
- The role of planetary declinations in shaping market psychology and major trend reversals.
Why This Video is Essential for Traders:
- Understand how Gann’s time cycles predict market turning points.
- Gain an edge with astrological market analysis — beyond traditional technical methods.
- Learn to combine fast and slow planets to time entries and exits more precisely.
- Decode historic market moves like the 2008 crash through planetary geometry.
Unlock the power of Gann’s time cycles, Square of 9, Gann Wheel, Gann angles, and Gann Fan to forecast market moves with precision. Discover how the Mars-Jupiter cycle, lunar phases, Gann Master Time Factor, Gann Emblem, and planetary declinations impact price action and trend shifts. Learn how Gann’s Law of Vibration, numerology shifts, square roots, price-time squaring, and hidden vibrational levels reveal key support and resistance zones. Whether it’s tracking historic market crashes, price-time balance, or Gann’s astro-numerology, this strategy will refine your entry-exit timing for maximum profitability.
