$IWM Breakout or Breakdown?IWM shows this week we are up against strong Gann resistance. Will be interesting to see if the Fed can "trigger" a breakout. Either way, prepare for #Volatility this week. Crypto and Altcoins depend on it
Gann Box

BTC – Retracement Likely Before Bullish Expansion | Watching 89kBitcoin remains in a strong macro uptrend, but short-term price action is showing signs of exhaustion near the 93k zone. Price rejected this level twice, forming a short-term double top and showing a loss of momentum on the lower timeframes.
On the 45m chart, BTC is slowly breaking below local support, while the 2h shows price sitting high inside a larger ascending channel. A healthy retracement looks increasingly likely before the next impulsive move.
I’m watching the 89,00 –90,000 zone closely, which lines up with:
Mid-range equilibrium
Previous consolidation
Untapped liquidity below
Local FVG imbalance
Trendline support
A sweep into this zone would create a perfect setup for buyers to step back in and continue the higher-timeframe trend.
Macro Context
December typically brings volatility in crypto. With anticipation around December rate decisions, liquidity thinning, and strong bullish positioning in BTC derivatives, a short-term correction would actually benefit the long-term trend.
As long as Bitcoin stays above 85k, the structure remains bullish and any dips are likely to be corrective.
📈 Technical Levels I'm Watching
Major Resistance:
93,200 – 93,800 (strong rejection zone)
96,000 (next major magnet if broken)
Key Support:
90,000
88,500
87,200–87,000 (main demand zone)
85,800 (larger timeframe invalidation)
Bullish Scenario:
A flush into 89k → liquidity grab → reaction → bullish continuation toward 95–96k.
Bearish Scenario (less likely unless macro shocks):
Break and close below 85,800 → deeper correction toward 83k region.
📌 My Trade Planning Outlook
Bias: Bullish on pullback
Looking for continuation long entries around 89,000–90,000, if confirmed with reaction.
Short-term targets:
• 91,500
• 93,000–93,800
Medium-term targets:
• 95,600
• 97,000
As long as BTC maintains the higher timeframe channel structure, I’ll treat dips as opportunities rather than reversals.
Trade Safe,
– JackOfAllTrades

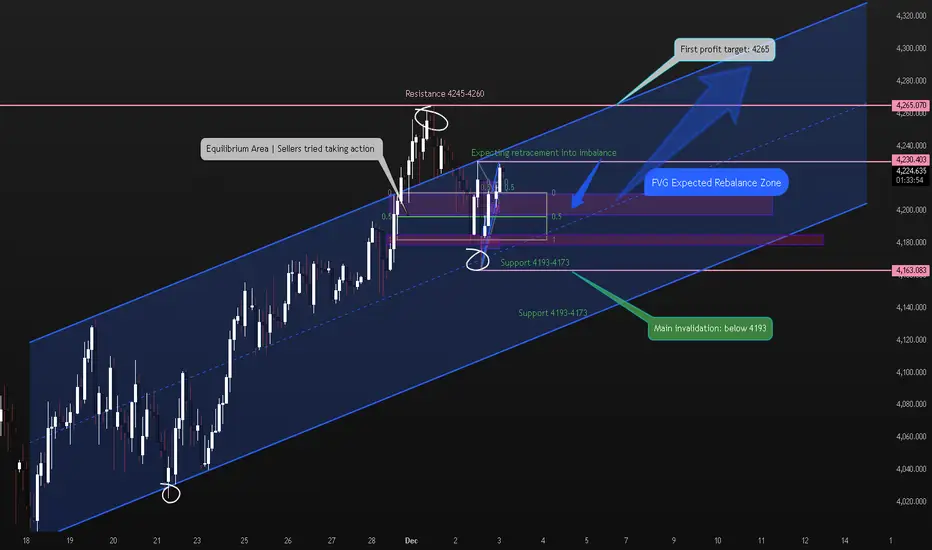
GOLD– Bullish Continuation Expected | Watching FVG Retracement GOLD (XAUUSD) is still moving inside a clean bullish channel structure, and despite recent volatility, the trend remains firmly intact. Price is currently correcting downward and approaching a key imbalance (FVG) zone, where I expect buyers to step back in.
Even though we’ve seen a pullback from the 4,245 zone, this looks like a typical countertrend correction within bullish structure not a reversal. I’m expecting GOLD to dip slightly into the FVG layer, gather liquidity, and continue its upward movement.
📊 Macro Outlook
Mixed US macroeconomic data continues to support a bullish scenario for gold:
Weak US manufacturing PMI continues to signal economic slowdown.
Higher Fed rate-cut expectations.
Safe-haven demand remains elevated due to global uncertainty.
Rising Treasury yields temporarily capped gold, but the bullish structure remains intact.
With key US employment data and ISM services PMI coming this week, volatility might increase but overall momentum still favors the bulls.
Technical Breakdown
Here’s what I'm watching:
🔹 Bullish Channel Structure
Price continues to trade inside a well-defined ascending channel. Until the lower boundary breaks, bullish continuation is the higher-probability play.
🔹 FVG (Fair Value Gap) Rebalance
I expect a short-term dip into the 4205 – 4193 FVG zone.
This is a perfect area for bulls to reload positions.
🔹 Key Support Levels
4201 (minor reaction zone)
4193 – 4173 (major demand + FVG + channel midline)
4169 (strongest support / invalidation level)
🔹 Targets for the Upside
My bullish targets remain:
TP1 – 4,260
TP2 – 4,283
TP3 – 4,300
TP4 – 4,350
I believe GOLD can reach 4,260 fairly soon, and if momentum continues, 4,300–4,350 becomes very realistic.
My Trade Plan (Not Financial Advice)
Bias: Long
Entry:
Looking for buys inside the 4205–4193 FVG zone
or
On bullish confirmation from the channel midline
Stop-loss:
SL: 4169
or
Secondary SL: 4180
Take-profit targets:
TP1: 4260
TP2: 4283
TP3: 4300
TP4: 4350
As long as price stays above 4170 and holds the FVG, bullish continuation remains the main scenario.
Summary
Gold looks good for another bullish leg.
I expect a controlled retracement into the FVG followed by a continuation toward 4260 and above.
What's everyone's ideas??
Send them in the comments so we can chat :)
Trade safe,
– JackOfAllTrades
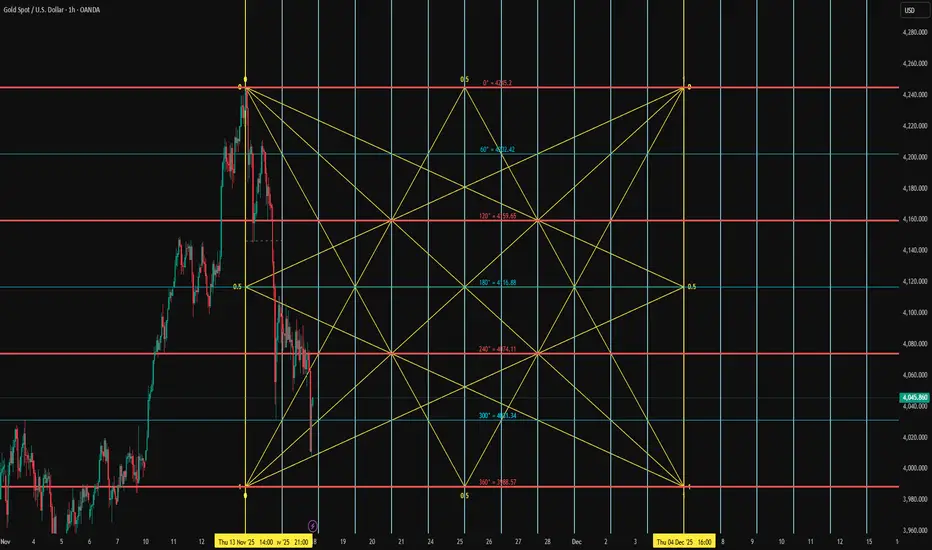
XAUUSD 1h chart levels for the coming week 24 to 28 November
FOREXCOM:XAUUSD
Hey Everyone,
Please see My updated 1h chart levels and targets for the coming week 24 to 28 November
The price closed on 4065 so If the price BREAKOUT UP this area for will open 4093.
The 4061 & 4067 reversal zone and key decision points; if breached, it becomes the path to 4125.
Weekly close at a 90-degree angle from the peak of 4036
If it breaks through with momentum, it will head towards 4004-3998 as it shown on the chart
The week should move like this
Monday should move to 135° degrees (down to 4036 or up to 4093)
Tuesday 150° degrees (if it moved down we will see 4006 & if up will see 4102) First move 150° and We will see rejection of a Strong price when the (moon & sun & Mercury meet I call it = Test Price Day)
Wednesday 160° degrees ((if it moved down we will see 4004 & if up will see 4125 and then 4157) If the price touches the 180-degree angle, it is heading towards a volatile day followed by a strong rise or fall.
Thursday 170° degrees (the price will move between 4125-4157) and if the price moved down wee will move 225° degrees between 4036-4006) A day approaching the peak or undermost, not a reversal day.
Yousif
H-k-O-r-E

100k Gann Box0-100K, 100k-200k, 200k-300k etc...
Both the red and blue highlighters are expected minimums for a completed ABC corrective wave, leaving an anticipated 5 wave move higher to follow.
Dashed lines are simple trend lines from the waves (placed from waves 0-2 and 1-3).

Key Gold Reversal Times for Daily Trading“Time-based analysis focuses on identifying the specific times when the market is likely to reverse or show strong movement. Instead of analyzing only price levels, it studies cycles, timing patterns, and repetitive market behaviors to predict when major or minor turning points may occur.”
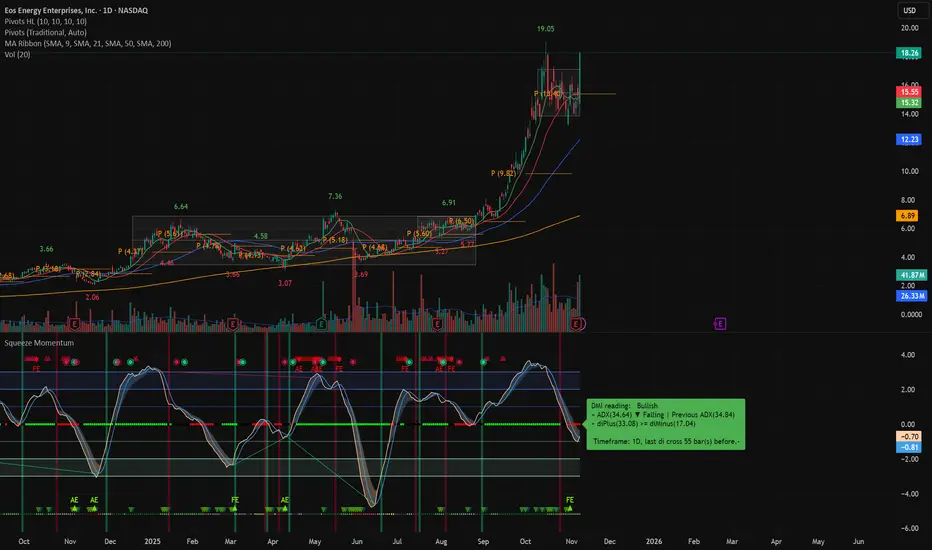
A SetupWhat qualifies as an A+ setup (Big Three)
Compression: A valid Big Three squeeze on your chosen timeframe.
Signal: Big Three Buy Signal present.
Trend filter: Price above the moving averages.
Multi-timeframe game plan
Anchor (bigger picture): Daily / 3-day squeezes to define backdrop & runway.
Trigger (trade timeframe): 2-Hour (or 30-min/15-min/5-min) A+ squeezes for entries.
Bias maintenance: Hold only while the price stays above the trailing stop and the structure stays bullish.
Pre-flight checklist (grade it fast)
Squeeze present on your entry timeframe (2h / 30m / 15m / 5m).
EMA stacked in order (no exceptions for A+).
Trend/structure: Uptrend or at least neutral turning up.
Bigger picture alignment: Daily / 3-day not fighting you; momentum not deeply negative.
Nearby “fuel” (levels): Key MAs (e.g., daily 50), pre-break accumulation, gamma call walls, and recent highs.
Entry & management (simple and consistent)
Entry trigger options
First break out of the squeeze range with structure and signal intact.
Or pullback-to-hold above trailing stop/MA inside the squeeze; buy the next higher low → higher high sequence.
Initial risk
Stop: just below the trailing stop or last pivot low inside the squeeze.
Positioning: size so a stop hit ≈ 0.5R of daily risk (or less).
Profit taking
Tier 1: prior swing high / measured move from squeeze range.
Tier 2: roadmap targets (recent highs, round numbers, and gamma walls).
Trail partial with trailing stop; roll or trim if momentum cools.
What cancels A+ mid-trade
Lose the buy signal and close below the trailing stop, 8 EMA.
Momentum rollover on your entry TF while higher TFs aren’t supportive.
Repeated failed reclaims of the squeeze top.
Plan
A+ vs “Almost A+” (how to decide)
A+ now = All four: Squeeze + Buy Signal + Above trailing stop.
Almost A+. Missing momentum.
Action: Stalk on lower TFs (5m/15m) for earlier entries, but only size up when the main TF prints full A+.
Execution guardrails (to keep your edge)
Don’t force entries before the squeeze/score/signal align—let it become A+.
If you take a starter on a lower TF, earn the add-on higher-TF confirmation.
Respect gaps: lock tiers into gap pushes from active squeezes.
Keep a daily max loss; after 2R down or 2 invalid setups, flatten and reset.
Screener:
www.tradingview.com
Before DOW 50K Happens (DJI long call for holders)Remember the future. Beware of the past. This time it's different. That's all.
I recommend studying Richard Wyckoff Stock Trading Technique, but not Tape Reading because that information is past its prime, in my opinion ;)
There's nothing left but upward ascent for humanity in my view. This is to do with spiritual reasons that many of us traders are privy to in our inner circles.
This chart is directed guidance towards the g20 group and the G7 group of Countries we call Home on Earth protectors.
We use capitalization as necessary to achieve the desired effect, affect, or required attribute enrichment in order to AVOID City 17, and not have to go back to the old ways of fearing totalitarian rule.
I posit that Donald Trump, The President of the United States of America, will eventually reply to my Christmas letter from 1993 and finish Home Alone 3, but I degress.
Some of us write letters. This is one such letter to the public; I used to write letters to Bill Gates on an IBM PS2, if you know your stuff.
This is my final chart, at least for a while. I always say something like that when I post a grand prediction like this one.
I bid you all well, and hope you find fruitfulness in your future life endeavors.
BLUEDOG OUT

Overview: BTCUSDT 7D overviewHere's a technical analysis of your BTC chart:
📊 **Chart Overview: BTCUSDT 7D (Weekly) Timeframe**
🎯 **Key Patterns Identified:**
**1. Cup & Handle Formation** ☕
- Large cup pattern formed from 2023-2024
- Handle currently forming in the consolidation zone
- Classic bullish continuation pattern
- Breakout target potentially above $150K based on cup depth
**2. Fibonacci Levels** 📐
- Price consolidated around 0.5 Fibonacci retracement (~$125K area)
- Strong resistance at 0.618 level
- Currently testing key support/resistance zone
**3. Trend Analysis** 📈
- **Orange ascending trendline**: Long-term bullish support from 2023
- Price respecting this major uptrend
- Multiple touches confirm validity
**4. TesseractPro Oscillator** 🌊
- Currently showing: 2,159.10 / 1,187.49
- Peaked and now declining
- Suggests momentum cooling off
- Potential bearish divergence forming
**5. Volume Analysis** 📊
- **Vol 3M**: Shows declining volume during recent consolidation
- Lower volume = weaker conviction
- Need volume spike for breakout confirmation
**6. Price Action Zones** 🎯
- **Current Price**: ~$132,965
- **Resistance**: $140K-$150K zone
- **Support**: $110K-$120K area (handle bottom)
- **Critical support**: Orange trendline (~$90K-$100K)
**7. Cycle Analysis** ⏰
- Chart shows projection into 2027
- Suggests multi-year bullish cycle continuation
- Current consolidation is healthy for next leg up
**Scenarios:**
📈 **Bullish Case:**
- Break above $140K with volume confirms cup & handle
- Target: $180K+ based on pattern projection
- Orange trendline holds as dynamic support
📉 **Bearish Case:**
- Break below handle support (~$110K)
- Oscillator weakness continues
- Could retest orange trendline (~$90K-$100K)
- Still bullish long-term if trendline holds
**Current Status:** ⚖️
Price is in consolidation/handle formation. Oscillator weakness suggests potential pullback before next major move up. Watch for volume expansion and trendline support.
**Key Levels to Watch:**
- 🟢 Breakout: $140K+
- 🔴 Breakdown: $110K
- 🚨 Critical: $90K (trendline)
The overall structure remains bullish long-term, but short-term consolidation or pullback is possible given oscillator divergence and low volume. 📊✨

Sundaram Fastners Limited AnalysisPrice Takes liquidity From Discount Zone ,Making HH HL Ready to approach Monthly FVG

BIT500: Prediction Markets — From Polymarket to InfoFiIn the dynamic crypto landscape of September 2025, prediction markets are evolving into powerful tools for aggregating information and speculation. Polymarket is experiencing explosive growth, with trading volume up 50% month-over-month, reaching $1.16 billion in June and $7.5 billion for the year. This reflects a shift from simple betting to InfoFi—"information finance," where markets not only forecast events but also generate valuable analytics. From BIT500, a leading analytics platform focused on AI-driven signals and on-chain metrics, we analyze Polymarket’s rise, InfoFi signals, and trading opportunities. Our tools track volumes, RSI, and MACD for related assets (USDC, POLY-like tokens, DeFi tokens). Data as of September 16, 2025—perfect timing for positioning ahead of Q4 rallies.
BIT500 equips traders with real-time dashboards; sign up for demo access to seize the advantage.
Polymarket’s Growth: +50% Volume and Leadership in Predictions
Polymarket, a decentralized platform on Polygon, is recording record growth: trading volume up 50% in August-September, with $1.16 billion in June and a total of $7.5 billion in 2025. This is a 300% increase from 2024, driven by bets on elections, recessions, and crypto trends (e.g., “US recession in 2025” at 40% probability). The platform uses USDC for betting, capturing 75% of the prediction market share, surpassing Kalshi (a CEX alternative).
Growth drivers: Web3 integration (NFT betting, DAO voting), institutional inflows ($2 billion), and AI analytics for precise forecasts. On-chain: Transactions up 25%, holder count exceeds 1M, with TVL at $150 million. BIT500’s AI detects a 71% bullish sentiment: Polymarket correlates with BTC (0.6), boosting DeFi liquidity.
From Polymarket to InfoFi: The Evolution of Information Markets
InfoFi is the next frontier, where predictions become “information finance”: markets cover not only events (elections, sports) but also data (AI trends, social signals). Polymarket leads, but InfoFi extends to Kaito (tokenized insights), Cookie3 (social-fi predictions), and Galxe (quest-based markets). The InfoFi market grew 150% YTD, with TVL at $500 million, aggregating “crowd wisdom” for forecasts 20% more accurate than polls.
InfoFi signals: Polymarket/Kaito RSI at 55–60 (neutral-bullish), MACD divergence points to growth. On-chain: Inflows to InfoFi protocols up 30%, with whale activity in USDC (betting collateral). BIT500 forecasts $10 billion TVL by 2026, with a 0.7 correlation to ETH for DeFi integrations.
Trading Opportunities: MACD, RSI, and BIT500 Signals
BIT500 leverages AI for signals on related assets (USDC for betting, ETH/Polygon for platforms). Levels based on the April 2025 trend.
USDC (Polymarket betting): Support at $0.999–$1.000 (50% Fibonacci). Resistance at $1.001–$1.002. RSI at 58 (bullish momentum). MACD: Crossover above zero—signal for 0.2–0.5% arbitrage (Binance premium). On-chain: Inflows $2.5 billion, TVL +15% in InfoFi.
MATIC (Polygon, Polymarket’s base): Support at $0.45–$0.48 (38.2% Fibonacci). Resistance at $0.52–$0.55. RSI at 62 (healthy trend). MACD: Histogram +0.12—10% growth to $0.55. On-chain: Transactions up 20%, InfoFi integration +25% volume.
InfoFi Aggregate (Kaito/COOKIE tokens, ~$0.85 equivalent): Support at $0.75–$0.80 (61.8% Fibonacci). Resistance at $0.90–$0.95. RSI at 55 (bullish divergence). MACD: Bollinger squeeze—8–12% breakout. On-chain: Holder growth +10%, DeFi TVL $100 million.
Overall trend: RSI 56–60, MACD bullish—enter at supports for 10–20% upside in Q4. Risks: Regulation (CFTC scrutiny), hedge with USDC.
Conclusion: Trade Predictions with BIT500
Prediction markets, from Polymarket (+50% volume) to InfoFi, are a breakthrough, with $7.5 billion in trading and $500 million TVL. MACD and RSI signal a bullish trend for USDC/MATIC. BIT500’s AI is your guide for signals and on-chain insights.
Ready to bet? Join BIT500 for alerts. Which prediction market interests you? Comment below!
#PredictionMarkets #Polymarket #InfoFi #MACD #BIT500
MEV Bot Exploit by MIT-Educated Brothers Leads to $25M CryptoIn the dynamic world of crypto trading, where cutting-edge innovation meets finance, abuses are inevitable. One of the most prominent cases of the year involves brothers Anton and James Peraire-Bueno, MIT graduates accused of exploiting Maximal Extractable Value (MEV) strategies to siphon off $25 million from the Ethereum ecosystem within seconds. The case may set a precedent for how automated behavior in decentralized systems is judged under traditional legal frameworks.
What Happened?
According to the prosecution, the brothers deployed several Ethereum validators and used specialized algorithms to reorder transactions within blocks. This allowed them to front-run other MEV bots and redirect transaction flows in their favor—a textbook mempool attack. In just 12 seconds, they allegedly drained $25 million in ETH and other digital assets.
Why Is This Case Unique?
First major MEV case involving such significant financial losses
Criminal charges despite actions operating within protocol rules
Academic background of the defendants adds to the public intrigue
This case raises a key legal question: Can actions that are technically “legal” under protocol rules still constitute fraud if they are knowingly harmful to other participants?
Implications for the Crypto Industry
The trial could redefine ethical and legal standards in the DeFi and automated trading sectors. If convicted, this could trigger a broader review of front-running bots, sandwich attacks, and other MEV strategies that, until now, have existed in a legal gray area.
As the regulatory landscape evolves, this trial may become a cornerstone in shaping how future MEV tactics are governed—and how automated trading fits into the legal definition of financial manipulation.

Long-Term Gold Analysis (XAU/USD)Gold has been stuck in a range for about 92 days, and recently, price action within the range has become increasingly compressed.
This tightening suggests that a breakout in either direction could lead to the beginning of a new long-term trend.


EUR/USD CRAZZYY BULLISH BIAS (SMC Perspective) | 1H Outlook🔍 Analysis Summary:
Price is consolidating above a clear demand zone after breaking previous structure to the upside.
We’ve seen liquidity engineered above the swing high (marked X), followed by internal structure developing.
I’m watching for a sweep into demand (grey zone) between 1.1520 – 1.1540, followed by a bullish reaction.
Expecting a bullish BOS (Break of Structure) on the lower timeframe to confirm continuation to 1.16340.
📌 Key Levels:
Demand Zone: 1.1520 – 1.1540
Liquidity Sweep: Above recent highs (1.1596)
Target Zone: 1.16340
Invalidation: Clean break below 1.1500
🗓️ Fundamental Drivers to Watch:
USD Weakness – Driven by:
Recent soft CPI & PPI data (cooling inflation)
Increased chances of Fed rate cuts (starting September 2025)
Risk-on market sentiment pushing money out of the USD
Upcoming News Events:
Wed 19 June – Fed Chair Powell Speaks 🗣️
→ Any dovish tone supports the bullish EUR/USD case
Thu 20 June – Initial Jobless Claims 📉
→ A higher-than-expected print could confirm labor market weakness = USD bearish
Fri 21 June – Flash Manufacturing/Services PMI (EUR & USD)
→ EUR strength + weak US data can fuel upside
🧠 My Plan:
Watch for a liquidity sweep into demand
Wait for bullish confirmation on M15 or M5
Target previous high & continuation toward 1.16340
💬 Follow for more SMC-based breakdowns. Let’s stay sharp and react, not predict.
#EURUSD #SMC #SmartMoney #LiquiditySweep #ForexTrading #OrderBlocks #sam_trades_smc #PriceAction #FOMC #Fed #USD

Gold (XAUUSD) Trading Setup – Mid-June 2025 Analysis🔰 Gold (XAUUSD) Trading Setup – Mid-June 2025 Analysis
This chart represents a strategic price action-based setup on Gold (CFDs on Gold – US$/Oz) using a 15-minute timeframe. It includes clearly defined entry zone, support/resistance levels, and profit-taking targets (TP1, TP2) for both bullish and bearish scenarios.
🔍 Current Market Context
Current Price: ~$3431.77
Structure: The price has been in an upward trend with a consolidation phase forming near the key mid-zone.
Highlighted Zone: A decision zone is marked in red (between ~$3422 and ~$3418), acting as the key liquidity zone or breakout area.
📈 Bullish Bias
If price breaks and holds above the red zone:
✅ TP1: $3480
✅ TP2: $3580
These levels act as short- to mid-term bullish targets based on projected extensions of recent upward momentum.
📉 Bearish Bias
If price breaks and holds below the red zone:
✅ TP1: $3320
✅ TP2: $3260
This indicates a possible reversal or correction phase, with targets derived from recent swing lows and support areas.
📌 Trading Notes
The blue shaded areas represent target zones for partial or full exits.
Red zone is the critical breakout decision point.
Ideal for breakout or pullback traders.
Can be combined with volume/confirmation indicators (e.g., RSI, MACD, or price action candles) for entry timing.

Buy trade on EURUSD Ok. From my strategy stand point, I see a potential buy on EU, reason been that price broke out of my trend line and gives me an abc setup , then I locate my poi, which I s my entry point, so i am in for a buy

4/30 Gold Trading SignalsGold showed limited movement yesterday and did not enter either of our predefined major trading zones, leading to minimal profits.
As of now, the price continues to consolidate. A larger movement is likely to occur during the U.S. session following key economic data.
Until then, consider short-term range trading between 3330-3290.
📌 Why Today’s Data Matters
Gold has been trapped in a tight range for several sessions, and a directional breakout is imminent.
Today’s data release will likely dictate that direction, so it is crucial to stay alert.
✅ Data-Driven Strategy:
If data is bullish (gold rallies):
Avoid chasing the initial breakout. Wait for the first spike to settle, then short the retracement, with a TP of less than $10.
If bulls remain strong, the retracement should stay under $20. Once short positions are closed, watch for confirmation to go long.
If data is bearish (gold drops):
If price doesn't reach the lower buy zones(3258-3223), wait for a minor rebound to short, targeting the next leg lower.
📌 Today's Suggested Trade Zones:
🔻 Sell Zones:
3378–3418
3330–3358
🔺 Buy Zones:
3258–3223
3110–3330 (ladder entries)

4/29 Gold Trading SignalsThe buy orders initiated around 3273 yesterday have already delivered solid profits.
After a slight rally at today’s opening, gold prices have pulled back.
Currently, the candlestick formation shows no clear directional trend, while some short-term technical indicators are pointing downward.
Before any corrective signals appear, we need to closely watch the support near 3306.
As long as this level holds, the short-term bullish momentum still has a chance to continue.
On the news side, today's scheduled data releases are of minor impact.
Focus instead on developments regarding the India-Pakistan situation and US Treasury Secretary Bessent’s press conference.
If geopolitical tensions escalate, gold may break out to new highs.
🔹 Today's Trading Strategy:
Sell within 3407-3428 zone
Buy within 3258-3223 zone
Flexibly trade between 3346-3313 / 3378-3336 / 3273-3316 zones
Please manage your positions carefully and stay alert for unexpected market moves.

BTC Gann Box Symmetry - Bearish ScenarioTake a look at my spin on a Gann projection with symmetry in mind
BYBIT:BTCUSDT.P BITSTAMP:BTCUSD

How Gann’s Square of 9 Reveals Hidden Time Cycles in the US500In today’s fast-moving markets, most traders are stuck reacting, chasing signals, hunting for breakouts, and trying to make sense of noise. But what if you could predict where the market might turn, not just based on price, but on time itself?
That’s exactly what W.D. Gann mastered. His tools, like the Square of 9, weren’t just about charts, they were about timing the rhythm of the market. Today, I’ll walk you through a real-world example on the US500, using Gann’s time technique on the 5-minute chart. This isn't theory. This is how you can bring Gann’s legacy to life in real-time trading.
Step 1: Don’t Start on the 5-Minute—Zoom Out First
The first thing to understand is that not every swing high or low is meaningful. To apply Gann’s time analysis correctly, you must choose swing points that matter—and that means looking at the higher timeframes.
Before diving into the 5-minute chart, I always analyze the 15-minute, 1-hour, and 4-hour charts. If a swing high or low on the 5-minute lines up with a key support or resistance zone from those larger timeframes, that’s your signal. These are levels where institutions and big players act, and that gives your analysis a real edge.
So, once I identified a swing high and low on the 5-minute chart that aligned perfectly with a 1-hour resistance zone and a 4-hour support level, I knew I had something solid.
Step 2: Counting Bars – The Foundation of Time Analysis
From the chosen swing low to the swing high, the market took 9 bars to complete the move. That number isn’t just a count—it becomes our anchor in time.
Using my custom-built Gann Square of 9 spreadsheet, I plugged in this value. The spreadsheet then calculated future bar counts where the 45-degree time angle repeats, based on Gann’s time rotation principle.
The output gave us these key numbers: 16, 25, 36, 49, 64, 81
These are not arbitrary. They are time-based vibration points derived from Gann’s spiral math—each one representing a future window where the market is likely to shift.
Step 3: Letting Time Lead the Trade
Let’s walk through what happened at each of these time windows:
Bar 16: The market attempted to push higher—a classic manipulation move. Then came a sharp reversal. The 45-degree vibration was in effect. This was a textbook Gann-style turning point.
Bar 25: No sharp reversal, but momentum slowed and price started consolidating. This was a structural pause—just as important as a reversal for those watching intraday shifts.
Bar 36: This one was dramatic. The market had been falling, but as we approached the 36th bar, rejection candles started appearing. Selling pressure dried up, and buyers stepped in. Soon after, a bullish breakout followed. The time vibration had called it again.
Bar 49: After a strong bullish run, the price stalled and reversed almost precisely at this time point. This marked a shift back to bearish sentiment.
Bar 64: The downtrend lost steam. Price began forming a new swing low, and as we passed the 64-bar mark, bullish momentum returned. Another clean reversal.
Bar 81: The final vibration in this sequence. The bullish move slowed, candles shrunk, and volume faded. Then came a breakdown. A bearish turn right on time.
What This Means for You as a Trader
This sequence—from bar 16 to 81—is a masterclass in how time drives the market. It shows that price action is not random. It's governed by hidden cycles that most traders overlook. But when you apply Gann’s methods with precision, the market reveals its rhythm.
All we did was:
Identify a meaningful swing (validated by higher timeframes)
Count the bars between the swing low and high
Let the Square of 9 calculate the future time vibrations
From there, we simply watched and waited. And the market played out almost to the bar.
Conclusion: From Reactive to Predictive Trading
The real power of Gann’s techniques lies not in magic, but in mathematical and astrological precision. When you understand how time and price interact, you stop reacting—you start forecasting.
You stop chasing trades—you start anticipating reversals.
Gann’s Square of 9 isn’t just an old-school tool. With the right application, it becomes a modern forecasting machine. And with the help of tools like my custom spreadsheet, the entire process becomes simple, streamlined, and incredibly effective.
So the next time you’re about to take a trade, ask yourself:
Are you following price? Or are you following time?
Because when time is on your side, the market moves in your direction—not the other way around.

92% Win Rate Strategy Using Gann’s Planetary LongitudeHave you ever wondered how some traders seem to anticipate market reversals with uncanny precision, almost as if they can see into the future?
Well, what if I told you that the secret doesn’t lie in guesswork or traditional retail indicators, but in the heavens themselves?
Let me walk you through one of the most powerful forecasting tools in Gann's arsenal—the Planetary Longitude Method and how I used it to identify the exact price level from which the market reversed.
The Power of Planetary Time Cycles in Trading
This technique isn’t based on patterns, trendlines, or lagging indicators. It’s rooted in precise planetary time cycles, the same natural laws that govern the movement of celestial bodies.
Gann believed the markets were not chaotic but deeply connected to universal rhythm and planetary motion. According to his planetary longitude method, each planet holds a specific degree of longitude at any given time. These degrees can be directly mapped onto price charts, turning astronomical data into actionable trade setups.
When price meets planetary longitude, something extraordinary happens. These degrees act as invisible support and resistance levels—ones that retail traders never see. They are silent yet powerful markers of change, and because they are rooted in cosmic cycles, they give you a strategic edge in timing your trades.
Why These Degrees Matter
As a trader, what you’re truly looking for is reaction zones, areas where price is likely to pause, reverse, or accelerate. When planetary time and market price converge at a particular degree, it creates what Gann called a "vibrational point", a moment of energetic alignment. These are high-probability zones where you can anticipate market turning points with accuracy.
By tracking the longitudes of key planets, such as the Sun, Moon, Mars, Jupiter, or Saturn—you can identify these critical junctures. Each planet brings its own cycle, its own tempo. For deeper, longer-term reversals, I often rely on the slower-moving planets like Pluto, while for short-term setups, I look at the faster ones like the Moon or Mars.
How I Forecasted the US100 Reversal from 19,384.6
Now, let’s get practical.
In this recent example, I was closely watching the US100 index, where I anticipated a potential reversal around the level of 19,384.6. Was this just another support/resistance zone? Absolutely not.
Here’s how I arrived at this precise level using Gann’s Planetary Longitude Technique:
First, I took the price level of 19,384.6 and converted it into degrees. To do this, I simply subtracted 360 repeatedly from the price until I arrived at a number less than 360. This process is based on the 360° circle of the zodiac—once the price cycles through the full circle multiple times, what's left is the vibrational degree associated with that price. In this case, the price level of 19,384.6 converted to approximately 304.6°.
Then, I checked the planetary position of Pluto which was 303.55° in longitude.
This created a near-perfect alignment between Pluto’s time cycle and the vibrational price degree. When planetary time meets price, it forms a cosmic convergence zone—a point of natural balance where the market is highly likely to react. So, I wasn’t just guessing—I was waiting for that moment of planetary resonance.
And as the chart clearly shows, the market reacted sharply the moment it touched 19,384.6, confirming the sensitivity of this degree. It wasn’t random. It was a harmonic response, echoing the laws of cosmic vibration that Gann so strongly emphasized.
This is a real-time example of how combining planetary time with price geometry can give you a decisive trading edge, especially in forecasting major turning points.
Why This Method Works
The market respects these planetary degrees not because of mysticism, but because it moves in cycles—natural cycles that repeat. The alignment of price with planetary longitude often marks pivot points in the market.
And this method doesn’t just help with identifying reversals. It also enhances your entry and exit timing, allowing you to trade with confidence, knowing you're aligned with the larger cosmic structure that influences all things—including financial markets.
Final Thoughts
This is just one example of how planetary geometry, when applied correctly, can lead to powerful trade setups. While Pluto offers long-term signals, don’t underestimate the value of the Moon, Mars, or Jupiter for shorter timeframes. The market dances to their rhythm too.
And once you learn to listen to that rhythm, you'll never look at price the same way again.

BTC up Or DownBitcoin has not yet completed its ascending channel, with the possibility that inflation and unemployment will increase under Trump's economic policy. Bitcoin price may reach 130k and 200k, but if Trump's economic surgery really works, it will fall to 60k. I am not optimistic about Trump's economic policy. The chart below is drawn with a Gann box.
