KEG ROYALTIES INCOME FUNDKRIUF.OTC PINK, KEG-UN.TO Keg Royalties Income Fund Gap is the game Change on this stock Keep this one on your watch listKLongby TheStockWhisper220
SLV GapsAMEX:SLV As SLV works it way through its levels the best support and resistance could be a Fibonacci. It is important to note that throughout the summer as SLV had approached these levels leading up to the swing high it gapped up above all the levels except .382. I'm unsure why it has seen so many large jumps in price but it could be forming a double bottom at 20.51 and move back up next week to chase fills on some of these untouched areas. by crawfordpaul221
Bullish reversal with a gap to fill aboveUpdated from the earlier idea with adjusted fibs. Where the extension from March to recent monthly highs aligned, I used that fib as marked entry. Solid uptrend established Still oversold on the daily Entry near the fib especially after a successful backtest as support would be a solid entry. First gap comes from a large space in which there was no candle closures since the gap down; this may not be a technical gap down but may have an impact on price action. The true gap is small and marked within. Either way, this should make a nice move upward through that space. Longby SpinTradesUpdated 4
William Hill -6% Gap FillWilliam Hill has gapped up, so I expect this gap to be filled, giving short sellers an opportunity for 6% profit.WShortby James_Winsoar113
Ocado -5% Gap FillOcado has gapped up - giving opportunity for 5% gains by short selling this gap fill.Shortby James_Winsoar446
NASDAQ: Daily Next Support $9838 and $9018There is a 9% price drop until the next support is hit. Most recently on Friday the support at $10747 was hit and there was a slight bounce. The expectation is now some sideways slightly down action. If there is a 50% retractment to 11k it would meet expectations. The green lines on the chart is the daily gap up and shows support. The next support is at the minor high of of $9838, which comes right around a nice $10,000 number. "Nice" numbers are more psychological and they provide support and resistance. If you see there was a nice gap up at $7,000 and from there there NASDAQ never look back till 12,000. Enjoy all the Support lines. :) P.S. This analysis was mainly done in conjunction with my podcast where I explain Support and Resistance using Gap Ups and Different Time Frames Below is the hourly Chart Analysis: Shortby HaleyZhao2
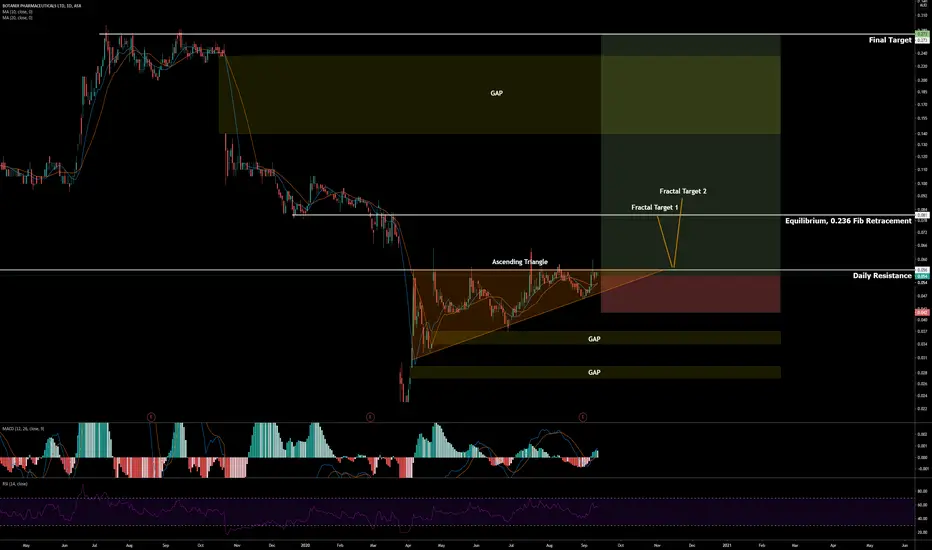
BOT Ready to GAP(ASX:BOT) Botanix Pharmaceuticals Limited is a clinical stage synthetic cannabinoid company based in Perth (Australia) and Philadelphia (USA) committed to the development of pharmaceutical products that are underpinned by science and supported by well-controlled randomised clinical trials. Technicals: Shaping up to GAP - Ascending Triangle Pattern - 10/20 MA Golden Cross - RSI Bullish + Above the 50 - MACD Bullish and Spread - Fractal Target 1 lining up with Previou EQ and 0.236 Fib Retracement @ 0.081 - Fractal Target 2 close to another Resistance level @ 0.095 - GAPs Present @ 0.14 - 0.234, 0.027 - 0.029, 0.034 - 0.037 - "Golden Pocket" 0.5-.618 Fib Retracement sitting within 0.14 - 0.234 GAP - Stop loose @ 0.042 Fundamentals: Undervalued, Debt Free, +$20 Million Cash - Multiple Phase 2 Clinical Trials underway with FDA Meetings successful for there Cannabinoid Products. - Antimicrobial Study Phase 2 to be completed 4th Quarter 2020 - World Class Board of Directors & Advisors with Key Experience in Management, Research & Development, FDA Approvals, Pharmaceuticals, Therapeuticals - Debt Free with $24.6 Million in Cash and Investments - Total Liabilities of $1.37 Million covered by $24.7 Million in Assets Technically and Fundamentally this is shaping up to be a great Trade & Long term Investment. My only Concern is how the effects of COVD19 will weigh on the Therapeutic/ Pharmaceutical Industry. Definitely a Sector and Company to keep watch of. Setups/Strategies should be based on Individual Trade/ Risk Management Plan These Ideas are NOT 'Financial Advice'!. Scenarios are based off a mixture of TA and Fundamentals current at the time. All IMO GLTAH. Happy Hunting!!!Longby Trader_Johnni778
Bitcoin could drop 15%Due to a gap in the bitcoin futures chart. These gaps always tend to get filled, so if the price does drop to this level it could be a good time to buy the dip.Shortby James_WinsoarUpdated 113
Barrick Gold Could Drop 8% To Fill GapLook carefully at the opening action today as a gap fill could be likely in the next few days.Shortby James_WinsoarUpdated 0
Persimmon could see -5% pull backGaps normally get filled pretty quickly on the 1 day Persimmon chart, and with RSI levels being quite high a pull back is likely in my opinion.Shortby James_WinsoarUpdated 0
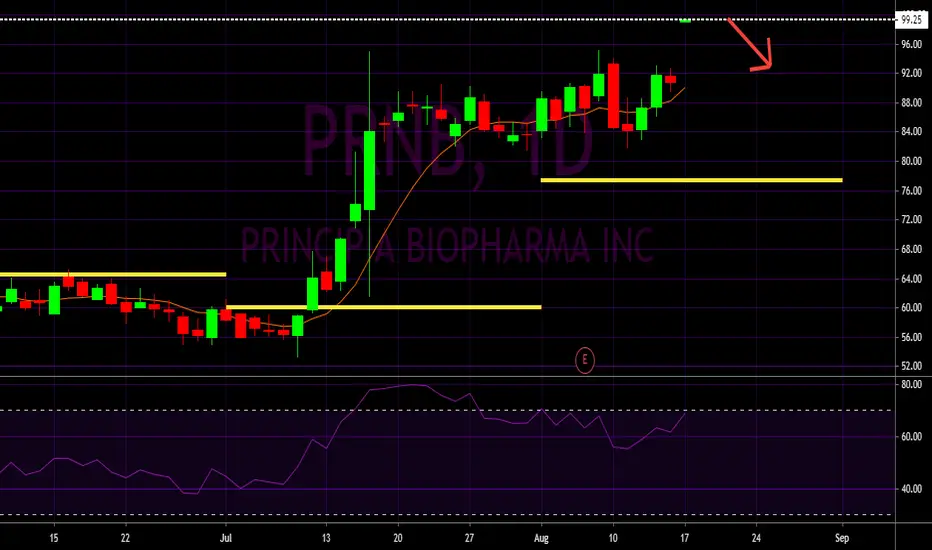
PRNB could drop 6%To fill the gap up. Watch for action on this stock at start of trading today.PShortby James_Winsoar110
Ryanair to drop 5%Opportunity to short Ryanair and take advantage of the gap fill that is likely to occur over the next month or so.RShortby James_WinsoarUpdated 338
Gap Up, RSI Overbought In Progress, MACD BearishGap Up : 0.050 (25%) Stop Loss : 0.290Iby RozaniGhani-RGUpdated 0
Gap Up, RSI Overbought, MACD BearishGap Up : 0.080 (30.77%) Stop Loss : 0.275by RozaniGhani-RGUpdated 0
ADT OPTIONS | How To Play The Gap UpSimple Technical Analysis On ADT, Plus This Weeks Options Plays. With both of these plays, it will be up to you to secure profit. Do not trade this though, you will lose money :) Long ($16 Breakout): Premiums will be extremely expensive on the call side, important that we wait for confirmation or else we will get clapped quick from a rip down The Call: $12.5 Call 8/21 @ $330 avg Short ($13.26 Level): Premiums on the put side are extremely cheap for mainly one reason, the gap up. If played correctly, times like this can provide an amazing day trade opportunity. The Short: $7.5 Put 9/18 @ $12 Strictly educational purposes only DotcomJackLongby DotcomJack6
Perfect GAP Up Trade in DELLPre-market gap up over numerous pivot point resulted in a perfect buy trade at open. Sorry got late in posting, should have posted before 9.30 :)Educationby prashant228671
Woah! This thing identifies SPY gappers!So previously, I released an indicator called "Bunch of Numbers", believing that it was pretty useless. BUT guess what? It turns out that SPY gappers (up and down) have pretty similar sequence of numbers. WARNING: these same numbers have also caused SPY to gap down!! A "Bart" pattern with these numbers at the end will almost always be a gap down. My methodology: 1) 3 minute chart 2) has to be within 15 minutes of close. Some of these only appear in the last 3 minutes of close. 3) 7's at the bottom of the screen signify that price is touching the 200MA on the 3minute chart. 4) There is no logic or reason behind why a number is labeled "9" instead of "5". It's just a label that the programming gave to a set of conditions. I could have easily labeled these candles with the alphabet 5) Like I said, these same numbers have been known to also GAP DOWN>< Educationby ZombieStarUpdated 227
Updated Technical Analysis on SPY 7.13.20Sentiment: Short term Bearish Reasons: 1.Strong Weekly Resistance (Now Support) at 317.59 2. Bearish Island Gap on Daily Chart 3. Bullish Channel Breakdown 4.Selling Volume Increase 5. Rising Wedge Pattern Formed After Market Open Gap up 5. Decrease in Overall Volume During this Pattern formation Confirms its StrengthShortby DannyNoburu7
GLPI : From Hedge Fund's BasketNo more words. Chart explains all things. Read the chart.Longby Chart-read4
TSLA -!Only an Idea!-Alright so I've been looking at TSLA charts for a while now. Every day it seems it gaps up so i'm going to try an experiment with the Chart itself, so I could possibly start making a better strat to follow TSLA and all it's volatility and pattern breaking tenancies. For my first little test im just going to try to find where it tends to gap up every day in the morning. First idea is to see if it gaps up to the HOD from the previous day every time. Remember if you'd like to join the Trading group message me. It costs money so be prepared if you're going to join.by GoEasyScoobsUpdated 115
OMP - HUGE Gap up?Have to wait and see on this one, but pretty clear where it should go. Have to see if it can hold and what the earnings are :)OLongby DigitalData6