Potential Decline of Natural Gas Prices to $2.43–$2.74Brief Overview of Events and News Explaining the Potential Decline of Natural Gas Prices to $2.43–$2.74.
➖ Weather Forecast and Reduced Demand
On April 23, 2025, the U.S. National Weather Service forecasted milder-than-average weather across the U.S. for late spring and early summer 2025, particularly in key gas-consuming regions like the Northeast and Midwest.
Warmer weather reduces the demand for heating, a primary driver of natural gas consumption. This led to a 2.5% decline in Henry Hub natural gas futures, settling at $3.05 per MMBtu on April 24, 2025.
Source: Reuters
➖ High U.S. Natural Gas Inventories
The U.S. Energy Information Administration (EIA) reported on April 17, 2025, that natural gas inventories increased by 75 billion cubic feet (Bcf) for the week ending April 11, 2025, significantly exceeding the five-year average build of 50 Bcf. Total U.S. inventories are now 20% above the five-year average, indicating an oversupply that pressures prices downward.
Source: EIA, "Weekly Natural Gas Storage Report," April 17, 2025
➖ Weak Global LNG Demand
On April 22, 2025, Bloomberg reported a decline in demand for liquefied natural gas (LNG) in Asia, particularly in China, due to an economic slowdown and a shift to cheaper coal alternatives. China’s LNG imports in Q1 2025 dropped 10% year-over-year, reducing export opportunities for U.S. gas producers and adding pressure on domestic prices.
Source: Bloomberg, "China’s LNG Imports Fall as Coal Use Rises," April 22, 2025
Technical Analysis
Natural gas futures (NYMEX) are currently around $3.15 per MMBtu as of April 28, 2025, following a recent decline from a peak of approximately $4.90 in 2025.
Fibonacci retracement levels indicate correction targets at 38.2% ($2.74) and 50% ($2.43).
Fundamental factors, such as oversupply and reduced demand, support a bearish scenario that could drive prices to these levels in the near term.
Nearest Entry Point Target:
• $2.74
Growth Potential:
Long-term:
• $10
Screenshot:
GAS

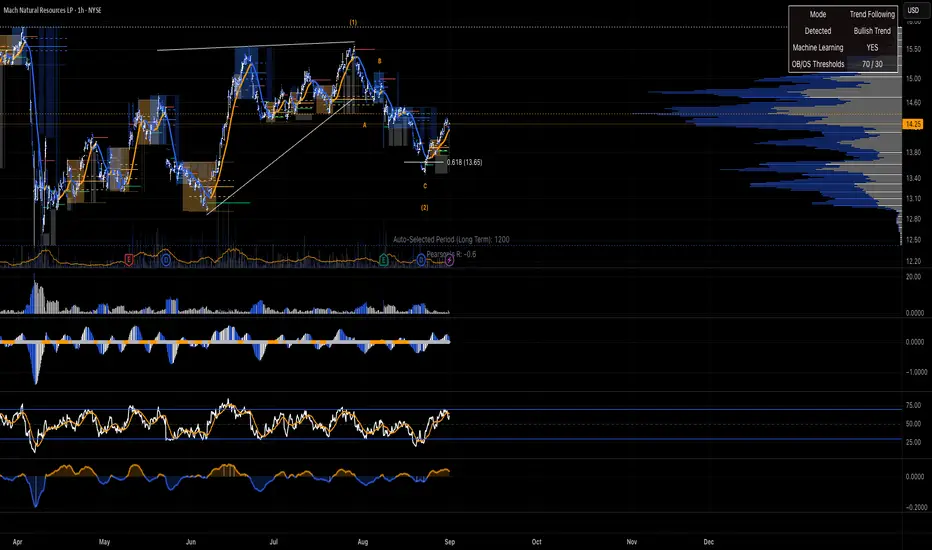
Mach Natural Resources LP $MNR ~ Bulls Inbound...Mach Natural Resources LP engages in the acquisition, development, and production of oil, natural gas and liquids. Its reserves are located in Anadarko Basin, Southern Kansas, and Texas. The company was founded in 2017 and is headquartered in Oklahoma City, OK.
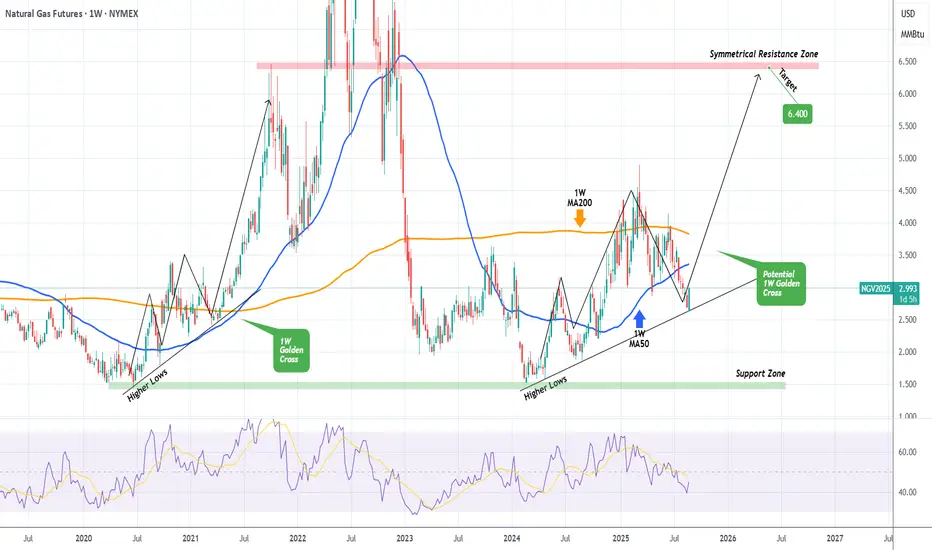
NATURAL GAS rebounding on a 1.5-year Support! Bullish.Natural Gas (NG1!) is having a strong green 1W candle, coming off a 2-month decline. It is highly likely that this correction has come to an end as the price hit this hit (and thus rebounding on) the Higher Lows trend-line that started all the way back since the February 20 2024 market bottom.
Technically the whole pattern from that day until now looks similar to the June 22 2020 - March 15 2021 sequence, which initiated a stronger 3rd Bullish Leg all the way to the Symmetrical Resistance Zone.
A potential 1W Golden Cross would confirm this upward break-out, just like it did on June 14 2021.
If that takes place, our long-term Target would be 6.400 (Symmetrical Resistance Zone).
-------------------------------------------------------------------------------
** Please LIKE 👍, FOLLOW ✅, SHARE 🙌 and COMMENT ✍ if you enjoy this idea! Also share your ideas and charts in the comments section below! This is best way to keep it relevant, support us, keep the content here free and allow the idea to reach as many people as possible. **
-------------------------------------------------------------------------------
💸💸💸💸💸💸
👇 👇 👇 👇 👇 👇
NATGAS SHORT FROM RESISTANCE|
✅NATGAS is set to retest a
Strong resistance level above at 2.945$
After a local bullish correction
Which makes a bearish pullback a likely scenario
With the target being a local support below at 2.80$
SHORT🔥
✅Like and subscribe to never miss a new idea!✅

NATGAS Risky Short! Sell!
Hello,Traders!
NATGAS is trading in a
Downtrend and the price
Is making a local rebound
And will soon hit a horizontal
Resistance of 2.76$ from where
A local bearish correction
Is to be expected
Sell!
Comment and subscribe to help us grow!
Check out other forecasts below too!
Disclosure: I am part of Trade Nation's Influencer program and receive a monthly fee for using their TradingView charts in my analysis.
NATGAS WILL KEEP FALLING|SHORT|
✅NATGAS is going down currently
As the Gas broke the key structure level of 2.73$
Which is now a resistance, and after the pullback
And retest, I think the price will go further down
SHORT🔥
✅Like and subscribe to never miss a new idea!✅
India’s Andaman Sea Oil Prospect: A Strategic Inflection PointThe Discovery: Unprecedented Potential
In mid‑June 2025, India’s Union Petroleum and Natural Gas Minister, Hardeep Singh Puri, announced that India might be on the threshold of discovering a Guyana‑scale oil field in the Andaman Sea, with estimated reserves of around 184,440 crore litres (approximately 1.844 trillion litres) of crude oil. Should exploration confirm commercial viability, Puri suggested this find could elevate India to a $20 trillion economy—a bold leap from its current size of approximately $3.7 trillion.
Economic Leverage: What a Discovery Could Unlock
A discovery of this magnitude has several transformative implications:
Energy Independence: India imports roughly 90% of its oil and about 50% of its natural gas, a dependency that strains foreign exchange reserves. Indigenous production from Andaman could significantly reduce this reliance.
Boost to GDP Growth: At face value, such reserves could be seen as a catalyst for exponential GDP growth—hence the “$20 trillion economy” projection. However, this estimate is largely speculative, hinging on assumptions around extraction timelines, global oil demand, reinvestment, and economic multipliers.
Fiscal and Credit Gains: Lowering oil import bills may free up fiscal resources, strengthen the current account, and improve sovereign credit metrics.
Strategic Fit in India’s Energy Transition Strategy
India’s broader energy goals are shifting:
Deepwater Exploration Initiative: As recently as August 2025, Prime Minister Modi highlighted a policy push towards deep‑sea oil exploration and nuclear expansion to reduce dependence on imports and enhance energy security.
Diversification: Even if oil demand plateaus or declines—as argued by experts due to the global shift to renewables—the discovery still represents strategic insurance during the transition period.
Strategic Geography and Infrastructure Implications
Geopolitical Leverage: The Andaman Sea and the adjoining Andaman and Nicobar Islands control key shipping lanes such as the Ten Degree Channel, which connects to the Malacca and Singapore Straits—a major chokepoint through which global trade passes.
Infrastructure Synergy: The ongoing Great Nicobar Island Development Project, with plans for ports, airports, and power infrastructure, could complement energy ambitions by improving access and logistics in the region.
Challenges and Caveats
A host of practical and theoretical hurdles remain:
Exploration Costs & Viability: Deep‑sea drilling is capital‑intensive, with execution risks and regulatory complexities.
Market Uncertainty: Long‑term oil demand may taper as renewables gain traction. The economic upside depends on effective commercialization and resource reinvestment.
Environmental Sensitivities: The Andaman region harbours rich marine ecosystems and tribal communities. Infrastructure expansion may generate ecological and social pushback (echoed in debates around the Great Nicobar development).
Infrastructure Readiness: Transport, refining capacity, export pipelines, and port facilities will need substantial enhancement to process and deliver oil to markets efficiently.
Strategic Outlook and Policy Imperatives
For India to translate this potential oil bounty into sustainable growth:
Rigorous Verification: Prioritize economic feasibility studies, environmental impact assessments, and phased exploration.
Balanced Energy Policy: Use revenues to fund renewables, reduce carbon footprint, and build resilience—rather than doubling down solely on hydrocarbons.
Infrastructure Investment: Expand refining capability, logistics, and export terminals in an eco-sensitive, inclusive manner.
Regional Development: Harness this momentum to boost local economies—creating jobs, improving connectivity, and uplifting communities in the Andaman and Nicobar region.
Geostrategic Positioning: Take advantage of Andaman’s location to secure sea lanes and enhance India’s Indo-Pacific posture.
While headlines envisioning a fivefold GDP surge remain speculative, the preliminary discovery in the Andaman Sea represents a promising and strategically significant opportunity. If proven commercially viable and paired with thoughtful policy, infrastructure, and environmental stewardship, it could be a cornerstone in India’s quest for energy independence and economic transformation. But prudent, phased, and balanced planning will be essential to realize this potential responsibly.
------------------------------------------------------------------------
The article and the data is for general information use only, not advice!
Risk Disclaimer!
General Risk Warning: Trading on the Financial Markets, Stock Exchange and all its asset derivatives is highly speculative and may not be suitable for all investors. Only invest with money you can afford to lose and ensure that you fully understand the risks involved. It is important that you understand how Trading and Investing on the stock exchange works and that you consider whether you can afford the high risk of loss.

NATGAS Swing Short! Sell!
Hello,Traders!
NATGAS made a bearish
Breakout of the key horizontal
Level of 2.895$ while trading
In a downtrend so we are
Bearish biased and we will
Be expecting a further
Bearish continuation
Sell!
Comment and subscribe to help us grow!
Check out other forecasts below too!
Disclosure: I am part of Trade Nation's Influencer program and receive a monthly fee for using their TradingView charts in my analysis.

NATGAS BEARISH BREAKOUT|SHORT|
✅NATGAS is going down currently
As the price broke the key structure level of 2.90$
Which is now a resistance, and after the pullback
And retest, I think the price will go further down
SHORT🔥
✅Like and subscribe to never miss a new idea!✅

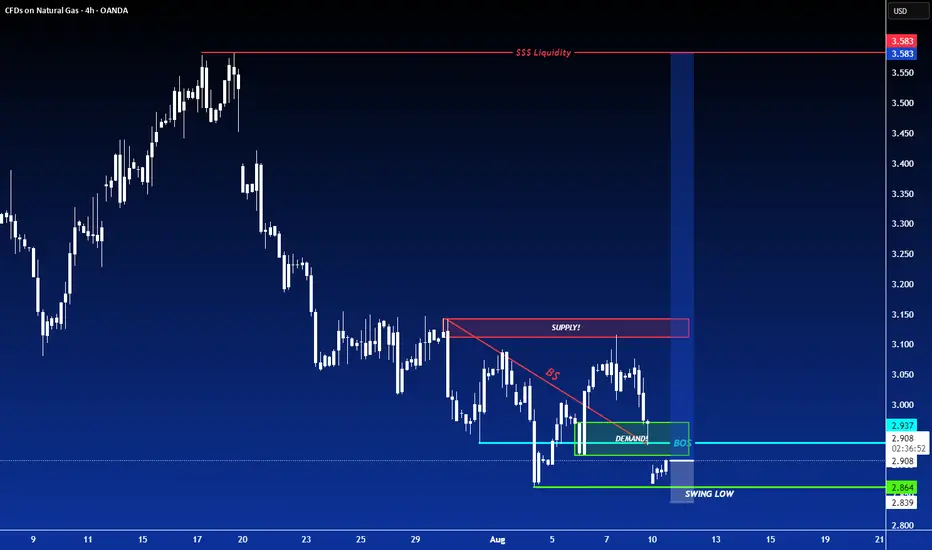
LONG ON NATURAL GASNatural gas has given us a nice CHOC (change of character) to the upside to start a upward move from a major demand zone.
I will be buying natural gas to the next level of supply.
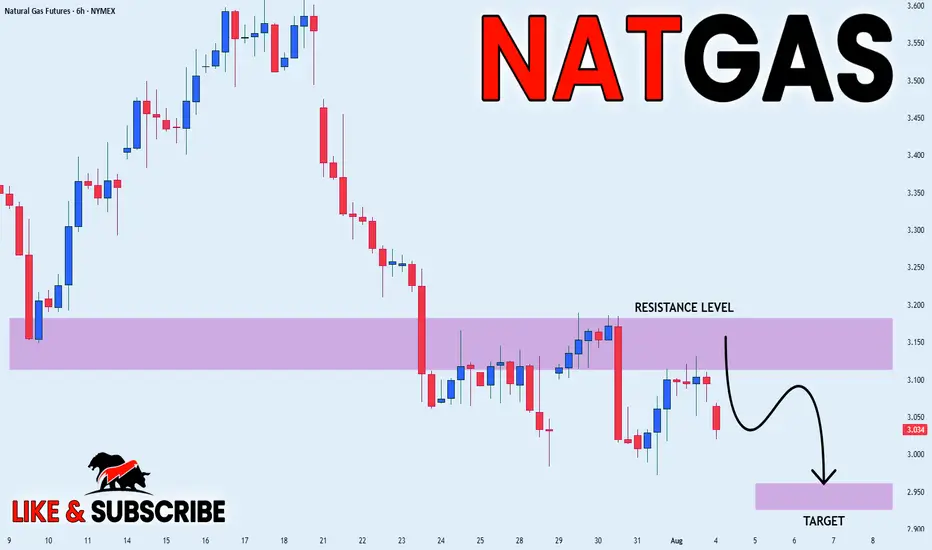
NATGAS WILL FALL|SHORT|
✅NATGAS made a retest of the
Strong horizontal resistance level of 3.150$
And as you can see the price is already
Making a local pullback from
The level which sends a clear
Bearish signal to us therefore
We will be expecting a
Further bearish correction
SHORT🔥
✅Like and subscribe to never miss a new idea!✅

$GAS is showing strong long-term accumulation — a major move migHOSE:GAS is showing strong long-term accumulation — a major move might be loading.

NATGAS Risky Long! Buy!
Hello,Traders!
NATGAS keeps falling down
In a strong downtrend
And Gas is locally oversold
So after the price hits the
Horizontal support of 2.860$
We will be expecting a
Local bullish correction
Buy!
Comment and subscribe to help us grow!
Check out other forecasts below too!
Disclosure: I am part of Trade Nation's Influencer program and receive a monthly fee for using their TradingView charts in my analysis.

NATGAS WILL FALL|SHORT|
✅NATGAS has retested a key resistance level of
And as the pair is already making a bearish pullback
A move down to retest the demand level below at 1.3434 is likely
SHORT🔥
✅Like and subscribe to never miss a new idea!✅
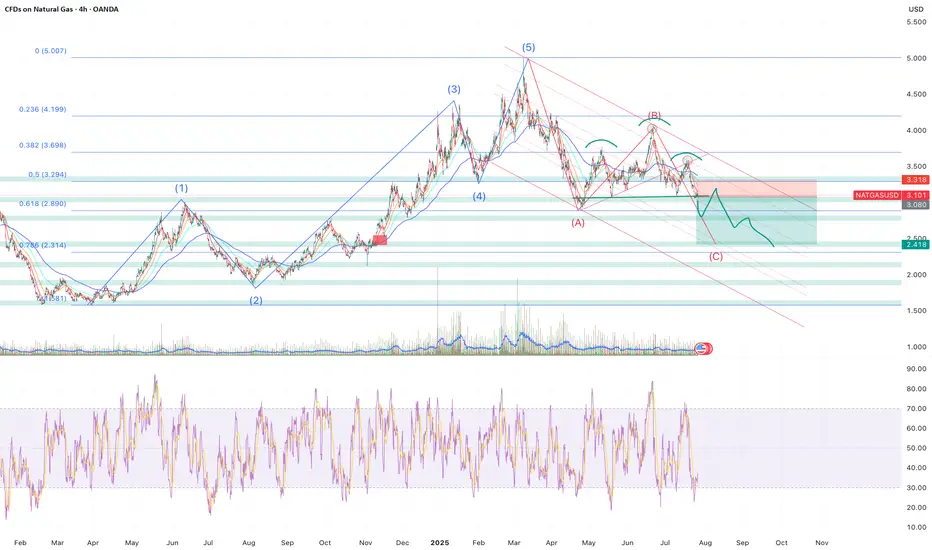
Sell NATGAS into OCT/NOVNatalie has fromed a H&S and has broke through all of the supporting EMAs leading to most of the indicators turning bearish.
My approach for the forseeable is seeling bounces until the winter season approaches.
Of course Natalie is extremely susceptible to trend changes due to economical data and has to be monitored closely. Currenlty I'm a bear.
Only selling once it breaks and retests, where I will once again reasses based on economics such as storage, production, imports and demand.
Target around $2.5 where interestingly a gap (red rectangle) sits from Nov - 24.
Elliot Wave (although not a great fan) kind of aligns as well as the 0.786 fib level which began forming at the beginning of 2024.
Storage | Volatility | Price Outlook
U.S. natural gas markets are stabilizing as volatility trends back toward seasonal norms.
📉 Volatility has dropped from 81% in Q4 2024 to 69% in mid-2025
🏪 Storage is currently at 3,075 Bcf,
🔻 4.7% lower YoY
🔺 5.9% higher than the 5-year average
🚢 LNG exports remain strong—up 22% YoY and 74% above the 5-year average
🔌 Domestic demand is seasonally weaker but steady
➡️ Despite being below last year’s levels, storage surplus vs. the 5-year average acts as a soft ceiling on price.
➡️ Historical analogs suggest a fair value range between $2.50–$3.20/MMBtu in the short term.
📊 Current price action around $3.00–$3.40 looks slightly overheated unless a fresh catalyst emerges (heatwave, export spike, etc.).
🧭 Watching for:
Injection trends over the next few weeks
Cooling demand in power sector
Resistance around $3.40
Support near $2.80
NATGAS Free Signal! Buy!
Hello,Traders!
NATGAS went down and
Almost reached the horizontal
Support of 3.014$ from where
We can enter a long trade
With the Take Profit of 3.066$
And the Stop Loss of 2.981$
Buy!
Comment and subscribe to help us grow!
Check out other forecasts below too!
Disclosure: I am part of Trade Nation's Influencer program and receive a monthly fee for using their TradingView charts in my analysis.

Crude Oil Spikes - Russia / Ukraine / USA sanction? Concerns about the possibility of tighter global oil supplies are supporting crude prices after President Trump warned of "secondary sanctions" if Russia fails to reach a ceasefire in Ukraine within 10 to 12 days.
These sanctions have absolutely burned the shorts in oil and can cause a 3 bar surge on the daily chart if crude breaks this channel.
Keep you eye on the daily 200 MA...if it holds above we should push higher on crude.
FOMC RATE DECISION TOMORROW - Tune into our live stream.

NATGAS BEARISH BREAKOUT|SHORT|
✅NATGAS broke the rising support
While trading in an local downtrend
Which makes me bearish
And I think that after the retest of the broken line is complete
A rebound and bearish continuation will follow
SHORT🔥
✅Like and subscribe to never miss a new idea!✅
Disclosure: I am part of Trade Nation's Influencer program and receive a monthly fee for using their TradingView charts in my analysis.
NATGAS Support Ahead! Buy!
Hello,Traders!
NATGAS keeps falling but
A strong horizontal support
Level is ahead at 3.00$ so
After Gas retests the support
We will be expecting a local
Bullish rebound
Buy!
Comment and subscribe to help us grow!
Check out other forecasts below too!
Disclosure: I am part of Trade Nation's Influencer program and receive a monthly fee for using their TradingView charts in my analysis.

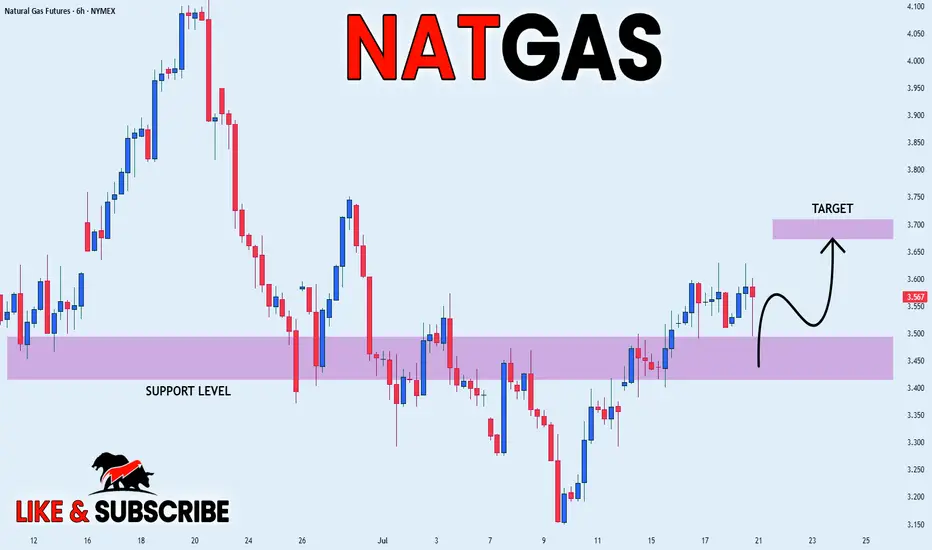
NATGAS REBOUND AHEAD|LONG|
✅NATGAS is going up now
And the price made a bullish
Rebound from the horizontal
Support level around 3.50$
So we are bullish biased and
We will be expecting a
Further bullish move up
LONG🚀
✅Like and subscribe to never miss a new idea!✅
Disclosure: I am part of Trade Nation's Influencer program and receive a monthly fee for using their TradingView charts in my analysis.
GAS - Huge Risk:Reward Trade 1:10 - Is there any Gas Left ?- Gas has finally managed to breakout from the resistance trendline and now trading just above the resistance
- I'm expecting this trend to continue along the support line shown in the chart.
Entry Price: 3.281
Stop Loss: 2.271
TP1: 3.944
TP2: 4.589
TP3: 6.775
TP4: 8.412
TP5: 13.512
Max Leverage 5x.
Don't forget to keep stoploss.
Support us by Liking and following.
Thanks and Cheers!
GreenCrypto
XNGUSD POSSIBLE LONG OPPORTUNITY
Us natural gas has been falling since June 20th and stopped a decline nearby the 3.3900 level with minor false breakouts of it. Currently we observe the reversal bullish wedge pattern, which is supported by a divergency on rsi on 4-h timeframe. Yesterday natural gas trading session opened with a gap downside, however, later, closer to the American session we observed buying volumes and the asset managed to hold above the 3.3900, which makes it interesting to go long.
If the price breaks above the MA50 at 3.4824, would be nice to set a
🔼buy stop order at 3.5144 with a
💰take profit at 3.8000 and a
❌stop loss at 3.2494, below the trendline.
The risk-reward ratio is 1:1.08.

NATGAS Support Ahead! Buy!
Hello,Traders!
NATGAS keeps falling but
The price will soon hit a
Horizontal support of 2.90$
From where we will be expecting
A local bullish rebound
Buy!
Comment and subscribe to help us grow!
Check out other forecasts below too!
Disclosure: I am part of Trade Nation's Influencer program and receive a monthly fee for using their TradingView charts in my analysis.
