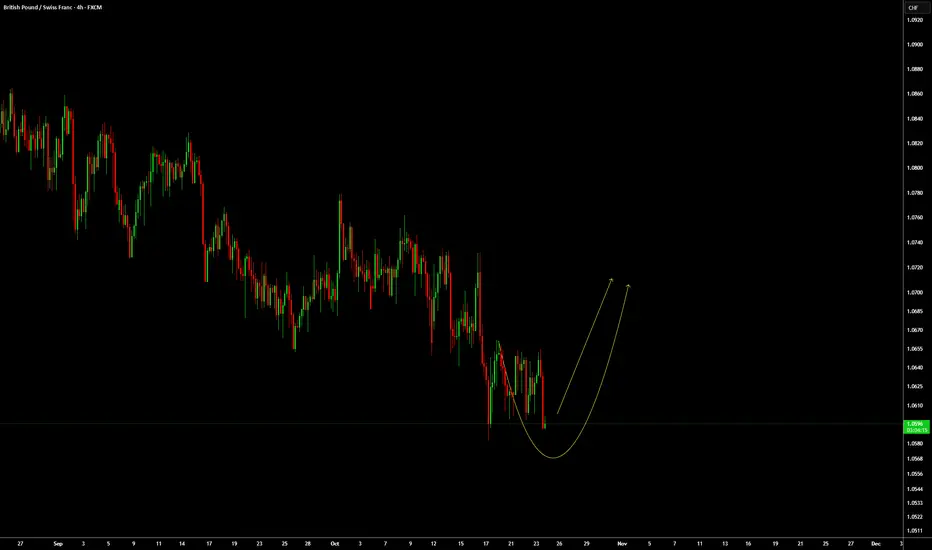
GBPCHF: Even if it breaks the low, we should get a move up.
FX:GBPCHF is at a reaction level. Even if it breaks the low we are expecting it to push up.
Always remember WTW 4 Golder Rules:
1) Do not jump in
2) Do not over risk/trade
3) Do not trade without Stop Loss
4) Never ever add to a losing position!
Trade with care
We Trade Waves
WTW Team
Disclosure: We are part of Trade Nation's Influencer program and receive a monthly fee for using their TradingView charts in our analysis.
GBP
Bearish drop off?GBP/USD has rejected off the resistance level which is a pullback resistance that aligns with the 38.2% Fibonacci retracement and could drop from this level to our take profit.
Entry: 1.3363
Why we like it:
There is a pullback resistance that aligns with the 38.2% Fibonacci retracement.
Stop loss: 1.3438
Why we like it:
There is a pullback resistance level that aligns with the 78.6% Fibonacci retracement.
Take profit: 1.3260
Why we like it:
There is a multi-swing low support level that aligns with the 161.8% Fibonacci extension.
Enjoying your TradingView experience? Review us!
Please be advised that the information presented on TradingView is provided to Vantage (‘Vantage Global Limited’, ‘we’) by a third-party provider (‘Everest Fortune Group’). Please be reminded that you are solely responsible for the trading decisions on your account. There is a very high degree of risk involved in trading. Any information and/or content is intended entirely for research, educational and informational purposes only and does not constitute investment or consultation advice or investment strategy. The information is not tailored to the investment needs of any specific person and therefore does not involve a consideration of any of the investment objectives, financial situation or needs of any viewer that may receive it. Kindly also note that past performance is not a reliable indicator of future results. Actual results may differ materially from those anticipated in forward-looking or past performance statements. We assume no liability as to the accuracy or completeness of any of the information and/or content provided herein and the Company cannot be held responsible for any omission, mistake nor for any loss or damage including without limitation to any loss of profit which may arise from reliance on any information supplied by Everest Fortune Group.

GBPUSD Channel Down targeting at least 1.3250The GBPUSD pair has been trading within a 1-month Channel Down pattern since the September 23 rejection on its 4H MA200 (orange trend-line). In fact, we are currently on the third Bearish Leg of this pattern, all of which have been initiated by 4H MA200 rejections.
We expect the price to target at least 1.3250, where it might technically rebound due to the presence of the 1D MA200 (red trend-line). If it breaks though, we can see a -2.07% standard Bearish Leg extension to 1.32000, which would make a perfect technical Lower Low at the bottom of the Channel Down.
-------------------------------------------------------------------------------
** Please LIKE 👍, FOLLOW ✅, SHARE 🙌 and COMMENT ✍ if you enjoy this idea! Also share your ideas and charts in the comments section below! This is best way to keep it relevant, support us, keep the content here free and allow the idea to reach as many people as possible. **
-------------------------------------------------------------------------------
💸💸💸💸💸💸
👇 👇 👇 👇 👇 👇

Bullish bounce for the Cable?The price is falling towards the pivot which is a pullback support that aligns with the 50% Fibonacci retracement and could bounce to the 1st resistance, which acts as an overlap resistance.
Pivot: 1.3344
1st Support: 1.3310
1st Resistance: 1.3393
Disclaimer:
The above opinions given constitute general market commentary, and do not constitute the opinion or advice of IC Markets or any form of personal or investment advice.
Any opinions, news, research, analyses, prices, other information, or links to third-party sites contained on this website are provided on an "as-is" basis, are intended only to be informative, is not an advice nor a recommendation, nor research, or a record of our trading prices, or an offer of, or solicitation for a transaction in any financial instrument and thus should not be treated as such. The information provided does not involve any specific investment objectives, financial situation and needs of any specific person who may receive it. Please be aware, that past performance is not a reliable indicator of future performance and/or results. Past Performance or Forward-looking scenarios based upon the reasonable beliefs of the third-party provider are not a guarantee of future performance. Actual results may differ materially from those anticipated in forward-looking or past performance statements. IC Markets makes no representation or warranty and assumes no liability as to the accuracy or completeness of the information provided, nor any loss arising from any investment based on a recommendation, forecast or any information supplied by any third-party.

GBP sinks as “Santa cut” possibility grow Sterling is under pressure after the UK’s September inflation data came in softer than expected. Annual inflation held steady at 3.8%, below forecasts of 4%, strengthening expectations that the Bank of England could deliver a “Santa cut” in December. Markets are now pricing a 72% chance of a rate reduction before year-end.
The weaker inflation print triggered a classic market reaction, with GBP/USD falling below its 200-hour moving average, its lowest level in a week, as sellers gain control and shift sentiment to a more neutral-to-bearish bias.
Immediate support potentially lies near 1.33055, followed by the key level at 1.32484. Sterling bulls, meanwhile, might have trouble justifying an attempt at the daily moving average that capped the pairs late October rally.

GBPJPY H1 | Falling Toward the 61.8% Fibonacci SupportBased on the H1 chart analysis, we could see the price fall towards the buy entry, which is a pullback support that aligns with the 61.8% Fibonacci retracement and could bounce from this level to the upside.
Buy entry is at 201.63, which is a pullback support that lines up with the 61.8% Fibonacci retracement.
Stop loss is at 201.08, which is a swing low support.
Take profit is at 202.80, whichis a pullback resistance.
Stratos Markets Limited (tradu.com ):
CFDs are complex instruments and come with a high risk of losing money rapidly due to leverage. 68% of retail investor accounts lose money when trading CFDs with this provider. You should consider whether you understand how CFDs work and whether you can afford to take the high risk of losing your money.
Stratos Europe Ltd (tradu.com ):
CFDs are complex instruments and come with a high risk of losing money rapidly due to leverage. 70% of retail investor accounts lose money when trading CFDs with this provider. You should consider whether you understand how CFDs work and whether you can afford to take the high risk of losing your money.

Bearish drop?GBP/CAD has reacted off the pivot which acts as a pullback resistance and could drop to the major support.
Pivot: 1.8748
1st Support: 1.8549
1st Resistance: 1.8892
Disclaimer:
The above opinions given constitute general market commentary, and do not constitute the opinion or advice of IC Markets or any form of personal or investment advice.
Any opinions, news, research, analyses, prices, other information, or links to third-party sites contained on this website are provided on an "as-is" basis, are intended only to be informative, is not an advice nor a recommendation, nor research, or a record of our trading prices, or an offer of, or solicitation for a transaction in any financial instrument and thus should not be treated as such. The information provided does not involve any specific investment objectives, financial situation and needs of any specific person who may receive it. Please be aware, that past performance is not a reliable indicator of future performance and/or results. Past Performance or Forward-looking scenarios based upon the reasonable beliefs of the third-party provider are not a guarantee of future performance. Actual results may differ materially from those anticipated in forward-looking or past performance statements. IC Markets makes no representation or warranty and assumes no liability as to the accuracy or completeness of the information provided, nor any loss arising from any investment based on a recommendation, forecast or any information supplied by any third-party.

GBP/USD – Sell Entry (H1 – Channel Pattern)
The GBP/USD Pair, Price has been trading within a Channel Pattern on the H1 chart, forming consistent lower highs and lower lows. Price action is now testing the lower boundary of the pattern, signalling a possible breakdown.
✅Market Context:
1️⃣Downward structure building inside the pattern.
2️⃣Sellers are showing strength near support levels.
3️⃣Breakdown below the trendline indicates momentum continuation toward lower zones.
✅Trade Plan:
Entry: Sell after confirmed breakdown below the support (Candle close below trendline or retest of the breakout).
💰Take Profit (TP): At the Key Zone – major support area identified ahead.
🛑Stop Loss (SL): Above the pattern structure / recent swing high.
✅Psychological Discipline:
1️⃣Stick to plan – No Revenge Trades.
2️⃣Accept losing trades as part of the strategy.
3️⃣Risk only 1–2% of your account balance per trade.
💬 Support the community: If you found this useful, drop a 👍 like and share your thoughts in the comments!
⚠️ Disclaimer: This analysis is for educational purposes only and does not constitute financial advice. Forex trading involves high risk. Trade only with capital you can afford to lose and always do your own research.

eurgbp looking bullish over all trend is up and now breaking bullish pennant consolidation towards upside, successful breakout can lead 120 pips bullish wave, keep in mind that we need breakout, without breakout there is no entry

GBP/USD - Fundamental Drive Ahead! (21.10.2025)🧠 Setup Overview:
GBP/USD has broken below its rising trendline after testing the 1.3470 resistance zone multiple times. The pair is under fundamental selling pressure, fueled by risk aversion and renewed U.S. dollar strength.
Fundamental Drivers:
1️⃣ U.S. markets gained as President Trump decided not to impose very high tariffs on Chinese goods, which temporarily boosted sentiment.
2️⃣ However, investors are now digesting U.S. credit risks and US–China trade tensions, both adding safe-haven demand to the USD.
3️⃣ Meanwhile, the UK economy faces uncertainty from softer consumer spending and weak housing data — further limiting GBP’s upside potential.
📉 Technical Plan:
Bias: Bearish below 1.3400
Structure: Trendline breakdown confirmed
Cloud Resistance: Adds confluence to downside momentum
Next Levels to Watch:
🟥 1st Support: 1.3349
🟥 2nd Support: 1.3310
📊 If price closes below 1.3349 on the 30-min chart, further selling pressure may extend toward 1.3310 and possibly deeper if fundamentals align.
#GBPUSD #Forex #TechnicalAnalysis #PriceAction #Ichimoku #TrendlineBreak #FXMarket #BearishSetup #TradingView #KABHI_TA_TRADING
⚠️ Disclaimer:
This analysis is for educational purposes only — not financial advice. Always manage your risk and use proper position sizing before entering any trade.
📣 Support My Work
If you found this analysis useful — LIKE 👍, COMMENT 💬, and FOLLOW 🔔 to stay updated with daily Forex setups!

GBP/NZD - Wedge Breakdown (20.10.2025)📊 Setup Overview:
GBP/NZD has formed a Rising Wedge Pattern on the 30-min chart, signaling a potential trend reversal from the recent bullish structure. The pair has also completed a Cloud Cross, indicating early bearish momentum as price begins to break below the wedge support line. OANDA:GBPNZD
📈 Trade Plan: Bias: Bearish
Sell Entry Zone: Below 2.3400 (after candle close confirmation)
1st Target: 2.3288 ✅
2nd Target: 2.3277 🎯
Resistance Zone: 2.3479 – 2.3523
🧩 Technical Highlights:
1.Rising Wedge pattern breakdown – early bearish signal
2.Ichimoku Cloud Cross confirms downside pressure
3.Volume profile thinning below 2.34, showing potential liquidity vacuum
4.Clean bearish structure with clear risk–reward setup
#GBPNZD #ForexAnalysis #WedgePattern #BearishBreakout #Ichimoku #PriceAction #TechnicalAnalysis #ChartSetup #SwingTrade #TradingView #FXMarket #Kabhi_TA_Trading #ChartsDontLie #TradersDontQuit #ForexSignals
⚠️ Disclaimer:
This analysis is for educational purposes only and not financial advice.
Always confirm setups with your own analysis and manage risk properly before entering any trade.
💬 Support This Analysis:
If this setup helped your trading view — LIKE 👍, COMMENT 💬 your thoughts, and FOLLOW ✅ for more daily forex setups and chart breakdowns from Kabhi_TA_Trading!

GBPUSD H1 | Bearish Continuation SetupCable (GBP/USD) has rejected off the sell entry which is a pullback resistance and could potentially drop from this level to the downside.
Sell entry is at 1.3390, which is a pullback resistance.
Stop loss is at 1.3439, whichis a pullback resistance.
Take profit is at 1.3327, which is an overlap support that is slightly below the 61.8% Fibonacci retracement.
High Risk Investment Warning
Trading Forex/CFDs on margin carries a high level of risk and may not be suitable for all investors. Leverage can work against you.
Stratos Markets Limited (tradu.com ):
CFDs are complex instruments and come with a high risk of losing money rapidly due to leverage. 65% of retail investor accounts lose money when trading CFDs with this provider. You should consider whether you understand how CFDs work and whether you can afford to take the high risk of losing your money.
Stratos Europe Ltd (tradu.com ):
CFDs are complex instruments and come with a high risk of losing money rapidly due to leverage. 66% of retail investor accounts lose money when trading CFDs with this provider. You should consider whether you understand how CFDs work and whether you can afford to take the high risk of losing your money.
Stratos Global LLC (tradu.com ):
Losses can exceed deposits.
Please be advised that the information presented on TradingView is provided to Tradu (‘Company’, ‘we’) by a third-party provider (‘TFA Global Pte Ltd’). Please be reminded that you are solely responsible for the trading decisions on your account. There is a very high degree of risk involved in trading. Any information and/or content is intended entirely for research, educational and informational purposes only and does not constitute investment or consultation advice or investment strategy. The information is not tailored to the investment needs of any specific person and therefore does not involve a consideration of any of the investment objectives, financial situation or needs of any viewer that may receive it. Kindly also note that past performance is not a reliable indicator of future results. Actual results may differ materially from those anticipated in forward-looking or past performance statements. We assume no liability as to the accuracy or completeness of any of the information and/or content provided herein and the Company cannot be held responsible for any omission, mistake nor for any loss or damage including without limitation to any loss of profit which may arise from reliance on any information supplied by TFA Global Pte Ltd.
The speaker(s) is neither an employee, agent nor representative of Tradu and is therefore acting independently. The opinions given are their own, constitute general market commentary, and do not constitute the opinion or advice of Tradu or any form of personal or investment advice. Tradu neither endorses nor guarantees offerings of third-party speakers, nor is Tradu responsible for the content, veracity or opinions of third-party speakers, presenters or participants.

GBPAUD to find buyers at current market price?GBPAUD - 24h expiry
Our short term bias remains positive.
50 4hour EMA is at 2.0572.
Offers ample risk/reward to buy at the market.
Our short term bias remains positive.
Prices have reacted from 2.0244.
We look to Buy at 2.0575 (stop at 2.0505)
Our profit targets will be 2.0784 and 2.0824
Resistance: 2.0665 / 2.0697 / 2.0785
Support: 2.0559 / 2.0459 / 2.0425
Risk Disclaimer
The trade ideas beyond this page are for informational purposes only and do not constitute investment advice or a solicitation to trade. This information is provided by Signal Centre, a third-party unaffiliated with OANDA, and is intended for general circulation only. OANDA does not guarantee the accuracy of this information and assumes no responsibilities for the information provided by the third party. The information does not take into account the specific investment objectives, financial situation, or particular needs of any particular person. You should take into account your specific investment objectives, financial situation, and particular needs before making a commitment to trade, including seeking, under a separate engagement, as you deem fit.
You accept that you assume all risks in independently viewing the contents and selecting a chosen strategy.
Where the research is distributed in Singapore to a person who is not an Accredited Investor, Expert Investor or an Institutional Investor, Oanda Asia Pacific Pte Ltd (“OAP“) accepts legal responsibility for the contents of the report to such persons only to the extent required by law. Singapore customers should contact OAP at 6579 8289 for matters arising from, or in connection with, the information/research distributed.

GBPUSD: Breakout and Potential RetraceHey Traders, in today's trading session we are monitoring GBPUSD for a buying opportunity around 1.33600 zone, GBPUSD was trading in a downtrend and successfully managed to break it out. Currently is in a correction phase in which it is approaching the retrace area at 1.33600 support and resistance zone.
Trade safe, Joe.

King Dollar Returns: 98.190 Break💵 Dollar Breakout — Cross Assets Dumping Hard
The U.S. Dollar just flipped 98.190 CAP
After weeks of hesitation, DXY broke clean through the 98.190 daily imbalance, turning prior resistance into a launchpad — and global markets are reacting fast.
📊 Technical Frame
The daily imbalance that capped price now acts as fresh support, confirming a higher-timeframe breakout.
Momentum alignment across 4H and Daily frames signals a firm trend shift.
Upside magnet sits at 98.800–99.200, the next liquidity shelf where sellers may regroup.
🌐 Fundamental Pulse
Cross assets are dumping — EUR AND GBP all bleeding as Dollar strength tightens global liquidity.
Yields grind higher with markets reloading for extended Fed tightness.
Risk aversion and portfolio deleveraging are amplifying the move — capital is flowing back into USD safety.
🧭 Takeaway
The Dollar is back in charge. Above 98.190, the structure supports continuation toward 99+.
In this regime, correlation flips: strong Dollar = weak everything else.
When the Dollar breathes in, global markets exhale.

GBP/CAD Looks Set To Mean RevertA two-bar bearish reversal pattern (dark cloud cover) has formed around the monthly D1 pivot, suggesting that momentum could temporarily shift lower. Bears may look to fade retracements within the reversal zone and maintain a short-term bearish bias while prices remain below last week’s high.
The 20-day EMA, 50-day EMA, and monthly pivot point could serve as downside targets for bears — or potential swing-low zones for bulls to monitor.
A break below 1.8550 would signal a deeper correction or potentially a trend reversal in progress.
Matt Simpson, Market Analyst at City Index and Forex.com

GBPJPY Eyes 202.900 Resistance as Correction Meets Downtrend!Hey Traders, in tomorrow’s trading session we are monitoring GBPJPY for a potential selling opportunity around the 202.900 zone. The pair remains within a broader downtrend and is currently in a corrective phase, approaching a key resistance area near 202.900 that aligns with the descending trend structure.
Structure:
Price has been forming lower highs and lower lows, maintaining bearish momentum. The current retracement toward 202.900 could provide an attractive area for sellers to re-enter the market in line with the dominant trend.
Key level in focus:
202.900 — a strong resistance confluence area, combining structural and technical significance.
Fundamentals:
Ongoing concerns over global risk sentiment and the potential for renewed JPY strength amid rising geopolitical tensions could further support downside pressure on GBPJPY.
Next move:
Monitoring price action closely around 202.900 — a rejection or bearish confirmation at this level could trigger the next leg lower within the prevailing downtrend.
Trade safe,
Joe.

GBPJPY H1 | Bullish Bounce Off Pullback SupportBased on the h1 chart analysis, we could see the price fall to the buy entry which is a pullback support that is slightly below the 61.8% Fibonacci retracement and could bounce from this level to the take profit.
Buy entry is at 201.44, which is a pullback support that is slightly below the 61.8% Fibonacci retracement.
Stop loss is at 200.67, which is a swing low support.
Take profit is at 202.79, which is a pullback resistance.
High Risk Investment Warning
Trading Forex/CFDs on margin carries a high level of risk and may not be suitable for all investors. Leverage can work against you.
Stratos Markets Limited (tradu.com ):
CFDs are complex instruments and come with a high risk of losing money rapidly due to leverage. 65% of retail investor accounts lose money when trading CFDs with this provider. You should consider whether you understand how CFDs work and whether you can afford to take the high risk of losing your money.
Stratos Europe Ltd (tradu.com ):
CFDs are complex instruments and come with a high risk of losing money rapidly due to leverage. 66% of retail investor accounts lose money when trading CFDs with this provider. You should consider whether you understand how CFDs work and whether you can afford to take the high risk of losing your money.
Stratos Global LLC (tradu.com ):
Losses can exceed deposits.
Please be advised that the information presented on TradingView is provided to Tradu (‘Company’, ‘we’) by a third-party provider (‘TFA Global Pte Ltd’). Please be reminded that you are solely responsible for the trading decisions on your account. There is a very high degree of risk involved in trading. Any information and/or content is intended entirely for research, educational and informational purposes only and does not constitute investment or consultation advice or investment strategy. The information is not tailored to the investment needs of any specific person and therefore does not involve a consideration of any of the investment objectives, financial situation or needs of any viewer that may receive it. Kindly also note that past performance is not a reliable indicator of future results. Actual results may differ materially from those anticipated in forward-looking or past performance statements. We assume no liability as to the accuracy or completeness of any of the information and/or content provided herein and the Company cannot be held responsible for any omission, mistake nor for any loss or damage including without limitation to any loss of profit which may arise from reliance on any information supplied by TFA Global Pte Ltd.
The speaker(s) is neither an employee, agent nor representative of Tradu and is therefore acting independently. The opinions given are their own, constitute general market commentary, and do not constitute the opinion or advice of Tradu or any form of personal or investment advice. Tradu neither endorses nor guarantees offerings of third-party speakers, nor is Tradu responsible for the content, veracity or opinions of third-party speakers, presenters or participants.

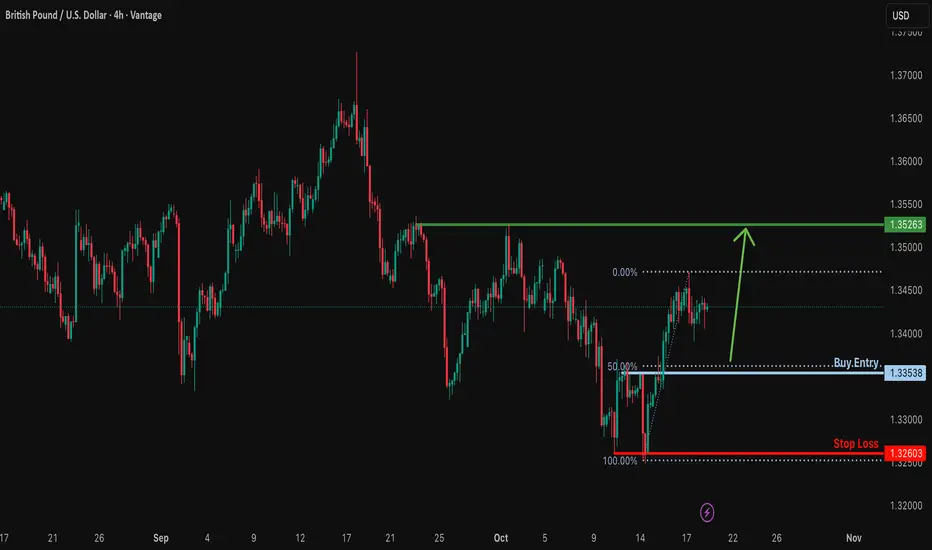
Falling towards 50% Fibonacci support?GBP/USD is fallig towards the support level which is a pullback support that aligns with the 50% Fibonacci retracement and could bounce from this level to our take profit.
Entry: 1.3353
Why we like it:
There is a pullback support that lines up with the 50% Fibonacci retracement.
Stop loss: 1.3260
Why we like it:
There is a multi swing low support.
Take profit: 1.3526
Why we like it:
There is a multi swing high resistance level.
Enjoying your TradingView experience? Review us!
Please be advised that the information presented on TradingView is provided to Vantage (‘Vantage Global Limited’, ‘we’) by a third-party provider (‘Everest Fortune Group’). Please be reminded that you are solely responsible for the trading decisions on your account. There is a very high degree of risk involved in trading. Any information and/or content is intended entirely for research, educational and informational purposes only and does not constitute investment or consultation advice or investment strategy. The information is not tailored to the investment needs of any specific person and therefore does not involve a consideration of any of the investment objectives, financial situation or needs of any viewer that may receive it. Kindly also note that past performance is not a reliable indicator of future results. Actual results may differ materially from those anticipated in forward-looking or past performance statements. We assume no liability as to the accuracy or completeness of any of the information and/or content provided herein and the Company cannot be held responsible for any omission, mistake nor for any loss or damage including without limitation to any loss of profit which may arise from reliance on any information supplied by Everest Fortune Group.
GBPUSD H4 | Falling Towards Pullback SupportGBP/USD is falling towards the buy entry which is a pullback support that aligns with the 50% Fibonacci retracement and the 100% Fibonacci projection and could bounce from this level to the upside.
Buy entry is at 1.3361, which is a pullback support that aligns with the 50% Fibonacci retracement and the 100% Fibonacci projection.
Stop loss is at 1.3274, which is a pullback support.
Take profit is at 1.3533, which is an overlap resistance that aligns with the 61.8% Fibonacci retracement.
High Risk Investment Warning
Trading Forex/CFDs on margin carries a high level of risk and may not be suitable for all investors. Leverage can work against you.
Stratos Markets Limited (tradu.com ):
CFDs are complex instruments and come with a high risk of losing money rapidly due to leverage. 65% of retail investor accounts lose money when trading CFDs with this provider. You should consider whether you understand how CFDs work and whether you can afford to take the high risk of losing your money.
Stratos Europe Ltd (tradu.com ):
CFDs are complex instruments and come with a high risk of losing money rapidly due to leverage. 66% of retail investor accounts lose money when trading CFDs with this provider. You should consider whether you understand how CFDs work and whether you can afford to take the high risk of losing your money.
Stratos Global LLC (tradu.com ):
Losses can exceed deposits.
Please be advised that the information presented on TradingView is provided to Tradu (‘Company’, ‘we’) by a third-party provider (‘TFA Global Pte Ltd’). Please be reminded that you are solely responsible for the trading decisions on your account. There is a very high degree of risk involved in trading. Any information and/or content is intended entirely for research, educational and informational purposes only and does not constitute investment or consultation advice or investment strategy. The information is not tailored to the investment needs of any specific person and therefore does not involve a consideration of any of the investment objectives, financial situation or needs of any viewer that may receive it. Kindly also note that past performance is not a reliable indicator of future results. Actual results may differ materially from those anticipated in forward-looking or past performance statements. We assume no liability as to the accuracy or completeness of any of the information and/or content provided herein and the Company cannot be held responsible for any omission, mistake nor for any loss or damage including without limitation to any loss of profit which may arise from reliance on any information supplied by TFA Global Pte Ltd.
The speaker(s) is neither an employee, agent nor representative of Tradu and is therefore acting independently. The opinions given are their own, constitute general market commentary, and do not constitute the opinion or advice of Tradu or any form of personal or investment advice. Tradu neither endorses nor guarantees offerings of third-party speakers, nor is Tradu responsible for the content, veracity or opinions of third-party speakers, presenters or participants.

Bearish reversal?The Cable (GBP/USD) is rising towards the pivot which is a pullback resistance that aligns with the 61.8% Fibonacci retracement and could reverse to the 1st support.
Pivot: 1.3523
1st Support: 1.3036
1st Resistance: 1.3740
Disclaimer:
The above opinions given constitute general market commentary, and do not constitute the opinion or advice of IC Markets or any form of personal or investment advice.
Any opinions, news, research, analyses, prices, other information, or links to third-party sites contained on this website are provided on an "as-is" basis, are intended only to be informative, is not an advice nor a recommendation, nor research, or a record of our trading prices, or an offer of, or solicitation for a transaction in any financial instrument and thus should not be treated as such. The information provided does not involve any specific investment objectives, financial situation and needs of any specific person who may receive it. Please be aware, that past performance is not a reliable indicator of future performance and/or results. Past Performance or Forward-looking scenarios based upon the reasonable beliefs of the third-party provider are not a guarantee of future performance. Actual results may differ materially from those anticipated in forward-looking or past performance statements. IC Markets makes no representation or warranty and assumes no liability as to the accuracy or completeness of the information provided, nor any loss arising from any investment based on a recommendation, forecast or any information supplied by any third-party.

WILL GBPUSD CORRECTION ENDS WITH SIMPLE WXY OR WXYXZ?Cable is undergoing a weekly having successfully break above the 1.34342 resistance now turned support level to extend its impulse trend. Will the pair's trend continue after a simple wxy correction, or a more complex wxyxz or even breakdown?
N.B!
- GBPUSD price might not follow the drawn lines . Actual price movements may likely differ from the forecast.
- Let emotions and sentiments work for you
- ALWAYS Use Proper Risk Management In Your Trades
#gbpusd
#cable

GBPJPY H1 | Heading Into 50% Fibonacci ResistanceGBP?JPY is rising towards the sell entry, which is a pullback resistance that aligns with the 50% Fibonacci retracement and could reverse from this level to the take profit.
Sell entry is at 202.58, which is a pullback resistance that aligns with the 50% Fibonacci retracement.
Stop loss is at 203.42, which is a multi-swing high resistance.
Take profit is at 201.43, which is a swing low support.
High Risk Investment Warning
Trading Forex/CFDs on margin carries a high level of risk and may not be suitable for all investors. Leverage can work against you.
Stratos Markets Limited (tradu.com ):
CFDs are complex instruments and come with a high risk of losing money rapidly due to leverage. 65% of retail investor accounts lose money when trading CFDs with this provider. You should consider whether you understand how CFDs work and whether you can afford to take the high risk of losing your money.
Stratos Europe Ltd (tradu.com ):
CFDs are complex instruments and come with a high risk of losing money rapidly due to leverage. 66% of retail investor accounts lose money when trading CFDs with this provider. You should consider whether you understand how CFDs work and whether you can afford to take the high risk of losing your money.
Stratos Global LLC (tradu.com ):
Losses can exceed deposits.
Please be advised that the information presented on TradingView is provided to Tradu (‘Company’, ‘we’) by a third-party provider (‘TFA Global Pte Ltd’). Please be reminded that you are solely responsible for the trading decisions on your account. There is a very high degree of risk involved in trading. Any information and/or content is intended entirely for research, educational and informational purposes only and does not constitute investment or consultation advice or investment strategy. The information is not tailored to the investment needs of any specific person and therefore does not involve a consideration of any of the investment objectives, financial situation or needs of any viewer that may receive it. Kindly also note that past performance is not a reliable indicator of future results. Actual results may differ materially from those anticipated in forward-looking or past performance statements. We assume no liability as to the accuracy or completeness of any of the information and/or content provided herein and the Company cannot be held responsible for any omission, mistake nor for any loss or damage including without limitation to any loss of profit which may arise from reliance on any information supplied by TFA Global Pte Ltd.
The speaker(s) is neither an employee, agent nor representative of Tradu and is therefore acting independently. The opinions given are their own, constitute general market commentary, and do not constitute the opinion or advice of Tradu or any form of personal or investment advice. Tradu neither endorses nor guarantees offerings of third-party speakers, nor is Tradu responsible for the content, veracity or opinions of third-party speakers, presenters or participants.
