GBPCAD support retestThe GBPCAD remains in a bullish trend, with recent price action showing signs of a corrective pullback within the broader uptrend.
Support Zone: 1.8650 – a key level from previous consolidation. Price is currently testing or approaching this level.
A bullish rebound from 1.8650 would confirm ongoing upside momentum, with potential targets at:
1.8820 – initial resistance
1.8840 – psychological and structural level
1.8900 – extended resistance on the longer-term chart
Bearish Scenario:
A confirmed break and daily close below 1.8650 would weaken the bullish outlook and suggest deeper downside risk toward:
1.8620– minor support
1.8590 – stronger support and potential demand zone
Outlook:
Bullish bias remains intact while the GBPCAD holds above 1.8650. A sustained break below this level could shift momentum to the downside in the short term.
This communication is for informational purposes only and should not be viewed as any form of recommendation as to a particular course of action or as investment advice. It is not intended as an offer or solicitation for the purchase or sale of any financial instrument or as an official confirmation of any transaction. Opinions, estimates and assumptions expressed herein are made as of the date of this communication and are subject to change without notice. This communication has been prepared based upon information, including market prices, data and other information, believed to be reliable; however, Trade Nation does not warrant its completeness or accuracy. All market prices and market data contained in or attached to this communication are indicative and subject to change without notice.
GBPCAD

MarketBreakdown | GBPUSD, USDJPY, GBPCAD, GBPCHF
Here are the updates & outlook for multiple instruments in my watch list.
1️⃣ #GBPUSD daily time frame 🇬🇧🇺🇸
The pair is trading in a short-term downtrend since
the middle of September.
It looks like the market successfully completed a correctional movement
after a formation of a new local Lower Low and ready to drop lower.
With a high probability, we will see a test of 1.325 level soon
with a potential continuation lower to 1.321.
2️⃣ #USDJPY daily time frame 🇯🇵🇺🇸
The price is currently breaking a significant daily resistance.
I think that the price is going to rise more and reach monthly highs.
A consequent bullish breakout of 153.3 level and a daily
candle close above that will push the pair way higher.
3️⃣ #GBPCAD daily time frame 🇬🇧🇨🇦
The pair is testing a major bullish OB order block zone.
Trading in a strong uptrend, chances will be high to see a bullish
movement from the underlined area and a trend continuation.
4️⃣ #GBPCHF daily time frame 🇬🇧🇨🇭
The price is currently stuck on a major daily support cluster.
Its breakout will be a historical event and confirm a continuation
of a bearish trend to lower levels.
Do you agree with my market breakdown?
❤️Please, support my work with like, thank you!❤️
I am part of Trade Nation's Influencer program and receive a monthly fee for using their TradingView charts in my analysis.

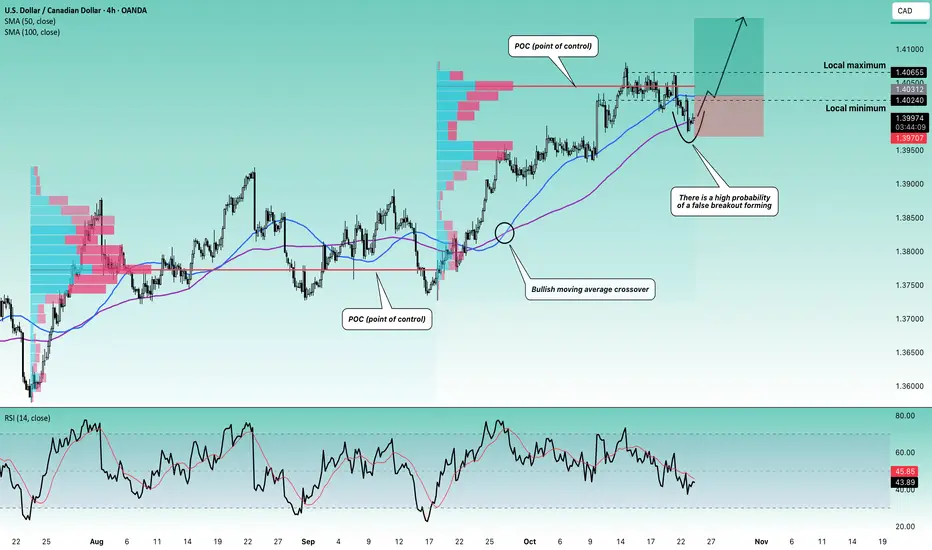
Stop!Loss|Market View: USDCAD🙌 Stop!Loss team welcomes you❗️
In this post, we're going to talk about the near-term outlook for the USDCAD currency pair☝️
Potential trade setup:
🔔Entry level: 1.40312
💰TP: 1.41455
⛔️SL: 1.39707
"Market View" - a brief analysis of trading instruments, covering the most important aspects of the FOREX market.
👇 In the comments 👇 you can type the trading instrument you'd like to analyze, and we'll talk about it in our next posts.
💬 Description: The focus on the accumulation area of 1.40240 - 1.40655 remains despite the breakout of its lower border. We are currently most likely observing the formation of a false breakout. The main scenario is the price closing above 1.40240 again, thereby forming a false breakout. Buy trades towards 1.41000 and 1.42000 can be actively looked for in this case. A more conservative option is to look for a buy trade via a breakout of the upper border of 1.40655.
Thanks for your support 🚀
Profits for all ✅
❗️ Updates on this idea can be found below 👇
GBP/CAD BEST PLACE TO SELL FROM|SHORT
GBP/CAD SIGNAL
Trade Direction: short
Entry Level: 1.883
Target Level: 1.871
Stop Loss: 1.891
RISK PROFILE
Risk level: medium
Suggested risk: 1%
Timeframe: 12h
Disclosure: I am part of Trade Nation's Influencer program and receive a monthly fee for using their TradingView charts in my analysis.
✅LIKE AND COMMENT MY IDEAS✅

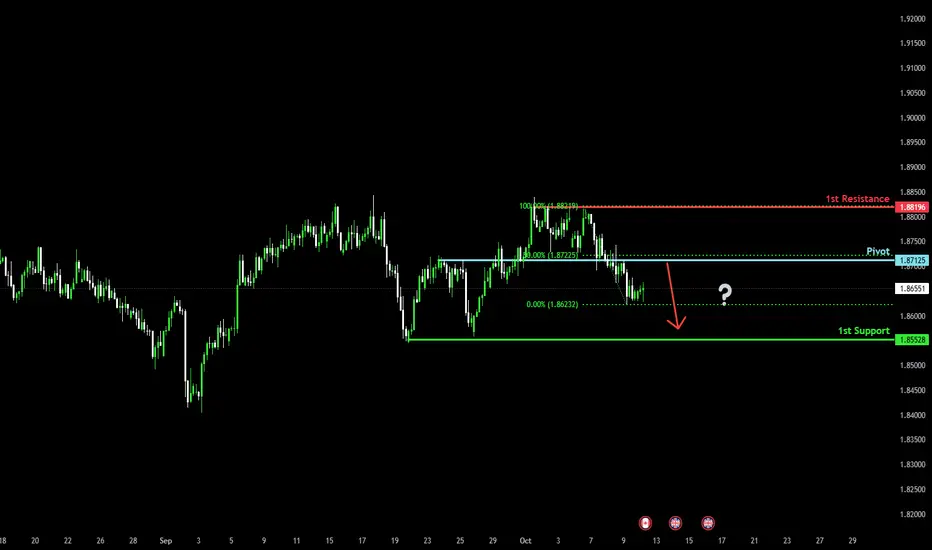
Bearish drop?GBP/CAD has reacted off the pivot which acts as a pullback resistance and could drop to the major support.
Pivot: 1.8748
1st Support: 1.8549
1st Resistance: 1.8892
Disclaimer:
The above opinions given constitute general market commentary, and do not constitute the opinion or advice of IC Markets or any form of personal or investment advice.
Any opinions, news, research, analyses, prices, other information, or links to third-party sites contained on this website are provided on an "as-is" basis, are intended only to be informative, is not an advice nor a recommendation, nor research, or a record of our trading prices, or an offer of, or solicitation for a transaction in any financial instrument and thus should not be treated as such. The information provided does not involve any specific investment objectives, financial situation and needs of any specific person who may receive it. Please be aware, that past performance is not a reliable indicator of future performance and/or results. Past Performance or Forward-looking scenarios based upon the reasonable beliefs of the third-party provider are not a guarantee of future performance. Actual results may differ materially from those anticipated in forward-looking or past performance statements. IC Markets makes no representation or warranty and assumes no liability as to the accuracy or completeness of the information provided, nor any loss arising from any investment based on a recommendation, forecast or any information supplied by any third-party.

GBP/CAD Looks Set To Mean RevertA two-bar bearish reversal pattern (dark cloud cover) has formed around the monthly D1 pivot, suggesting that momentum could temporarily shift lower. Bears may look to fade retracements within the reversal zone and maintain a short-term bearish bias while prices remain below last week’s high.
The 20-day EMA, 50-day EMA, and monthly pivot point could serve as downside targets for bears — or potential swing-low zones for bulls to monitor.
A break below 1.8550 would signal a deeper correction or potentially a trend reversal in progress.
Matt Simpson, Market Analyst at City Index and Forex.com

GBPCAD - Signal#GBPCAD - Signal
H4 - Formation of the 3rd wave + breakout of the trend line. Stop behind the high of the 1st wave.
Entry: 1.88035
TP: 1.87386 - 1.86952 - 1.86294 - 1.84902
Stop: 1.89167

GBPCAD: Price Supported Above Daily HTLKey Observations
Price is holding above the daily HTL, which is a good sign that this breakout is likely structural and there isn't much selling pressure (resistance)
On the H1 timeframe, price is also showing a similar characteristic. Price tried to trade below the EMA but could not.
Since price is accelerating to the upside once again, it's likely we'll be seeing trend continuation throughout the rest of the week.

GBPCAD Will Fall! Short!
Take a look at our analysis for GBPCAD.
Time Frame: 1D
Current Trend: Bearish
Sentiment: Overbought (based on 7-period RSI)
Forecast: Bearish
The market is approaching a key horizontal level 1.885.
Considering the today's price action, probabilities will be high to see a movement to 1.870.
P.S
The term oversold refers to a condition where an asset has traded lower in price and has the potential for a price bounce.
Overbought refers to market scenarios where the instrument is traded considerably higher than its fair value. Overvaluation is caused by market sentiments when there is positive news.
Like and subscribe and comment my ideas if you enjoy them!

GBPCAD Will Keep Growing!
HI,Traders !
#GBPCAD made a bullish
Breakout of the key horizontal
Level of 1.88061 and the
Breakout is confirmed so
We are bullish biased
And we will be expecting
A further bullish continuation !
Comment and subscribe to help us grow !

GBPCAD STRONG BREAKOUT|LONG|
✅GBPCAD has confirmed an ICT-style bullish breakout above the key level, showing strong displacement and market structure shift. A possible retest of the breaker block could offer continuation toward the 1.8920$ target. Time Frame 5H.
LONG🚀
✅Like and subscribe to never miss a new idea!✅

GBP/CAD 382 MA Retest – A Clean Setup for Swing Buyers!🎯 GBP/CAD: The Great British Heist Setup!💰
📊 Asset Overview
GBP/CAD (British Pound Sterling vs Canadian Dollar)
Market: Forex
Trade Type: Swing/Day Trade
Style: The Thief Method 🦹♂️💼
🔍 Market Analysis
The Setup: Bullish Confirmation Play
We're eyeing a bullish confirmation with a clean retest pullback at the 382 Moving Average inside a triangular pattern formation. The Sterling is showing strength against the Loonie, and this pullback to the 382 MA could be your golden ticket for entry! 🎫✨
🎯 Trading Plan
📍 Entry Strategy
You've got two paths to infiltrate this trade:
Option 1: Market Execution 💨
Enter at current price levels when price retests and bounces off the 382 Moving Average
Option 2: The Thief Layering Strategy 🎯
Multiple limit orders stacked like a pro heist team:
Layer 1: 1.87500
Layer 2: 1.87800
Layer 3: 1.88000
Layer 4: 1.88300
Pro Tip: You can add more layers based on your risk appetite and account size! The more layers, the better your average entry becomes. 🧠💡
🛡️ Risk Management
Stop Loss: 1.87000 🚨
This is the Thief's recommended escape hatch. However, this is NOT financial advice — adjust your stop loss based on YOUR risk tolerance and trading plan. You're the boss of your own money! 👑💰
🎯 Profit Targets
Target: 1.90000 🏁
This level acts as a police barricade 🚔 — expect strong resistance here! Multiple confluences:
Historical resistance zone
Potential overbought conditions
Classic trap territory for late entries
Exit Strategy: Take profits in stages! Don't be greedy. Lock in gains and let the rest ride if momentum continues.
⚠️ Reminder: This is MY target level, but YOU control YOUR exits. Take profits when YOU'RE comfortable. Risk management is KING! 👑
🔗 Related Pairs to Watch
Keep your eyes on these correlated markets for confirmation:
💵 OANDA:USDCAD — The Loonie's behavior against the Dollar can signal CAD strength/weakness
💷 FX:GBPUSD (Cable) — Pound strength indicator across the board
🛢️ Crude Oil ( BLACKBULL:WTI / BLACKBULL:BRENT ) — Canadian Dollar is oil-sensitive; rising oil = stronger CAD
💰 OANDA:XAUUSD (Gold) — Risk-on/risk-off sentiment gauge
Key Correlation Point: If USD/CAD is falling while GBP/USD is rising, that's your double confirmation that GBP/CAD should climb! 📈🔥
⚙️ Technical Confluences
✅ Price retesting the 382 Moving Average as dynamic support
✅ Triangular pattern formation suggesting consolidation before breakout
✅ Bullish market structure intact
✅ Higher lows pattern forming
✅ Volume supporting the upside move
🎭 The Thief's Final Words
This setup combines technical precision with strategic layering — the hallmark of the Thief method! The 382 MA has been a reliable dynamic support level, and this retest presents a high-probability entry zone. Whether you're a swing trader looking for multi-day moves or a day trader scalping intraday momentum, this plan adapts to YOUR style.
Remember: Markets don't care about your feelings. Stick to the plan, manage your risk, and let probability work in your favor! 🎲📊
📢 Community Love
✨ If you find value in my analysis, a 👍 and 🚀 boost is much appreciated — it helps me share more setups with the community!
#GBPCAD #ForexTrading #SwingTrading #DayTrading #TheThiefMethod #ForexSignals #TechnicalAnalysis #MovingAverage #PriceAction #ForexCommunity #TradingView #ForexStrategy #RiskManagement #BullishSetup #ForexAnalysis #GBP #CAD #CurrencyTrading #ForexEducation #TradingIdeas

GBPCAD: Short Signal Explained
GBPCAD
- Classic bearish pattern
- Our team expects retracement
SUGGESTED TRADE:
Swing Trade
Sell GBPCAD
Entry - 1.8766
Stop - 1.8787
Take - 1.8730
Our Risk - 1%
Start protection of your profits from lower levels
Disclosure: I am part of Trade Nation's Influencer program and receive a monthly fee for using their TradingView charts in my analysis.
❤️ Please, support our work with like & comment! ❤️

GBPCAD Is Going Up! Buy!
Please, check our technical outlook for GBPCAD.
Time Frame: 1h
Current Trend: Bullish
Sentiment: Oversold (based on 7-period RSI)
Forecast: Bullish
The market is trading around a solid horizontal structure 1.867.
The above observations make me that the market will inevitably achieve 1.872 level.
P.S
The term oversold refers to a condition where an asset has traded lower in price and has the potential for a price bounce.
Overbought refers to market scenarios where the instrument is traded considerably higher than its fair value. Overvaluation is caused by market sentiments when there is positive news.
Like and subscribe and comment my ideas if you enjoy them!

GBP/CAD 4HR Trendline Breakout Long Setup. Daily Continuation.I am going to be placing a trade once spread hour is over on the daily open on GBP/CAD to the upside.
Stoploss and take profit is provided.
I will be looking to trail my stoploss either at the 4HR or 8HR Lows as the trade progresses based on my own discretion.
Mostly likely will close the trade at the close of Tuesday daily candle if I feel this is the right decision to make.

GBP/CAD BEARS ARE GAINING STRENGTH|SHORT
Hello, Friends!
The BB upper band is nearby so GBP-CAD is in the overbought territory. Thus, despite the uptrend on the 1W timeframe I think that we will see a bearish reaction from the resistance line above and a move down towards the target at around 1.864.
Disclosure: I am part of Trade Nation's Influencer program and receive a monthly fee for using their TradingView charts in my analysis.
✅LIKE AND COMMENT MY IDEAS✅

GBPCAD Risky Long! Buy!
Hello,Traders!
GBPCAD is reacting from the horizontal demand area after a deep push into discount pricing. Smart Money shows signs of accumulation, suggesting potential bullish recovery toward 1.8600 to rebalance inefficiency. Time Frame 3H.
Buy!
Comment and subscribe to help us grow!
Check out other forecasts below too!
Disclosure: I am part of Trade Nation's Influencer program and receive a monthly fee for using their TradingView charts in my analysis.

Heading into 50% Fibonacci resistance?GBP/CAD is rising towards the pivot and could reverse to the 1st support.
Pivot: 1.8712
1st Support: 1.8552
1st Resistance: 1.8819
Disclaimer:
The above opinions given constitute general market commentary, and do not constitute the opinion or advice of IC Markets or any form of personal or investment advice.
Any opinions, news, research, analyses, prices, other information, or links to third-party sites contained on this website are provided on an "as-is" basis, are intended only to be informative, is not an advice nor a recommendation, nor research, or a record of our trading prices, or an offer of, or solicitation for a transaction in any financial instrument and thus should not be treated as such. The information provided does not involve any specific investment objectives, financial situation and needs of any specific person who may receive it. Please be aware, that past performance is not a reliable indicator of future performance and/or results. Past Performance or Forward-looking scenarios based upon the reasonable beliefs of the third-party provider are not a guarantee of future performance. Actual results may differ materially from those anticipated in forward-looking or past performance statements. IC Markets makes no representation or warranty and assumes no liability as to the accuracy or completeness of the information provided, nor any loss arising from any investment based on a recommendation, forecast or any information supplied by any third-party.
Stop!Loss|Market View: USDCAD🙌 Stop!Loss team welcomes you❗️
In this post, we're going to talk about the near-term outlook for the USDCAD currency pair☝️
Potential trade setup:
🔔Entry level: 1.39754
💰TP: 1.40513
⛔️SL: 1.39279
"Market View" - a brief analysis of trading instruments, covering the most important aspects of the FOREX market.
👇 In the comments 👇 you can type the trading instrument you'd like to analyze, and we'll talk about it in our next posts.
💬 Description: The bullish potential is still alive for USDCAD. Currently, we are seeing active price accumulation near short-term resistance at 1.39580, which indicates buyers are taking the initiative. A potential buy trade is being considered based on a breakout of the upper accumulation boundary. In the mid-term, growth to 1.42000 and 1.43000 is expected.
Thanks for your support 🚀
Profits for all ✅
❗️ Updates on this idea can be found below 👇

Potential bearish drop?GBP/CAD has reacted off the resistance level, which is an overlap resistance, and could drop from this level to our take profit.
Entry: 1.8711
Why we like it:
There is an overlap resistance level.
Stop loss: 1.8822
Why we like it:
There is a multi-swing high resistance level.
Take profit: 1.8553
Why we like it:
There is a multi-swing low support level.
Enjoying your TradingView experience? Review us!
Please be advised that the information presented on TradingView is provided to Vantage (‘Vantage Global Limited’, ‘we’) by a third-party provider (‘Everest Fortune Group’). Please be reminded that you are solely responsible for the trading decisions on your account. There is a very high degree of risk involved in trading. Any information and/or content is intended entirely for research, educational and informational purposes only and does not constitute investment or consultation advice or investment strategy. The information is not tailored to the investment needs of any specific person and therefore does not involve a consideration of any of the investment objectives, financial situation or needs of any viewer that may receive it. Kindly also note that past performance is not a reliable indicator of future results. Actual results may differ materially from those anticipated in forward-looking or past performance statements. We assume no liability as to the accuracy or completeness of any of the information and/or content provided herein and the Company cannot be held responsible for any omission, mistake nor for any loss or damage including without limitation to any loss of profit which may arise from reliance on any information supplied by Everest Fortune Group.

GBP-CAD Bearish Breakout! Sell!
Hello,Traders!
GBPCAD confirms a bearish breakout below the ascending trendline, signaling a potential shift in market structure. Smart Money likely engineered liquidity above before breaking down, targeting 1.8620 for rebalancing. Time Frame 3H.
Sell!
Comment and subscribe to help us grow!
Check out other forecasts below too!
Disclosure: I am part of Trade Nation's Influencer program and receive a monthly fee for using their TradingView charts in my analysis.

GBPCAD support rebound at 1.8650The GBPCAD remains in a bullish trend, with recent price action showing signs of a corrective pullback within the broader uptrend.
Support Zone: 1.8650 – a key level from previous consolidation. Price is currently testing or approaching this level.
A bullish rebound from 1.8650 would confirm ongoing upside momentum, with potential targets at:
1.8820 – initial resistance
1.8840 – psychological and structural level
1.8900 – extended resistance on the longer-term chart
Bearish Scenario:
A confirmed break and daily close below 1.8650 would weaken the bullish outlook and suggest deeper downside risk toward:
1.8620– minor support
1.8590 – stronger support and potential demand zone
Outlook:
Bullish bias remains intact while the GBPCAD holds above 1.8650. A sustained break below this level could shift momentum to the downside in the short term.
This communication is for informational purposes only and should not be viewed as any form of recommendation as to a particular course of action or as investment advice. It is not intended as an offer or solicitation for the purchase or sale of any financial instrument or as an official confirmation of any transaction. Opinions, estimates and assumptions expressed herein are made as of the date of this communication and are subject to change without notice. This communication has been prepared based upon information, including market prices, data and other information, believed to be reliable; however, Trade Nation does not warrant its completeness or accuracy. All market prices and market data contained in or attached to this communication are indicative and subject to change without notice.

GBPCAD Trading Opportunity! BUY!
My dear friends,
Please, find my technical outlook for GBPCAD below:
The instrument tests an important psychological level 1.8662
Bias - Bullish
Technical Indicators: Supper Trend gives a precise Bullish signal, while Pivot Point HL predicts price changes and potential reversals in the market.
Target - 1.8727
About Used Indicators:
Super-trend indicator is more useful in trending markets where there are clear uptrends and downtrends in price.
Disclosure: I am part of Trade Nation's Influencer program and receive a monthly fee for using their TradingView charts in my analysis.
———————————
WISH YOU ALL LUCK
