USD/JPY | Higher and higher! (READ THE CAPTION)As you can see in the hourly chart of USDJPY, the week started for it by opening in the FVG, at 156.756 level. However, it went on to make it out of the FVG once more and broke through the supply zone, going as high as 157.300 and inside the FVG, before dropping back to the supply zone and hitting the low of it and then going up higher and it's now being traded at 157.070 and barely out of the supply zone. I expect USDJPY to retest the FVG soon.
Targets: 157.120, 157.210, 157.300 and 157.390
GBPUSD

XAU/USD | Bullish Structure Remains Intact (READ THE CAPTION)By analyzing the #Gold chart on the 4-hour timeframe, we can see that price first made a clean pullback to $4274, then strong demand stepped in and pushed gold sharply higher to $4440. After reaching this key psychological resistance, price corrected and is now trading around $4414.
If gold can close and hold above $4404, we can expect further upside. That said, a short-term pullback toward the $4334–$4346 zone is still possible. With ongoing geopolitical risks, gold could even push toward levels above $4550 in the short term. Let’s see how the market reacts next.
Please support me with your likes and comments to motivate me to share more analysis with you and share your opinion about the possible trend of this chart with me !
Best Regards , Arman Shaban

EUR/AUD | Going lower? (READ THE CAPTION)By examining the 4h chart of EURAUD we can see that it has been gradually dropping in price and is still going lower. It is currently being traded at 1.74870. Should it make a comeback, it'll test the NWOG and dropping from there again is possible.
Bullish Targets: 1.74970, 1.75070, 1.75170 and 1.75270
Bearish Targets: 1.74770, 1.74670, 1.74570 and 1.17470.

EURUSD Bearish Continuation After PullbackQuick Summary
EURUSD broke below 1.16824, A corrective move toward the orderblock at 1.17143 is possible
This pullback is expected to act as a continuation zone for further downside and The main objective remains which is filling the liquidity void after the bullish trendline break
Full Analysis
After EURUSD successfully broke below the 1.16824 level the bearish structure remains valid
This break confirms that sellers are still in control following the loss of the previous bullish trendline
From here price may attempt a corrective move higher toward the orderblock around 1.17143
This area is viewed as a potential mitigation zone rather than a reversal point
If price reacts from this orderblock the expectation is continuation to the downside
The overall objective of this move is to continue filling the liquidity void that was left behind during the previous impulsive bullish move
As long as price remains below the broken structure this pullback is considered corrective
The bearish bias remains intact and the focus stays on downside continuation.

GBPUSD Bearish Structure After Supply Zone RejectionThe GBPUSD 2-hour chart shows price rejecting a higher-timeframe supply zone after a liquidity sweep, followed by a clear change of character (CHoCH) indicating a bearish shift in market structure. Price then continues within a descending channel, suggesting sustained selling pressure. Two downside targets are marked, with the first target near recent support and the second aligning closer to the demand zone, highlighting a continuation move toward lower liquidity areas.

XAU/USD | On its way! (READ THE CAPTION)By examining the hourly chart of XAUUSD, we can see that Gold started the week with a big NWOG, spanning from 4332.065 to 4356.505. Currently Gold is in the FVG, hitting the Consequent Encroachment of the FVG, trying to go through it. Currently Gold is being traded at 4428, and I expect further struggle with the FVG to break through it.
Targets: 4448, 4471, 4494, 4520, 4540 and 4600.

GBP/USD Struggles Near Resistance, Caution BuildsGBP/USD Struggles Near Resistance, Caution Builds
GBP/USD failed to climb above 1.3500 and corrected some gains.
Important Takeaways for GBP/USD Analysis Today
- The British Pound is showing bearish signs below 1.3500.
- There is a key bearish trend line forming with resistance near 1.3470 on the hourly chart of GBP/USD.
GBP/USD Technical Analysis
On the hourly chart of GBP/USD, the pair started a fresh decline after it failed to stay above 1.3500. The British Pound traded below 1.3460 to enter a short-term bearish zone against the US Dollar.
There was a clear move below 1.3435. The pair even settled below 1.3430 and the 50-hour simple moving average. A low was formed at 1.3414, and the pair is now consolidating losses. On the upside, the GBP/USD chart indicates that the pair is facing resistance near the 23.6% Fib retracement level of the downward move from the 1.3502 swing high to the 1.3414 low at 1.3435.
The next key sell zone could be 1.3460 and the 50% Fib retracement. The main hurdle for the bulls might be near a bearish trend line at 1.3470. A close above 1.3470 could open the doors for a move toward 1.3500.
If the pair fails to recover, it could start another decline. On the downside, there is a key support forming near 1.3400. If there is a downside break below 1.3400, the pair could accelerate lower.
The next major area of interest might be 1.3360, below which the pair could test 1.3320. Any more losses could lead the pair to 1.3250.
This article represents the opinion of the Companies operating under the FXOpen brand only. It is not to be construed as an offer, solicitation, or recommendation with respect to products and services provided by the Companies operating under the FXOpen brand, nor is it to be considered financial advice.

GBPUSD — FRGNT DAILY CHART FORECAST Q1 | D6 | W1 | Y26📅 Q1 | D6 | W1 | Y26
📊 GBPUSD — FRGNT DAILY CHART FORECAST
🔍 Analysis Approach
I’m applying a developed version of Smart Money Concepts, with a structured focus on:
• Identifying Key Points of Interest (POIs) on Higher Time Frames (HTFs) 🕰️
• Using those POIs to define a clear and controlled trading range 📐
• Refining those zones on Lower Time Frames (LTFs) 🔎
• Waiting for a Break of Structure (BoS) as confirmation ✅
This process keeps me precise, disciplined, and aligned with market narrative, rather than reacting emotionally or chasing price.
💡 My Motto
“Capital management, discipline, and consistency in your trading edge.”
A positive risk-to-reward ratio, combined with a high-probability execution model, is the backbone of any sustainable trading plan 📈🔐
⚠️ On Losses
Losses are part of the mathematical reality of trading 🎲
They don’t define you — they are necessary, expected, and managed.
We acknowledge them, learn, and move forward 📊➡️
🙏 I appreciate you taking the time to review my Daily Forecast.
Further context and supporting material can be found in the Links section.
Stay sharp 🧠
Stay consistent 🎯
Protect your capital 🔐
— FRGNT 🚀📈
FX:GBPUSD

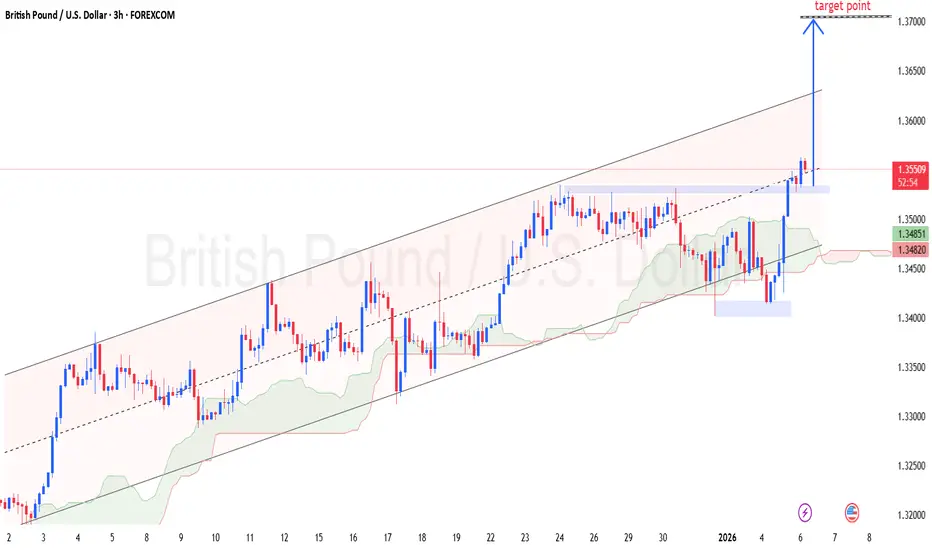
GBPUSD – (3H) Chart pattern...GBPUSD – (3H) Chart pattern.
📍 Current price area: ~1.3550
📊 Structure: Ascending channel + bullish continuation
🎯 Targets
TP1: 1.3600 (recent structure / minor resistance)
TP2: 1.3650 (channel mid–upper zone)
TP3 (final): 1.3700 🎯 (upper channel target point my marked)
🛑 Stop Loss
SL: 1.3480 – 1.3500 (below demand zone & cloud support)
🧠 Trade Logic
Strong bullish impulse from demand
Price holding above Ichimoku cloud
Clear upside space to upper channel
✅ Safe plan: Partial at TP1, move SL to BE
🔥 Aggressive: Hold till 1.3700 with trailing SL
If my want, I can give exact entry, RR ratio, or scalp version.
GBPUSD: BoS Trading 🇬🇧🇺🇸
I see a confirmed bullish break of structure on GBPUSD on a daily.
After a breakout, the market retest a broken structure and we see
a strong buying imbalance on an hourly time frame.
Expect more growth today.
Goal - 1.3575
❤️Please, support my work with like, thank you!❤️
I am part of Trade Nation's Influencer program and receive a monthly fee for using their TradingView charts in my analysis.

GBPUSD - time to buyGBPUSD was in a recent downtrend for the last few weeks and struggled to stay bullish, but recently it has just broken a strong resistance trend line which it tested several times and failed to break through. GBPUSD is very likely to hit the next major resistance zone which is market as the "TAKE PROFIT" LEVEL. There are many clear signs of new bullish movements. Buy GBPUSD now.

DeGRAM | GBPUSD will retest the $1.35 level📊 Technical Analysis
● GBP/USD rallied into the upper boundary of a medium-term ascending channel and stalled beneath the 1.3560 resistance level, forming a clear lower-high reversal pattern on the 30-min timeframe. Recent price action shows rejection candles and loss of upward momentum.
● After breaking short-term support near 1.3530, price structure favors continuation lower toward the next support at ~1.3505 and beyond if sellers remain in control.
💡 Fundamental Analysis
● The pound is weakening as UK macro momentum slows and USD demand increases amid safe-haven flows and dovish Fed speculation, reinforcing bearish pressure on GBP/USD.
✨ Summary
● Medium-term short bias. Resistance: ~1.3560. Key break: 1.3530. Targets: 1.3505 → lower support. Bias weakens above 1.3560.
-------------------
Share your opinion in the comments and support the idea with a like. Thanks for your support!

GBP/USD Fibonacci Support -> Bullish EngulfI'm still tracking GBP/USD as one of the more attractive major pairs for USD-weakness scenarios and today illustrates that theme well.
The pair opened with a pullback and test of support at the Fibonacci level of 1.3414. Bulls responded to that in a big way, and at this point the daily bar for Cable is showing as a bullish engulfing pattern, which points to the possibility of more upside ahead. This contrasts with the current daily bar in EUR/USD which is showing as a hammer, which can also be construed as bullish but it's not quite to the same degree as the engulfing formation. - js

XAU/USD | Bullish momentum continues (READ THE CAPTION)As you can see in the Hourly chart of Gold, the market opened at 4356 yesterday and then it went on a Bullish Move, reaching as high as 4475. That means in a matter of a single day, Gold moved more than 1000 pips!
Currently it is being traded at 4455, I can see it going going to the high of the FVG and then going upwards again.
Gold Targets for now: 4463, 4475, 4487 and 4500.
P.S: Be cautious with your trades and watch out for geo-politic events.

EUR/USD | Bullish momentum to continue? (READ THE CAPTION)Good morning folks, Amirali here, we start today with an analysis on EURUSD.
By analysing the 4H chart of EURUSD we can see that yesterday, after hitting the low of the FVG, EURUSD started an strong bullish move, going from 1.1659 to 1.1742 and is now being traded there.
I expect EURUSD to go through the NWOG that is in right now, and test the NDOG above at 1.1746-1.7450 zone. After which we should see if it goes through the NDOG as well or not.
For the time being, the targets are: 1.17450, 1.17520, 1.17590 and 1.17660.

GBPUSD -Breaking old highsThis is why is important to zoom out your charts. GBPUSD is currently breaking old highs from the 3RD Quarter from 2025 from June-September. Even though your analysis can be accurate on the small-time frames this is the reasons why you still lose a trade because you simply didn't zoom out the timeframe and pay attention on what's going on in the big picture. New highs are being created in current price while taking out old highs from 3-6months ago. Yes, it can reverse but this is how u prevent yourself to get stopped out. Once you know what's going on, on the big timeframes then you can lower your timeframe for and entry and accuracy.

CRT IDEAPrice Raided the BSL then printed a down closed candle.
That candle SSL is still intact and can be the potential draw.
Im using the "middle" candle, also the candle that is likely going to be the lower swing high point as the trigger to go short once the low is reached or retested.
I picked a swing low simply for a TP area.

GBPUSD Swing Reversal Trade Possible ZonesGBPUSD has reached an FCP zone which can act as resistance. A W pattern has alco completed there.
If this one does not gold, then we have a level and another FCP zone above which should make the market go in to a correction at least for a little while.
Trade what you see, manage the risk.

EURUSD Liquidity Grab Above TrendlineQuick Summary
EURUSD may break the bearish trendline to collect more liquidity, After that move a downside continuation is expected
The main target is the liquidity void created yesterday after a strong bullish move of more than 80 pips without any mitigation
Full Analysis
There is a potential scenario on EURUSD where price may first break above the bearish trendline
This move would likely serve as a liquidity grab rather than a true trend reversal
Yesterday EURUSD rallied strongly for more than 80 pips without retesting any levels
This impulsive move left a clear liquidity void below which often acts as a magnet for price
By breaking the bearish trendline price can attract additional buy side liquidity before reversing lower, Once enough liquidity is collected the expectation is for EURUSD to resume the downside move
The liquidity void left behind represents a strong downside objective and As long as price behavior supports this scenario the focus remains on a potential drop after the liquidity grab above the trendline

NZD/USD | Up and Down (READ THE CAPTION)In the 4H chart of NZDUSD we can see that after hitting the Bullish OB several times, it managed to make a bullish move and it reacted to the Volume Imbalance zone at 0.5791-93, and then it went to reach as high as 0.58105, and now it's being traded 0.5798, testing the IFVG as the whether it'll bounce back up and continue its movement or a further drop incoming.
Bullish Targets: 0.58030, 0.58100, 0.58170 and 0.58240.
Bearish Targets are: 0.57930, 0.57850 and 0.57770.

Potential 10X on GBPUSDAfter an extended bullish expansion, GBPUSD is now approaching a critical price zone that may determine the market’s directional bias for the next several months.
From a macro perspective, persistent geopolitical tensions continue to support a defensive repositioning into the U.S. Dollar. This outlook is reinforced by the structure on the DXY, which suggests the Dollar is positioning for a broader recovery phase.
Given these conditions, I am preparing for a potential medium-term bearish transition on GBPUSD. Rather than reacting late, the plan is to position early once downside intent is confirmed, targeting asymmetric risk-to-reward.
Proposed Sell Zone: 1.3580
First Target: 1.3260
Extended Target: 1.2786 (subject to sustained bearish momentum)
While there are notable demand zones below, continuation into the lower target remains viable if price demonstrates clear commitment to the downside.
This bearish bias will be invalidated if price establishes strength above the 1.3660 region on the 4-hour timeframe.
Risk management remains paramount. Position sizing should stay well within individual tolerance levels, as confirmation remains the execution trigger.
Patience is the Way! Ieios

GBPUSD – Breakout or Reversal IncomingPrice is currently reacting at a clearly defined supply / resistance zone, which has acted as a rejection area multiple times in the recent session. This zone is the decision point for the next directional move.
🔹 Bullish Scenario:
A strong 15-minute close above the resistance zone would indicate acceptance and bullish continuation. In this case, price may pull back slightly before pushing higher toward the upper target, following a higher-high structure.
🔹 Bearish Scenario:
Failure to break and hold above this zone, followed by bearish rejection, would signal continuation to the downside. This could lead to a move back toward the lower target, aligning with a rejection-based reversal from resistance.
📌 Bias: Neutral until confirmation
📌 Strategy: Wait for confirmation (break & hold or rejection) before entering
📌 Risk Management: Avoid entries inside the zone; wait for clarity
This level will determine whether buyers or sellers take control next.

EURUSD Bearish Continuation After Trend BreakQuick Summary
EURUSD remains bearish after the strong sell-off since the start of the week, the Price is expected to continue lower toward 1.17028 after this level Buy positions will only be considered as a mitigation move if a clear retracement target appears
As long as no corrective objective is visible the bearish view remains valid especially after the H4 bullish trendline break
Full Analysis
After the strong downside move that started at the beginning of the week EURUSD continues to show clear bearish strength
The break of the bullish trendline on the H4 timeframe confirms that the previous upside structure has weakened and that sellers currently showed their strength
Based on the current structure price is expected to continue its decline toward the low at 1.17028
This level will be important to monitor as it may act as a reaction zone
From my perspective any buying opportunity would only be considered as a corrective move and not a trend reversal
This means that long positions will only make sense if a clear retracement target or liquidity objective becomes visible.
If price reaches 1.17028 without showing a clear corrective setup or reaction then the bearish bias will remain unchanged
Until proven otherwise the expectation stays aligned with continued downside pressure following the H4 structure break
