Market Analysis: GBP/USD Attempts RecoveryMarket Analysis: GBP/USD Attempts Recovery
GBP/USD is attempting a recovery wave from 1.3035.
Important Takeaways for GBP/USD Analysis Today
- The British Pound started a recovery wave above 1.3050 and 1.3080.
- There is a key bearish trend line forming with resistance near 1.3110 on the hourly chart of GBP/USD.
GBP/USD Technical Analysis
On the hourly chart of GBP/USD, the pair started a fresh decline from 1.3220 after a decent increase. The British pound fell below 1.3150, re-entering a short-term bearish zone against the US dollar.
The pair even traded below 1.3050 and the 50-hour simple moving average. Finally, the bulls appeared near 1.3035. A low was formed near 1.3037 and the pair is now attempting a short-term recovery wave.
There was a fresh upside above 1.3050 and the 23.6% Fib retracement level of the downward move from the 1.3215 swing high to the 1.3037 low. The pair is now showing positive signs above 1.3080. Immediate resistance is near a bearish trend line at 1.3110.
The first major hurdle for the bulls on the GBP/USD chart is 1.3125 and the 50% Fib retracement. A close above 1.3125 might spark a decent increase. The next stop for the bulls might be 1.3175. Any more gains could lead the pair toward 1.3215 in the near term.
Initial support sits near the 50-hour simple moving average at 1.3080. The next key area of interest might be 1.3035, below which there is a risk of another sharp decline. In the stated case, the pair could drop toward 1.2965.
This article represents the opinion of the Companies operating under the FXOpen brand only. It is not to be construed as an offer, solicitation, or recommendation with respect to products and services provided by the Companies operating under the FXOpen brand, nor is it to be considered financial advice.
GBPUSD

1. Gold Correction Completed Bullish Move AheadBased on the previous analysis, we were expecting a price correction. Gold reacted perfectly and the correction provided a profitable move for us.
Now, we are anticipating a bullish movement.

GBP/USD – Bearish Structure Remains Intact as Price Rejected at GBP/USD – Bearish Structure Remains Intact as Price Rejected at Key Supply Zone (H1 Analysis)
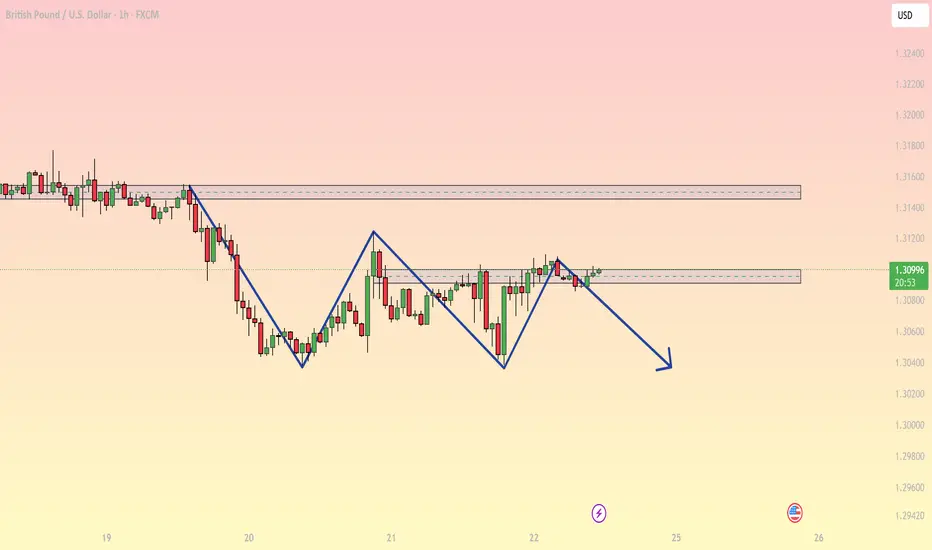
GBP/USD continues to respect the broader downtrend on the H1 timeframe. The market has formed a series of clean lower highs and lower lows, confirming that bearish momentum is still dominant.
Recently, price retested the short-term supply zone but failed to break through, signaling exhaustion from buyers and reaffirming the bearish bias. The harmonic swings drawn on the chart illustrate a consistent downward rhythm, aligning with the overall trend.
Key Technical Levels
Major resistance: 1.31450 – 1.31600 (higher supply zone)
Immediate resistance: 1.30980 – 1.31040
Short-term support: 1.30500 – 1.30420
Market Structure Insight
Price is producing a clear pattern of lower highs, indicating strong sellers at every pullback.
The recent rejection at the mid-range supply confirms limited bullish strength.
Momentum indicators (EMA compression, candlestick behavior) support a potential continuation to the downside.
Price action shows a tightening consolidation right beneath resistance, often a precursor to a bearish break.
Trading Scenarios
1. Sell Continuation Setup (High Probability)
Entry zone: 1.30980 – 1.31040
Stop-loss: Above 1.31140
Targets:
TP1: 1.30700
TP2: 1.30450 (main target)
TP3: 1.30200 (extended target if momentum increases)
Rationale:
The market is reacting to supply and remains aligned with the bearish trend, making continuation trades the most efficient.
2. Buy Scenario (Low Probability)
Only consider long positions if price breaks and closes above 1.31140
Targets: 1.31300 – 1.31500
SL: below 1.30950
3. Breakout Plan
Below 1.30420: Strong bearish momentum may accelerate toward 1.30000
Above 1.31600: Signals a major shift in market structure
GBP/USD remains bearish unless the upper resistance is broken decisively. Sellers continue to dominate, and short setups aligned with the trend offer the best probability.
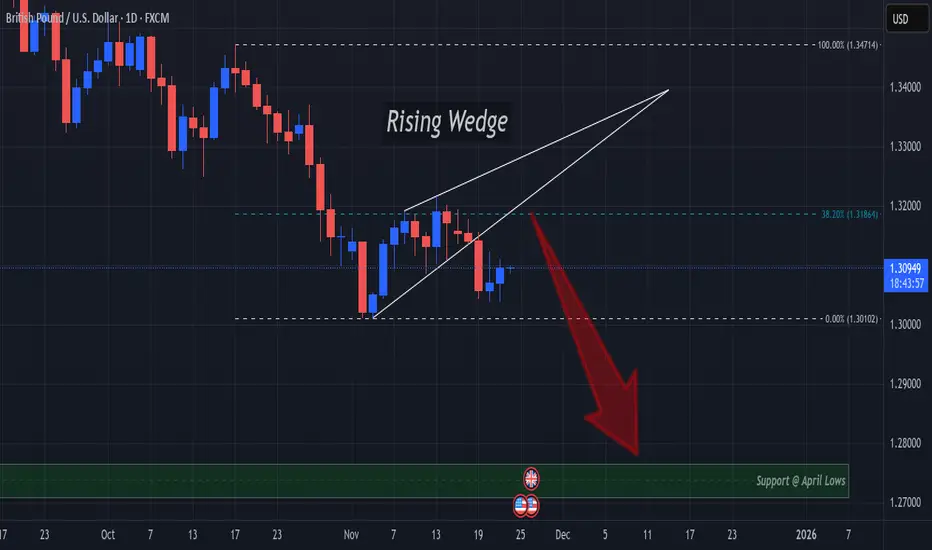
Rising Wedge Breakout Spells Decline Continuation For GUFX:GBPUSD delivered a Breakout of A Rising Wedge to end the week last week!
Next, we should suspect a Retest of this Breakout @ the 38.2% Retracement level around 1.31864.
This level proved to hold price below it through the formation of the pattern and would serve as a great area of opportunity to short the pair and ride Price down!
If the Retest of the Breakout is successful, Price would next find Support at the April Lows around the 1.28 - 1.27 area!
Fundamentally its a heavy week for USD with events for GBP littered throughout so keep a close eye on how the results end up affecting the markets!
Weekly FOREX Forecast: USD Is Bullish Vs EUR, GBP, AUD NZDWelcome back to the Weekly Forex Forecast!
This is Part 1 of the FOREX futures outlook for the week of Nov 24-28th.
In this video, we will analyze the following FX markets:
USD Index, EUR, GBP, AUD, NZD
Enjoy!
May profits be upon you.
Leave any questions or comments in the comment section.
I appreciate any feedback from my viewers!
Like and/or subscribe if you want more accurate analysis.
Thank you so much!
Disclaimer:
I do not provide personal investment advice and I am not a qualified licensed investment advisor.
All information found here, including any ideas, opinions, views, predictions, forecasts, commentaries, suggestions, expressed or implied herein, are for informational, entertainment or educational purposes only and should not be construed as personal investment advice. While the information provided is believed to be accurate, it may include errors or inaccuracies.
I will not and cannot be held liable for any actions you take as a result of anything you read here.
Conduct your own due diligence, or consult a licensed financial advisor or broker before making any and all investment decisions. Any investments, trades, speculations, or decisions made on the basis of any information found on this channel, expressed or implied herein, are committed at your own risk, financial or otherwise.

GBP-USD Free Signal! Sell!
Hello,Traders!
GBPUSD tapped the horizontal supply, swept resting buy-side liquidity and rejected cleanly from the mitigation block, showing displacement to the downside as smart money shifts order flow bearish.
--------------------
Stop Loss: 1.31249$
Take Profit: 1.30706$
Entry: 1.30971$
Time Frame: 2H
--------------------
Sell!
Comment and subscribe to help us grow!
Check out other forecasts below too!
Disclosure: I am part of Trade Nation's Influencer program and receive a monthly fee for using their TradingView charts in my analysis.

Bearish reversal off pullback resistance?Cable (GBP/USD) has rejected off the pivot which is a pullback resistance and could reverse to the overlap support.
Pivot: 1.3173
1st Support: 1.2781
1st Resistance: 1.334
Disclaimer:
The opinions given above constitute general market commentary and do not constitute the opinion or advice of IC Markets or any form of personal or investment advice.
Any opinions, news, research, analyses, prices, other information, or links to third-party sites contained on this website are provided on an "as-is" basis, are intended to be informative only, and are not advice, a recommendation, research, a record of our trading prices, an offer of, or solicitation for, a transaction in any financial instrument and thus should not be treated as such. The information provided does not involve any specific investment objectives, financial situation, or needs of any specific person who may receive it. Please be aware that past performance is not a reliable indicator of future performance and/or results. Past performance or forward-looking scenarios based upon the reasonable beliefs of the third-party provider are not a guarantee of future performance. Actual results may differ materially from those anticipated in forward-looking or past performance statements. IC Markets makes no representation or warranty and assumes no liability as to the accuracy or completeness of the information provided, nor any loss arising from any investment based on a recommendation, forecast, or any information supplied by any third party.

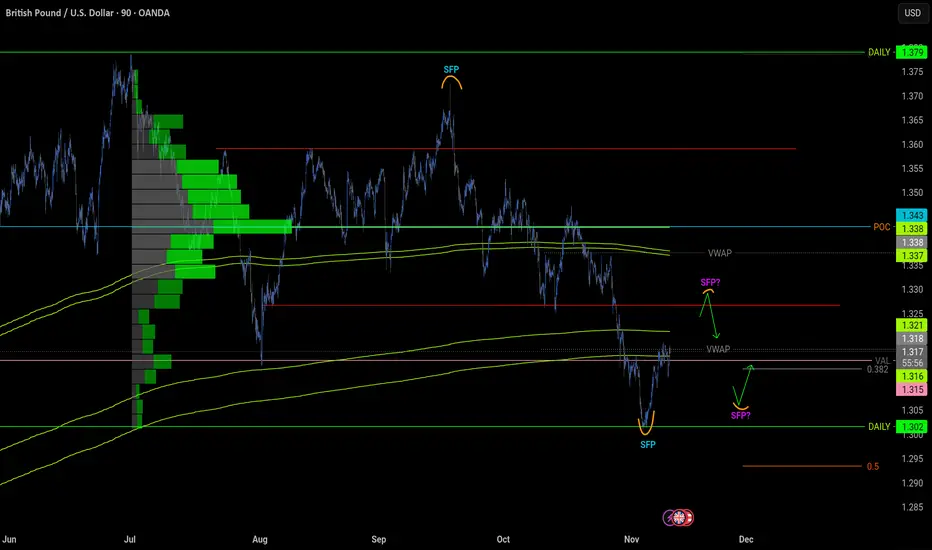
GBPUSD idea 11.11.2025On this chart I am currently looking for a short from around 1.32 where the price could react. I would first take a long around 1.307 where the SFP could be below the local bottom, but I don't know if it will hold and we don't look at another level below.
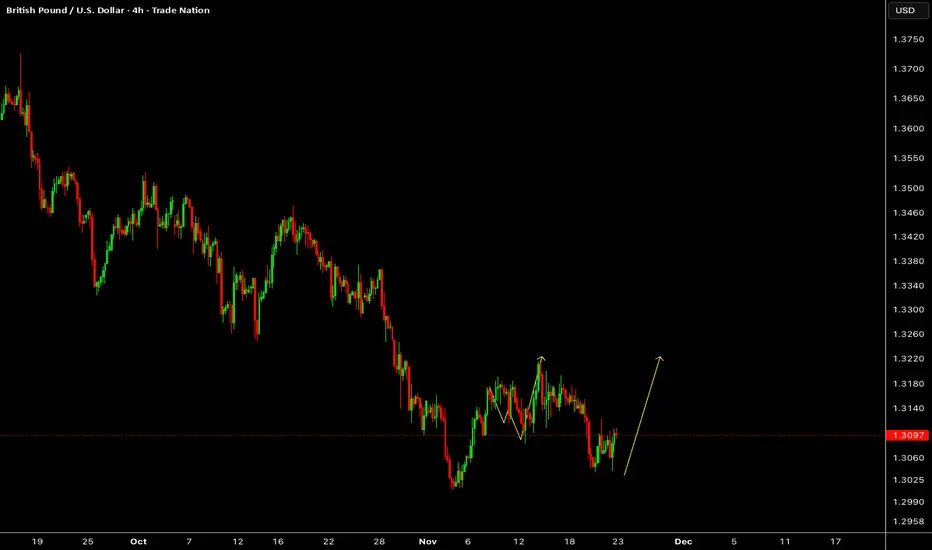
GBPUSD – Weakness Easing with Upside Recovery PotentialAfter an extended decline, price action is showing signs of deceleration, and the latest bounce hints at a short-term recovery phase developing. If momentum continues to build, an upward continuation scenario could unfold as market sentiment shifts in the coming sessions.
Disclosure: We are part of Trade Nation's Influencer program and receive a monthly fee for using their TradingView charts in our analysis.
GBPUSD IN DAILY TIMEFRAME IS BEARISH TOO.
Daily timeframe:
In the daily timeframe, analyzing GBP becomes a bit difficult because it is showing unusual behavior.
Considering the bearish outlook, there are four possible scenarios — and based on the points below, I consider scenarios 1 and 2 more likely:
1.If the US Dollar Index (DXY) continues its upward trend and manages to break the important resistance ahead of it.
2.Weekly timeframe.
3.Monthly timeframe: Since we are at the end of the month, we can expect the monthly candlestick trend to have a stronger impact on price this week.

GBPUSD CAN BE BEARISH THIS WEEK.Pound is in a downward trend and has entered a discounted (cheap) zone.
Given last week’s candlestick, it’s expected that it may break the bottom of its weekly range. However, the presence of important zones in the lower timeframes had made the decline difficult. In the 4H, 3H, 2H, and 1H timeframes, there were many untested zones that were fully mitigated last week. It seems that this week we will also see a strong bearish candlestick, in a way that it can break the bottom of its range.
Sell zones:
With this week’s candlestick turning bearish, there are good price targets for selling, and by combining them with lower timeframes we can find a good sell zone:
1.LW H
2.Weekly Liquidity
3.W FVG
4.W OB

GBPUSDAccording to the current quarter, price has been below the average. Price is also at a level where the third and fourth quarter ago from the current has averaged. There was a sign of weakness on the week on 11/2/25 and since then, price is a very small range zone. I want to see if price can test the current target. If not, remember that trading is simply a game of probabilities. It's not much to grab according to my target but I have to stick to my strategy.

GBPUSD MOVE DOWN AHEAD|SHORT|
✅GBPUSD is retracing into 2H supply after a clean sell-side sweep. A rejection here would confirm bearish displacement, opening the way for price to seek sell-side liquidity at the marked target zone.Time Frame 2H.
LONG🚀
✅Like and subscribe to never miss a new idea!✅

GBPUSD: Important Supply Zone Ahead 🇬🇧🇺🇸
There is a high probability that GBPUSD will drop
from the underlined supply zones based on a recently
broken daily support and a falling trend line.
Expect a down movement at least to 1.3024
❤️Please, support my work with like, thank you!❤️
I am part of Trade Nation's Influencer program and receive a monthly fee for using their TradingView charts in my analysis.

EUR/USD – Potential Trade SetupI was expecting a price rebound from the 1.14938 level, and the pair did touch this area. However, the current trend is downward, so the only potential entry would be after breaking the previous highs to take liquidity before resuming the decline.
Currently, the available opportunity is around 1.15633, following the high taken at 1.15525. Traders should watch for confirmations before entering and manage risk carefully, as the overall momentum remains bearish.

GBPUSD Brewing a Latte: Cup & Handle Special EditionWelcome to Market Prophecy..
The recent weekly decline in GBPUSD occurred because the price failed to break above the 1.37476 resistance level (marked in yellow) and dropped to 1.30375. If the price does not break below the 1.30375 daily support level, there is a strong likelihood that it will rebound and attempt to test the nearest resistance at 1.35639. Based on the projection I’ve drawn, there is a high probability that the price will form a cup-and-handle pattern on the weekly chart. Don’t miss the opportunity for a potential swing buy.
Good luck, everyone! And hey, don’t forget to smash that like button and drop your wildest market predictions in the comments! ❤️
Disclaimer: My trading strategy isn’t a signal—it’s more like a workout for my brain. I’m just here flexing my market structure knowledge and sharpening my trading skills while building my trade journal. Think of it as financial gym time—no personal trainers, just candlesticks!

GBP/USD faces key test in week aheadWith the US government re-opening we are starting to see the flow of data, but question marks remain about the December rate decision. Fed's Williams said that the downside risks to employment have increased and that he’s open to near-term rate cut. UoM Consumer Expectations hit a record low. The US dollar weakened and stocks rebounded off the lows. That caused the GBP/USD to hold near 1.3100 resistance. But could it resume lower?
From the UK side, Chancellor Rachael Reeves will step up for the Autumn Budget Wednesday, and the pound is treading carefully. Gilts have been volatile and the pound has drifted lower as traders weigh up the government’s fiscal credibility. Reports that the government may ditch income tax increases have only amplified concerns over how a £30bn fiscal hole will be plugged. Reeves will need to deliver a convincing plan next Wednesday; if she doesn’t, UK assets could face a rough ride.
The pound has been struggling lately, with GBP/USD forming lower highs and lower lows. The pair has broken decisively below the 1.3140 support zone—a level that held in April and later formed a double bottom in July. An attempted recovery back above the area failed, reinforcing the bearish momentum.
With the trend now pointing lower, 1.3000 becomes the next obvious downside target, and a break beneath it could open the door to further weakness.
By Fawad Razaqzada, market analyst with FOREX.com

XAU/USD | Gold Rebounds Strongly After Hitting Key Demand Zone!By analyzing the #Gold chart on the 4-hour timeframe, we can see that after reaching $4105, the price dropped again and made a sharp move down into the $4026 demand zone I mentioned in the previous analysis. As soon as gold touched this zone, strong buying pressure kicked in, pushing the price back up to around $4080.
The next short-term supply zones to watch are $4090, $4100, and $4109.
The medium-term supply zones are $4150, $4172, and $4193.
Keep an eye on gold’s reaction in these areas, they can trigger new pullbacks or confirm further upside movement.
Please support me with your likes and comments to motivate me to share more analysis with you and share your opinion about the possible trend of this chart with me !
Best Regards , Arman Shaban

GBPUSD H4 | Bearish Reaction off Key ResistanceMomentum: Bearish
Price is currently below the ichimoku cloud, and has broken the ascending trendline.
Sell entry: 1.31316
- Strong pullback resistance
- 50% Fib retracement
- 61.8% Fib Projection
Stop Loss: 1.31938
- Swing high resistance
Take Profit: 1.30405
- Swing low support
High Risk Investment Warning
Stratos Markets Limited (tradu.com/uk ), Stratos Europe Ltd (tradu.com/eu ):
CFDs are complex instruments and come with a high risk of losing money rapidly due to leverage. 70% of retail investor accounts lose money when trading CFDs with this provider. You should consider whether you understand how CFDs work and whether you can afford to take the high risk of losing your money.
Stratos Global LLC (tradu.com/en ): Losses can exceed deposits.
Please be advised that the information presented on TradingView is provided to Tradu (‘Company’, ‘we’) by a third-party provider (‘TFA Global Pte Ltd’). Please be reminded that you are solely responsible for the trading decisions on your account. Any information and/or content is intended entirely for research, educational and informational purposes only and does not constitute investment or consultation advice or investment strategy. The information is not tailored to the investment needs of any specific person and therefore does not involve a consideration of any of the investment objectives, financial situation or needs of any viewer that may receive it. Past performance is not a reliable indicator of future results. Actual results may differ materially from those anticipated in forward-looking or past performance statements. We assume no liability as to the accuracy or completeness of any of the information and/or content provided herein and the Company cannot be held responsible for any omission, mistake nor for any loss or damage including without limitation to any loss of profit which may arise from reliance on any information supplied by TFA Global Pte Ltd.

GBPUSD: Bullish Continuation is Highly Probable! Here is Why:
Remember that we can not, and should not impose our will on the market but rather listen to its whims and make profit by following it. And thus shall be done today on the GBPUSD pair which is likely to be pushed up by the bulls so we will buy!
Disclosure: I am part of Trade Nation's Influencer program and receive a monthly fee for using their TradingView charts in my analysis.
❤️ Please, support our work with like & comment! ❤️

EUR/USD – Buy Setup DevelopingThe EUR/USD is now showing potential for a buy opportunity after sweeping the trendline liquidity. The pair appears ready to rebound from the 1.15162 level, which aligns with a 1-hour Order Block—adding further confluence for a bullish reaction.
This area may serve as a strong support zone, suggesting a possible upward move if price holds above it.

GBPUSD FRGNT Daily Forecast - Q4 | W47| D21 | Y25 |📅 Q4 | W47| D21 | Y25 |
📊 GBPUSD FRGNT Daily Forecast
🔍 Analysis Approach:
I’m applying Smart Money Concepts, focusing on:
Identifying Points of Interest on the Higher Time Frames (HTFs) 🕰️
Using those POIs to define a clear trading range 📐
Refining those zones on Lower Time Frames (LTFs) 🔎
Waiting for a Break of Structure (BoS) for confirmation ✅
This method allows me to stay precise, disciplined, and aligned with the market narrative, rather than chasing price.
💡 My Motto:
"Capital management, discipline, and consistency in your trading edge."
A positive risk-to-reward ratio, paired with a high win rate, is the backbone of any solid trading plan 📈🔐
⚠️ Losses?
They’re part of the mathematical game of trading 🎲
They don’t define you — they’re necessary, they happen, and we move forward 📊➡️
🙏 I appreciate you taking the time to review my Daily Forecast.
Stay sharp, stay consistent, and protect your capital
— FRNGT 🚀
FX:GBPUSD

EUR/USD Analysis – Potential Buy OpportunityThe EUR/USD pair may start moving upwards to fill the liquidity void left during its decline over this week.
If a 15-minute candle closes above 1.15379 or inside this Order Block , this could present a good buying opportunity, with potential for the price to continue rising toward the Liquidity void
Keep a close eye on price action and ensure proper risk management before entering any trade.
