GBPUSD: A Cautious Bullish Bias. Monday Will Give ClarityWelcome back to the Weekly Forex Forecast for the week of Aug 25 - 29th.
In this video, we will analyze the following FX market: GBPUSD
The GBPUSD has shown resiliency and strength over the last several days. It was helped las Friday by the Fed Chair Powell hinting towards a rate cut.
Buys seem to be the best way forward, based on the momentum from last week.
However, the structure is still in correction territory, and there is a chance the market may start to turn over. Low probability sells, but they are there.
Let the market tip its hand on Monday. Look for the +FVG to form on the Daily chart, and plan to take buys from it if it forms.
No selling until there is a definitive bearish BOS from current levels.
Enjoy!
May profits be upon you.
Leave any questions or comments in the comment section.
I appreciate any feedback from my viewers!
Like and/or subscribe if you want more accurate analysis.
Thank you so much!
Disclaimer:
I do not provide personal investment advice and I am not a qualified licensed investment advisor.
All information found here, including any ideas, opinions, views, predictions, forecasts, commentaries, suggestions, expressed or implied herein, are for informational, entertainment or educational purposes only and should not be construed as personal investment advice. While the information provided is believed to be accurate, it may include errors or inaccuracies.
I will not and cannot be held liable for any actions you take as a result of anything you read here.
Conduct your own due diligence, or consult a licensed financial advisor or broker before making any and all investment decisions. Any investments, trades, speculations, or decisions made on the basis of any information found on this channel, expressed or implied herein, are committed at your own risk, financial or otherwise.
GBPUSD

GBP/USD Soars Sharply: Can This Breakout Hold?Technical Analysis:
Price Pattern: GBP/USD is currently in an uptrend with strong support at 1.34300 and resistance near 1.35900.
EMA: The 34-period EMA has crossed above the 89-period EMA, indicating the strength of the uptrend.
Signal: Price has just broken through the 1.35200 resistance zone, suggesting that the strong uptrend may continue.
News:
After remarks from Fed officials at the Jackson Hole Symposium, the USD weakened, allowing GBP/USD to benefit and providing an opportunity for further gains.
Trading Strategy:
Uptrend: If price stays above 1.35200, the pair could continue rising, targeting 1.35900 and potentially 1.36500.
Support Levels: If price pulls back and holds above 1.34300, the uptrend will be further confirmed.

GBPUSDGBPUSD needs small correction and further upside.
Disclosure: We are part of Trade Nation's Influencer program and receive a monthly fee for using their TradingView charts in our analysis.

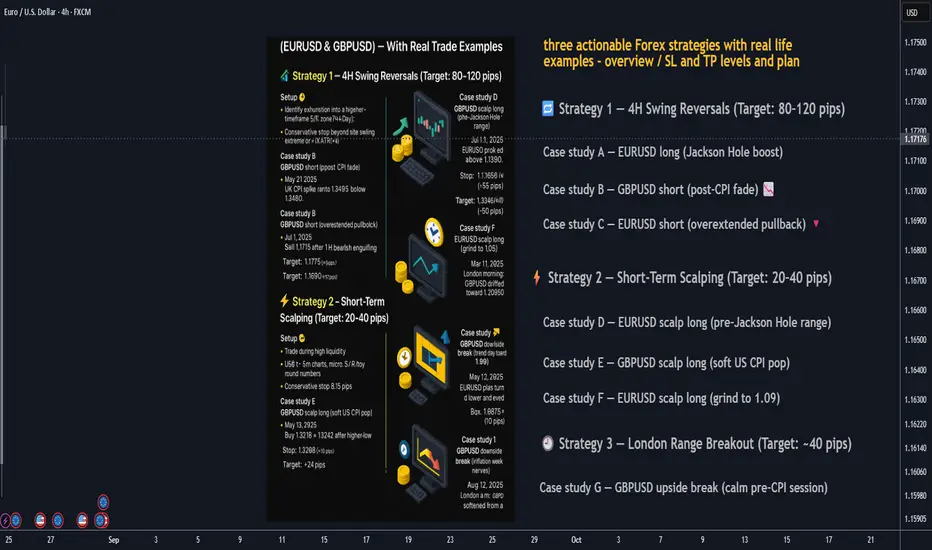
3 Actionable FX Strategies — With Real Trade Examples👋 Below are three practical strategies you can plug into your playbook today:
1. swing reversals (80+ pips), 2) short-term scalps (20–40 pips), and 3) the London range breakout (≈40 pips). Each section includes rules of engagement, risk management, and three real-market case studies on EURUSD and GBPUSD with conservative stops.
________________________________________
🔁 Strategy 1 — 4H Swing Reversals (Target: 80–120 pips)
Setup 🧩
• Identify exhaustion into a higher-timeframe S/R zone (4H/Day).
• Look for a reversal signal (engulfing/pin bar, momentum shift, or divergence) and a confirmation close.
• Conservative stop: beyond the swing extreme or ~1× ATR(14) on the entry timeframe.
• Take-profit: next HTF level or ≥ 1.8R, aiming for 80+ pips.
Case study A — EURUSD long (Jackson Hole boost) 📈
• When: Aug 22, 2025, NY session after Powell; EURUSD pushed above 1.1700 on broad USD weakness.
• Plan: After a 4H close back above 1.1700, buy a retest ~1.1705.
• Stop: 1.1650 (≈55 pips).
• Target: 1.1790 (≈85 pips).
Case study B — GBPUSD short (post-CPI fade) 📉
• When: May 21, 2025, UK CPI spike ran to 1.34695 then faded.
• Plan: After a 15–30m lower high below 1.3460, sell break of 1.3435.
• Stop: 1.3490 (≈55 pips).
• Target: 1.3345 (≈90 pips).
Case study C — EURUSD short (overextended pullback) 🔻
• When: Jul 1, 2025, EURUSD briefly poked above 1.1800 then eased.
• Plan: Sell 1.1775 after a 1H bearish engulfing.
• Stop: 1.1825 (≈50 pips).
• Target: 1.1690 (≈85 pips).
________________________________________
⚡ Strategy 2 — Short-Term Scalping (Target: 20–40 pips)
Setup 🧩
• Trade during high liquidity (London open or London/NY overlap).
• Use 1–5m charts: micro S/R + round numbers, quick momentum bursts.
• Conservative stop: 8–15 pips (just beyond the micro structure).
• Take-profit: 20–40 pips or to next intraday level.
Case study D — EURUSD scalp long (pre-Jackson Hole range) ⏱️
• When: Aug 21, 2025, Europe a.m.; EURUSD near 1.1650.
• Plan: Buy break-and-retest 1.1665.
• Stop: 1.1652 (≈13 pips).
• Target: 1.1687 (≈22 pips).
Case study E — GBPUSD scalp long (soft US CPI pop) 💥
• When: May 13, 2025, post-US CPI tone lifted risk; GBPUSD ~1.3226.
• Plan: Buy 1.3218 → 1.3242 after higher-low.
• Stop: 1.3208 (≈10 pips).
• Target: +24 pips.
Case study F — EURUSD scalp long (grind to 1.09) 🚀
• When: Mar 11, 2025, London morning; EURUSD nudged to 1.0890 / kissed 1.0900.
• Plan: Buy 1.0885 on retest.
• Stop: 1.0875 (≈10 pips).
• Target: 1.0905 (≈20 pips).
________________________________________
🕘 Strategy 3 — London Range Breakout (Target: ~40 pips)
Setup 🧩
• Mark the Asian/Late-Asia range before 08:00 London.
• Trade the first clean break/close outside the box.
• Entry: stop order beyond the box high/low.
• Conservative stop: opposite side of the box or box size + buffer (≤40–50 pips).
• Take-profit: ~40 pips (scale at 20 pips).
Case study G — GBPUSD upside break (calm pre-CPI session) 📦➡️📈
• When: Mar 25, 2025, London a.m.; GBPUSD drifted toward 1.2950.
• Box: 05:00–08:00 London ~22 pips.
• Plan: Buy box high +3 pips (≈1.2953).
• Stop: 1.2930 (≈23 pips).
• Target: 1.2993 (≈40 pips).
Case study H — EURUSD downside break (trend day toward 1.09) 📦➡️📉
• When: May 12, 2025, EURUSD bias turned lower and eyed the 1.09 handle.
• Box: 05:00–08:00 London ~28 pips.
• Plan: Sell box low −3 pips (≈1.0978).
• Stop: 1.1008 (≈30 pips).
• Target: 1.0938 (≈40 pips).
Case study I — GBPUSD downside break (inflation-week nerves) 📦➡️🔻
• When: Aug 12, 2025, London a.m.; GBPUSD softened from a two-week high.
• Box: 05:00–08:00 London ~24 pips.
• Plan: Sell box low −2 pips (≈1.3446).
• Stop: 1.3472 (≈26 pips).
• Target: 1.3406 (≈40 pips).
________________________________________
🛡️ Risk Management (applies to all three)
• Risk small per trade (e.g., 0.5–1%).
• Stops beyond structure: previous swing/box edge or ATR-based to avoid noise.
• News filter: avoid fresh entries seconds before major economic data.
________________________________________
🧰 Quick Checklists
Swing reversal (4H) ✅
🎯 Level picked • 📉 Reversal signal • 🛑 Stop beyond swing/ATR • 📐 ≥1.8R • 📰 No imminent shock
Scalp (1–5m) ✅
⏱️ Active session • 🔍 Micro S/R & round numbers • 🛑 8–15 pip stop • 🎯 20–40 pips • ✂️ Partial at +10–15
London breakout ✅
🕗 Box 05:00–08:00 • 📦 Reasonable width • 🚀 First break/close • 🛑 Stop other side • 🎯 ≈40 pips
________________________________________
⚠️ Final word
These examples show how setups map onto real market context. Adapt entries/levels to your feed and spreads. Nothing here is financial advice—test and size appropriately.
________________________________________
GBPUSD – WEEKLY FORECAST Q3 | W35 | Y25📊 GBPUSD – WEEKLY FORECAST
📈 GBP/USD Weekly Forecast – Q3 | W35 | Y25
A bullish end to the week has shaken up price action, with price closing right into our mid-range time frame POI. Initially, we’ll be watching for short setups, but caution is key — the weekly candle closing above the 50 EMA signals potential continuation to the upside.
🧠 Smart Shorts Only:
If you’re taking shorts from current highs, consider waiting for a clear 5M or 15M break of structure (BOS) to confirm price is ready to fill the daily imbalance and head toward the daily 50 EMA.
🎯 Short-Term Targets for Shorts:
Equal Lows
Daily Imbalance
Daily 50 EMA
⚠️ Manage short positions aggressively — higher time frame trend remains bullish.
📌 Key Bullish POI:
Note the daily order block left behind after the explosive move on Friday, Aug 22, 2025. Though currently sitting below the daily 50 EMA, this will be our primary long execution zone.
A wick rejection from this area would provide a solid long entry, in alignment with the HTF trend.
🧭 Game Plan:
We have a clear, clean range in play. Now it’s all about:
Waiting for a confirmed shift in structure on lower time frames
Validating the setup with confluences
Executing with precision and discipline
Let the market come to you — not the other way around.
Stay patient, stay smart, and trust the process.
— FRGNT 💼📊

GBPUSD - Long (Update)GBPUSD – BUY Setup Update
📊 H4 Timeframe Analysis by Nii_Billions
🔹 Outlook: BULLISH
Using multiple timeframe confirmation for direction.
Strategy blends technicals, fundamentals, and sentiment.
Entry, SL, and TP structured with risk management in mind.
🟢 Educational purposes only 🟢
❤️ Like & comment if this helps your trading journey.
👉 Follow for more swing trade ideas.

WEEKLY PERFORMANCE RECAPWeekly Performance Recap
Week Ending: August 22
Trades Taken: 6
Results: 3 Wins • 3 Losses
Risk Model: 3% per trade • 3RR target • Monthly compounding.
Week Outcome: +18.19% gain
Note: Any of my previous posts that were hidden were likely due to MT5 Imgur links, as confirmed by TradingView support. No promotions — just a documentation of trades and performance.

GBPUSD Will Go Higher From Support! Long!
Here is our detailed technical review for GBPUSD.
Time Frame: 3h
Current Trend: Bullish
Sentiment: Oversold (based on 7-period RSI)
Forecast: Bullish
The market is on a crucial zone of demand 1.352.
The oversold market condition in a combination with key structure gives us a relatively strong bullish signal with goal 1.359 level.
P.S
Please, note that an oversold/overbought condition can last for a long time, and therefore being oversold/overbought doesn't mean a price rally will come soon, or at all.
Disclosure: I am part of Trade Nation's Influencer program and receive a monthly fee for using their TradingView charts in my analysis.
Like and subscribe and comment my ideas if you enjoy them!

GBPUSD Faces Pressure as Dollar Strength Reasserts ControlGBPUSD has staged a corrective rally in recent sessions, but the recovery is already showing signs of fading. Price has stalled at a key resistance zone, and sellers are beginning to step back in, eyeing deeper downside. With UK fundamentals under strain and the U.S. dollar supported by resilient macro data, the path of least resistance appears tilted toward further weakness in cable.
Current Bias
Bearish – downside continuation favored as the rally runs into resistance.
Key Fundamental Drivers
U.S. dollar demand underpinned by safe-haven flows and strong macro resilience.
Bank of England dovish tilt after its recent rate cut, with policymakers cautious on growth risks.
UK growth slowdown, particularly in services and housing markets, weighing on sterling sentiment.
Trade and tariff uncertainty amplifying pressure on UK-linked assets.
Macro Context
Interest rate expectations: The Fed is expected to hold rates higher for longer, while the BoE is already cutting, increasing yield divergence against sterling.
Economic growth trends: UK economic growth remains fragile, with weak consumer demand and stagnant investment. U.S. data has been relatively stronger.
Commodity flows: Lower oil imports may give slight GBP support, but overall trade dynamics favor USD strength.
Geopolitical themes: Ongoing tariff disputes, Brexit trade adjustments, and global slowdown fears limit sterling’s upside potential.
Primary Risk to the Trend
A sudden resurgence in UK inflation or unexpectedly hawkish BoE commentary could support sterling and trigger a sharp squeeze higher.
Most Critical Upcoming News/Event
UK CPI print (key for BoE rate expectations)
U.S. PMI and Fed commentary (signals on U.S. growth and policy stance)
Leader/Lagger Dynamics
GBPUSD is often a lagger relative to EURUSD, reacting to broader USD flows rather than leading them.
The pair can influence GBP-crosses like GBPNZD, GBPJPY, and GBPCHF, particularly during UK-centric news.
Key Levels
Support Levels: 1.3424, 1.3160
Resistance Levels: 1.3590, 1.3715
Stop Loss (SL): 1.3720
Take Profit (TP): 1.3424 (first target), 1.3160 (extended target)
Summary: Bias and Watchpoints
GBPUSD remains under downside pressure, with rallies into resistance continuing to attract sellers. The bearish bias is intact, with a stop loss at 1.3720 protecting against a breakout reversal, and take-profit levels eyed at 1.3424 and 1.3160. With UK fundamentals deteriorating and U.S. data supporting dollar strength, traders should keep a close watch on upcoming UK CPI and U.S. Fed communications, as these events will likely dictate the next decisive move. Until then, the pair looks poised to extend lower.

GBPUSD: Bearish Momentum Persists Amid Weak Fundamentals ? FX:GBPUSD continues to show weakness both technically and fundamentally. The price action has shifted clearly from the previous upward channel to a clear downward structure, and sellers are still in control.
From a technical perspective, the pair has failed to hold above key resistance levels and continues to respect the descending trendline. Each retest of the upper boundary has been met with rejection. With this structure intact, the path of least resistance remains downward, targeting the next support level.
On the fundamental side, the US dollar is recovering, while the British pound faces pressure as UK economic indicators, including growth and inflation, point to a downturn. As long as these conditions persist, GBPUSD is unlikely to make a significant recovery.
Unless the descending trendline is broken with conviction, the bearish trend remains dominant, with further declines likely toward lower support zones.

GBPUSD LONGSecond trade of the day after the earlier loss. Exited at 3RR.
I had to repost this after realizing some of my previous trades were hidden from the feed. After reaching out to TradingView support, I confirmed it was due to including Imgur links for my MT5 screenshots — nothing else.
So from now on, I’ll upload charts directly through TradingView’s image system to stay fully compliant with the rules.
Just to clarify: I’ve never promoted anything or shared personal links. This is strictly a clean documentation of my trades and system performance. Nothing more.
Still following the bullish run — waited for a 5M structure shift before entering.
System remains unchanged.
Thank you if you read this to the end.


GBPUSD: Elliott Wave and H&S Pattern Is Pointing Higher Cable made a strong rebound from the 1.3135 support, suggesting the market could be bottoming, possibly completing an ABC, zigzag pattern. So, with the current break above the channel resistance line in an impulsive fashion into wave A/1, we should watch for more upside, at least in three waves, up to 1.37 area or higher.
At the moment we can see some retracement from 1.36 resistance, ideally its wave B/2 that can retrace the price back to 1.34 support area before a continuation higher within wave C or 3.
H&S pattern is also something we have to consider here; the bullish path.
GH

XAU/USD | Gold Hits Double Targets – Is Another Drop on the Way?Based on the 4-hour gold chart, we can see that the price was strongly rejected from the $3348 zone, exactly as anticipated, and dropped to $3321—successfully hitting both targets at $3334 and $3324, delivering over 250 pips of profit! Currently, gold is trading around $3328, and I expect another bearish wave to follow soon. The next downside targets are $3318, $3311, and $3301. This analysis will be updated shortly!
Please support me with your likes and comments to motivate me to share more analysis with you and share your opinion about the possible trend of this chart with me !
Best Regards , Arman Shaban

XAUUSD Short GoldGold good setup to execute short order,I see gold going even more down until 3302.
Subjected to market risks.Investors welcomed

GBPUSD LONG LOSSTook a clean loss that should have been a break-even trade. Price came within one pip of take profit while I was asleep. Break-even and TP were both set, but the WiFi disconnected during the night — so neither was executed. Woke up to the loss. That’s life. Still the same system.
MT5 screenshot in the comments

Bullish bounce off major support?GBP/USD is falling towards the pivot, which has been identified as an overlap support and could bounce to the 1st resistance, which is a pullback resistance that aligns with the 61.8% Fibonacci retracement.
Pivot: 1.3390
1st Support: 1.3270
1st Resistance: 1.3520
Risk Warning:
Trading Forex and CFDs carries a high level of risk to your capital and you should only trade with money you can afford to lose. Trading Forex and CFDs may not be suitable for all investors, so please ensure that you fully understand the risks involved and seek independent advice if necessary.
Disclaimer:
The above opinions given constitute general market commentary, and do not constitute the opinion or advice of IC Markets or any form of personal or investment advice.
Any opinions, news, research, analyses, prices, other information, or links to third-party sites contained on this website are provided on an "as-is" basis, are intended only to be informative, is not an advice nor a recommendation, nor research, or a record of our trading prices, or an offer of, or solicitation for a transaction in any financial instrument and thus should not be treated as such. The information provided does not involve any specific investment objectives, financial situation and needs of any specific person who may receive it. Please be aware, that past performance is not a reliable indicator of future performance and/or results. Past Performance or Forward-looking scenarios based upon the reasonable beliefs of the third-party provider are not a guarantee of future performance. Actual results may differ materially from those anticipated in forward-looking or past performance statements. IC Markets makes no representation or warranty and assumes no liability as to the accuracy or completeness of the information provided, nor any loss arising from any investment based on a recommendation, forecast or any information supplied by any third-party.

Fundamental Market Analysis for August 22, 2025 GBPUSDSterling is under pressure as the dollar stays resilient on expectations of cautious Fed messaging at Jackson Hole. Stronger components in recent U.S. business surveys tempered hopes for aggressive easing, while U.S. Treasury yields held above recent lows—typically a headwind for lower-yielding currencies such as GBP. The market continues to prefer U.S. domestic assets until Powell’s stance becomes clearer.
The U.K. backdrop offers limited offset: signs of softer domestic demand and a cooling labor market raise doubts about the economy’s ability to shoulder restrictive rates. Attention today also falls on government debt auctions and European business activity prints, which can indirectly affect risk sentiment and cable through broader capital flows.
With these forces intersecting, GBPUSD retains a bearish bias within today’s “stronger-dollar” narrative: yield differentials, guarded Fed expectations, and the pound’s sensitivity to global risk keep upside contained. Unless an upside surprise emerges from U.K. data or a distinctly dovish signal from the Fed, selling rallies with moderate targets remains a prudent tactical stance.
Trade recommendation: SELL 1.34000, SL 1.34500, TP 1.33100

GBPUSD – DAILY FORECAST Q3 | W34 | D22 | Y25📊 GBPUSD – DAILY FORECAST
Q3 | W34 | D22 | Y25
Daily Forecast 🔍📅
Here’s a short diagnosis of the current chart setup 🧠📈
Higher time frame order blocks have been identified — these are our patient points of interest 🎯🧭.
It’s crucial to wait for a confirmed break of structure 🧱✅ before forming a directional bias.
This keeps us disciplined and aligned with what price action is truly telling us.
📈 Risk Management Protocols
🔑 Core principles:
Max 1% risk per trade
Only execute at pre-identified levels
Use alerts, not emotion
Stick to your RR plan — minimum 1:2
🧠 You’re not paid for how many trades you take, you’re paid for how well you manage risk.
🧠 Weekly FRGNT Insight
"Trade what the market gives, not what your ego wants."
Stay mechanical. Stay focused. Let the probabilities work.
FX:GBPUSD

GBPUSD Bearish Setup – Rejection at Key Resistance (6H Chart)🧨 OANDA:GBPUSD Bearish Setup – Rejection at Key Resistance (6H Chart)
GBPUSD is showing signs of exhaustion near the 1.36000 resistance zone. A lower high and bearish engulfing candle suggest sellers are stepping in.
🔹 Trade Setup:
Sell Entry: 1.35050
Stop Loss: 1.36000
Take Profit 1: 1.34000
Take Profit 2: 1.33100
Take Profit 3: 1.31500
Risk-reward is favorable, especially if price breaks below 1.33500 with momentum. Watch for confirmation on lower timeframes.
📌 Scaling out at TP1/TP2 is advised. Invalidate the setup if price closes above 1.36000 with strength.
#GBPUSD #ForexTrading #PriceAction #FXSetup #BearishReversal #TradingView #TechnicalAnalysis #SwingTrade #6HChart #ForexStrategy
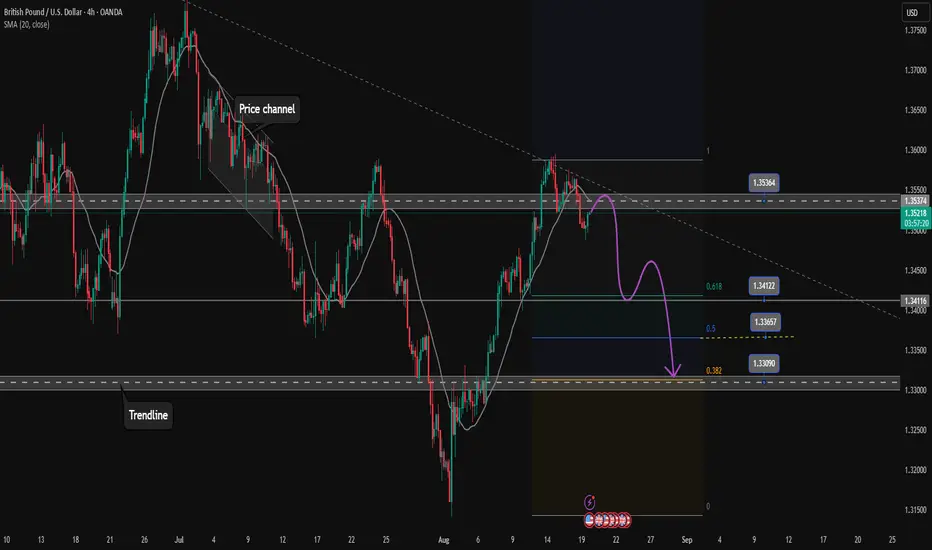
Psychology Always Matters:

The correction wave and the continuation of the GBPUSD uptrend✏️GBPUSD is forming a corrective downtrend in the long-term uptrend. The large-timeframe Trendline zone also stops the current upward momentum of this pair's price. This correction can consider Target at the Fibonacci retracement points or old Break out zones. After the correction wave ends, we can wait for a clear price reaction from the buyers to set up BUY signals towards long-term TP zones.
📉 Key Levels
SELL trigger: the buying force weakens, cannot break the trendline 1.353 and there is a price rejection from the sellers.
BUY trigger: the reaction of H4 at the support zones 1.341 -1.330 (Fibonacci retracement)
Leave your comments on the idea. I am happy to read your views.
GBPUSD: Are Sellers About To Take Control? Wait For It!Welcome back to the Weekly Forex Forecast for the week of Aug 18 - 22nd.
In this video, we will analyze the following FX market: GBPUSD
The GBPUSD has been stronger than EU, sweeping the July 24 high. With that sweep, an External Range High, price could now turn around and offer Fair Value at Internal Range Liquidity, a +FVG. That is the potential. Mindful that price is still in "supply" and should turn bearish in theory. So there is reason to look for valid sells... when they present themselves.
Enjoy!
May profits be upon you.
Leave any questions or comments in the comment section.
I appreciate any feedback from my viewers!
Like and/or subscribe if you want more accurate analysis.
Thank you so much!
Disclaimer:
I do not provide personal investment advice and I am not a qualified licensed investment advisor.
All information found here, including any ideas, opinions, views, predictions, forecasts, commentaries, suggestions, expressed or implied herein, are for informational, entertainment or educational purposes only and should not be construed as personal investment advice. While the information provided is believed to be accurate, it may include errors or inaccuracies.
I will not and cannot be held liable for any actions you take as a result of anything you read here.
Conduct your own due diligence, or consult a licensed financial advisor or broker before making any and all investment decisions. Any investments, trades, speculations, or decisions made on the basis of any information found on this channel, expressed or implied herein, are committed at your own risk, financial or otherwise.

Falling towards major support?GBP/USD is falling towards the support level, which is an overlap support that is slightly above the 50% Fibonacci retracement and could bounce from this level to our take profit.
Entry: 1.3386
Why we like it:
There is an overlap support that is slightly above the 50% Fibonacci retracement.
Stop loss: 1.3266
Why we like it:
There is a pullback support that is slightly above the 78.6% Fibonacci retracement.
Take profit: 1.3520
Why we like it:
There is a pullback resistance.
Enjoying your TradingView experience? Review us!
Please be advised that the information presented on TradingView is provided to Vantage (‘Vantage Global Limited’, ‘we’) by a third-party provider (‘Everest Fortune Group’). Please be reminded that you are solely responsible for the trading decisions on your account. There is a very high degree of risk involved in trading. Any information and/or content is intended entirely for research, educational and informational purposes only and does not constitute investment or consultation advice or investment strategy. The information is not tailored to the investment needs of any specific person and therefore does not involve a consideration of any of the investment objectives, financial situation or needs of any viewer that may receive it. Kindly also note that past performance is not a reliable indicator of future results. Actual results may differ materially from those anticipated in forward-looking or past performance statements. We assume no liability as to the accuracy or completeness of any of the information and/or content provided herein and the Company cannot be held responsible for any omission, mistake nor for any loss or damage including without limitation to any loss of profit which may arise from reliance on any information supplied by Everest Fortune Group.
