GBP/USD Price Outlook – Trade Setup📊 Technical Structure
FPMARKETS:GBPUSD GBP/USD remains under short-term pressure after failing to sustain gains above the 1.3643–1.3652 resistance zone.
Price has now retraced back toward the 1.3600–1.3610 support area, which aligns with prior demand and short-term structure support.
The pair is currently trading below the resistance band and showing lower highs on the intraday chart, suggesting fading bullish momentum.
As long as price stays below 1.3650, the short-term bias remains mildly bearish.
🎯 Trade Setup (Bearish Bias)
Entry Zone: 1.3643 – 1.3652
Stop Loss: 1.3655
Take Profit 1: 1.3610
Take Profit 2: 1.3600
Extended Target: 1.3585
Risk–Reward Ratio: Approx. 1:3.15
📌 Invalidation:
A sustained break above 1.3655 would invalidate the bearish structure and shift momentum back to the upside.
🌐 Macro Background
The British Pound remains pressured after softer UK Q4 GDP data.
Q4 GDP QoQ: 0.1% (vs 0.2% expected)
Industrial & Manufacturing Production also disappointed
This reinforces expectations of a Bank of England rate cut in March, weighing on GBP.
Meanwhile, strong US Nonfarm Payrolls data reduced expectations for a March Fed rate cut, supporting the US Dollar.
However, markets still price in at least two Fed cuts later in 2026, which may limit aggressive USD upside.
Traders now focus on US Initial Jobless Claims and Friday’s US CPI report for further direction.
🔑 Key Technical Levels
Resistance Zone: 1.3643 – 1.3652
Support Zone: 1.3601 – 1.3612
Breakdown Level: Below 1.3601
Upside Invalidation Level: Above 1.3655
📌 Trade Summary
GBP/USD is trading below resistance with weakening momentum.
Preferred strategy: Sell rallies below 1.3655, targeting a retest of 1.3600 support, while staying cautious ahead of US CPI.
⚠️ Disclaimer
This analysis is for reference only and does not constitute trading advice. Financial markets involve significant risk; proper risk and position management are essential.
Gbpusd_forecast

GBPUSD Losing Momentum Under Supply Rally Looks Tired as Dollar GBPUSD, Price pushed hard earlier, but the structure on this 4H chart now looks more like distribution than continuation. We’ve got repeated rejection near the upper resistance band, a series of lower highs forming, and a wedge-style breakdown attempt underway. From a macro angle, the pound is no longer getting clean support from rate expectations, while the dollar is still backed by relatively firmer US data and sticky inflation signals. That combination makes rallies vulnerable unless the next data wave clearly weakens the USD.
Current Bias
Short-term bearish to neutral-bearish.
Structure shows fading bullish momentum and a shift toward lower highs after rejection from the 1.3730–1.3870 supply zone.
Key Fundamental Drivers
US data mix still favors the dollar relative to peers, especially in services and inflation components.
Fed rate-cut expectations are being trimmed back to a slower path rather than aggressive easing.
UK growth remains soft, and while inflation has cooled from peaks, it is not translating into strong GBP demand.
BoE tone is cautious, with markets leaning toward eventual easing rather than further tightening.
Net effect: yield spread and growth stability still tilt mildly toward USD over GBP.
Macro Context
Interest Rates: Fed is in a cautious hold-to-slow-cut stance based on recent macro signals. BoE is also cautious but with weaker growth backing sterling.
Growth Trends: US growth indicators are holding up better than UK and euro area equivalents. UK activity data remains uneven.
Inflation: US inflation remains sticky enough to delay fast easing. UK inflation is lower than peak but not a strong GBP catalyst.
Risk Sentiment: Broad risk tone is mixed, not strongly supportive for high-beta FX.
Geopolitics: Ongoing geopolitical tensions keep a mild safe-haven bid under USD during stress windows.
Primary Risk to the Trend
A sharp downside surprise in US inflation or labor data that forces markets to rapidly price earlier Fed cuts. That would weaken the dollar broadly and invalidate the bearish GBPUSD bias.
Most Critical Upcoming News/Event
Next US CPI / core inflation release and nearby Fed speaker guidance.
On the UK side, CPI and wage data are key for shifting BoE expectations.
Leader/Lagger Dynamics
GBPUSD is typically a lagger to EURUSD and US yield moves rather than a primary leader.
It often follows:
EURUSD direction for broad USD flow
US 2Y–10Y yield moves
DXY trend shifts
If EURUSD rolls over, GBPUSD usually extends lower with higher beta.
Key Levels
Support Levels:
1.3510
1.3400
1.3340 zone (deeper structural support)
Resistance Levels:
1.3730–1.3750
1.3870 major supply high
Stop Loss (SL):
Above 1.3750 for bearish continuation structure
Take Profit (TP):
1.3510 first objective
1.3400 secondary objective
Summary: Bias and Watchpoints
The bias on GBPUSD is tilted bearish in the short term after repeated rejection from the upper resistance band and a shift into lower-high structure. Fundamentals lean slightly toward the dollar, supported by relatively stronger US activity and a slower Fed easing path compared with the BoE outlook. The main threat to this view is a soft US inflation shock that reprices rate cuts faster and weakens USD across the board. The most important catalysts ahead are US CPI and Fed communication, followed by UK inflation and wage data. GBPUSD usually follows broader USD and EURUSD direction rather than leading it, so keep one eye on those drivers while trading the levels around 1.3730 resistance and 1.3510 to 1.3400 support.

GBPUSD ANALYSIS [READ CAPTION]📊 Market Analysis – EUR/USD Resistance Test & Potential Reversal
EUR/USD is currently testing a key resistance area, with price action showing hesitation near critical levels. The market is at a decision point, where either a breakout or a reversal may define the next short-term trend.
🔴 Key Resistance Levels
Primary Resistance: 1.37055
This is the main barrier where sellers are likely to defend aggressively. A rejection from this level could trigger a downward retracement.
Secondary Resistance: 1.36831
Acts as near-term resistance within the immediate price zone. Price currently hovers just above this level, indicating pressure to break higher.
🟢 Key Support Levels
Immediate Support: 1.36658
This is the short-term target point just below resistance. Price may pause here before attempting further upside or testing the lower support.
Strong Support: 1.36010
A major support level where buyers are expected to step in. A reaction from this level could slow or reverse any short-term decline.
🔄 Pattern Insight
The “ATD” pattern signals a potential downward trend reversal if resistance at 1.37055 is not breached. Price needs to close above the primary resistance convincingly to validate any upward momentum; otherwise, a pullback toward the support zone is likely
📌 Summary
EUR/USD is facing key resistance near 1.37055. Traders should watch for either a breakout to confirm bullish momentum or a reversal from resistance that could bring price back toward strong support at 1.36010.

GBPUSD - Price Retesting The Old Resistance Zone Now A SupportPrice has broken out of a long‑term downtrend channel and is now retesting the old resistance zone around 1.36–1.37 as new support (“structure”).
If this zone holds and price makes bullish candles from it, the idea is to look for buy (long) setups targeting higher prices, because previous resistance often turns into support after a clean breakout and retest

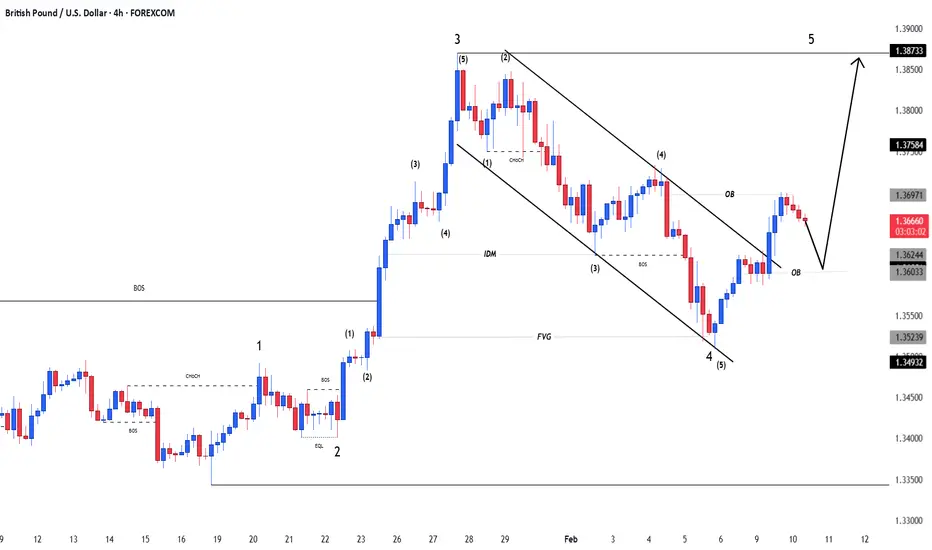
GBPUSDGBPUSD
- Bearish Channel as an corrective pattern in Short Time Frame
- IDM
- Fair Value Gap
- Completed " 1234 " Impulsive Waves
- Order Block
GBP/USD Price Outlook – Trade Setup📊 Technical Structure
FPMARKETS:GBPUSD GBP/USD has rebounded strongly from the 1.3590–1.3696 support zone, forming a sequence of higher lows on the 1H chart. Price is now consolidating above former intraday resistance and holding firmly above the support band, suggesting that bullish momentum remains intact. As long as the pair holds above the 1.3590 support area, the structure favours a continuation move higher toward the upper resistance zone.
🎯 Trade Setup (Bullish)
Entry Zone: 1.3590 – 1.3596
Stop Loss: 1.3585
Take Profit 1: 1.3647
Take Profit 2: 1.3653
Risk–Reward (R:R): Approximately 1 : 5.07
📌 Invalidation:
This bullish setup is invalidated if price breaks and closes below 1.3585.
🌐 Macro Background
From a fundamental perspective, GBP/USD remains supported by medium-term bullish structure, despite near-term pressure from expectations of a Bank of England rate cut. While the Pound has softened following a less-hawkish BoE stance, the US Dollar has failed to regain strong upside traction, allowing GBP/USD to stabilize above key technical support. Overall, macro conditions currently favor consolidation with upside potential rather than aggressive downside follow-through.
🔑 Key Technical Levels
Resistance Zone: 1.3647 – 1.3653
Support Zone: 1.3596 – 1.3690
Bullish Invalidation Level: Below 1.3585
📌 Trade Summary
GBP/USD maintains a constructive bullish structure above the 1.3590 support zone. Pullbacks into support are viewed as buying opportunities, with the pair likely to retest the 1.3647–1.3653 resistance area as long as downside breaks remain limited.
⚠️ Disclaimer
This analysis is for reference only and does not constitute trading advice. Financial markets involve significant risk; proper risk and position management are essential.

Simple Sell GUI IdeaGU is selling Pressure on 4h still in Premium zone
15m is also align with 4h
gives a fractal shift

GBPUSD: Intraday Buying Setup 04/02/2026The FX:GBPUSD pair dropped after the DXY reversed to bullish. Since the start of this week, the price has been declining. We’ve identified a potential buying zone where we believe the price will likely move. Once the price reaches our marked ‘point of interest’ the trade will activate and you can set a stop loss based on your analysis and risk management.
If you agree with our work, please comment below.
Team Setupsfx_

GBPUSD— FRGNT FUN COUPON FRIDAY Q1 | D6 | W5 | Y26📅 Q1 | D6 | W5 | Y26
📊 GBPUSD— FRGNT FUN COUPON FRIDAY
🔍 Analysis Approach
I’m applying a developed version of Smart Money Concepts, with a structured focus on:
• Identifying Key Points of Interest (POIs) on Higher Time Frames (HTFs) 🕰️
• Using those POIs to define a clear and controlled trading range 📐
• Refining those zones on Lower Time Frames (LTFs) 🔎
• Waiting for a Break of Structure (BoS) as confirmation ✅
This process keeps me precise, disciplined, and aligned with market narrative, rather than reacting emotionally or chasing price.
💡 My Motto
“Capital management, discipline, and consistency in your trading edge.”
A positive risk-to-reward ratio, combined with a high-probability execution model, is the backbone of any sustainable trading plan 📈🔐
⚠️ On Losses
Losses are part of the mathematical reality of trading 🎲
They don’t define you — they are necessary, expected, and managed.
We acknowledge them, learn, and move forward 📊➡️
🙏 I appreciate you taking the time to review my Daily Forecast.
Further context and supporting material can be found in the Links section.
Stay sharp 🧠
Stay consistent 🎯
Protect your capital 🔐
— FRGNT 🚀📈
FX:GBPUSD

GBP/USD 4H MARKT ANALYSIS BEARISH PRESSURE BUILDINGMarket Structure
Price previously made a strong bullish move and created a higher high near 1.38 area.
After that, market showed rejection from the supply zone (top orange zone) and started dropping.
Currently price is approaching a mid support / demand zone around 1.3530 – 1.3500.
🔍 Current Price Behavior
Strong bearish candles show momentum shifting downward.
Price is now testing support. This is a decision area:
Either bounce from support
Or break and continue bearish trend
📉 Bearish Scenario (Your chart projection)
If price:
Breaks and closes below 1.3500 support 👉 Next possible target:
1.3400
Then strong support around 1.3330 zone
Trend bias = Bearish while price stays below 1.3600

GBPUSD: Intraday Trading Idea Possible Sell Worth 250+ PipsDear Traders,
I hope you’re doing well. We’re seeing strong selling pressure at the current price range and believe the price could drop around 1.3500, a 250+ pip move. We’re waiting for a strong bearish candle to close to confirm the bearish drop.
If you like our work, please like and comment. Follow us for more.
Team Setupsfx_

GBP/USD BULLISH PROFESSIONAL CHART ANALYSISEntry Context
Current area 1.3640 – 1.3650 = demand + structure support
Valid long only if:
Price holds above 1.3640
No strong bearish BOS on 15M
If this level holds → upside continuation favored.
🎯 Targets
TP1: 1.3685 – 1.3690
(Internal range high / first supply)
Final Target: 1.3760 – 1.3795
(Major imbalance + EQH liquidity)
This matches your projected path perfectly.
🚨 Invalidation
Clean 45M close below 1.3635
Bearish BOS below the strong low
If that happens → bullish idea is off, expect range continuation.
🧾 Summary
📈 Bias (LTF): Bullish
🧠 HTF: Range / corrective phase
🎯 Liquidity target: Buy-side above
⚠️ Trade type: Pullback continuation

#GBP/USD Sell Trade Scenario.Here’s an up-to-date GBP/USD Sell trade outlook (technical + fundamental) to help you assess whether positioning for a Downside makes sense right now.
Thank You......

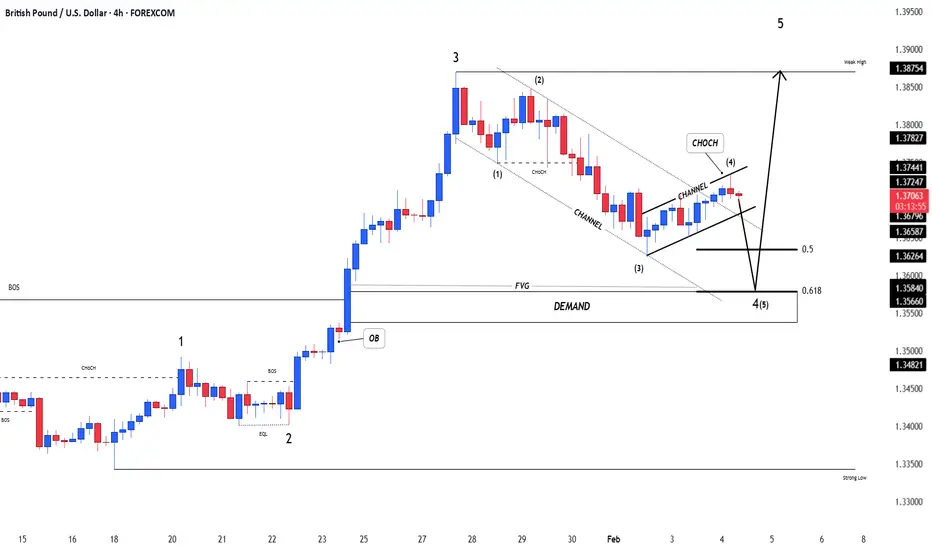
GBPUSDGBPUSD
- Fair Value Gap
- Bullish Channel as an corrective pattern in Short Time Frame and Bearish Channel in Long Time Frame
- Demand Zone
- Fibonacci Level - 50.00% / 61.80%
- Completed " 123 " Impulsive Waves
time to buy GBPUSD nowGBPUSD was in a recent downtrend for the last few weeks and struggled to stay bullish, but recently it has just broken a strong resistance trend line which it tested several times and failed to break through. GBPUSD is very likely to hit the next major resistance zone which is marked as the "TAKE PROFIT" LEVEL. There are many clear signs of new bullish movements. Time to Buy GBPUSD now.

EURGBP | FRGNT WEEKLY FORECAST | Q1 | W5 | Y26📅 Q1 | W5 | Y26
📊 EURGBP— FRGNT WEEKLY FORECAST
🔍 Analysis Approach
I’m applying a developed version of Smart Money Concepts, with a structured focus on:
• Identifying Key Points of Interest (POIs) on Higher Time Frames (HTFs) 🕰️
• Using those POIs to define a clear and controlled trading range 📐
• Refining those zones on Lower Time Frames (LTFs) 🔎
• Waiting for a Break of Structure (BoS) as confirmation ✅
This process keeps me precise, disciplined, and aligned with market narrative, rather than reacting emotionally or chasing price.
💡 My Motto
“Capital management, discipline, and consistency in your trading edge.”
A positive risk-to-reward ratio, combined with a high-probability execution model, is the backbone of any sustainable trading plan 📈🔐
⚠️ On Losses
Losses are part of the mathematical reality of trading 🎲
They don’t define you — they are necessary, expected, and managed.
We acknowledge them, learn, and move forward 📊➡️
🙏 I appreciate you taking the time to review my Daily Forecast.
Further context and supporting material can be found in the Links section.
Stay sharp 🧠
Stay consistent 🎯
Protect your capital 🔐
— FRGNT 🚀📈
FX:EURGBP

#GBPUSD: Previous Entry Invalidated,Next We Wait For Price! Our previous GBPUSD entry was invalidated as the pound declined while the DXY turned bearish. However, our view remains bullish on GBPUSD and the price is likely to reverse from our new entry area. Once the price enters the discounted zone we can then wait for it to reach one of our target or take-profit levels. This week’s NFP data is likely to affect our trade and could invalidate our entry if it is positive for the DXY.
Best wishes and safe trading.
Team Setupsfx

GBPUSD: Highly Probable +1400 Pips Trading Setup! Dear Traders,
📌GBPUSD has shown strong bullish momentum, with price action indicating upward pushes. However, caution is advised as temporary pullbacks are possible before sustained rallies resume. The pair’s movement is influenced by the US Dollar Index (DXY), which is showing signs of potential weakness. This supports the bullish outlook for GBPUSD.
📌Currently, the pair is in a bullish trend with temporary corrective dips expected. There’s a safe entry area for buyers around the ‘blue marked’ arrow. Three profit targets are marked, each for partial or full profit-taking. Avoid early entries near the ‘red marked’ arrow area, as it carries higher risk. Instead, prefer entries after the price breaks above the trend line, confirms liquidity absorption, and retests the breakout zone.
📌Furthermore, the US Dollar Index (DXY) is likely to decline due to upcoming economic data and market sentiment, which will favour GBP strength. The UK economic outlook is positive, supporting Sterling’s resilience. However, US economic uncertainty, with slowing growth and potential interest rate adjustments, may further pressure the dollar.
📌Finally, wait for the price to revisit the ‘blue marked’ support for a safer entry opportunity. Enter long positions after the trend line breaks and retests confirmation. Aim for the three defined targets, scaling out positions progressively. Maintain disciplined risk management throughout.
If you enjoy our work, please like and comment on the post. Your support means the world to us and encourages us to share more educational trading setups. If you’d like us to analyse any other trading plans, please comment below, and we’ll analyse them as soon as possible. 📊❤️
⚠️Disclaimer⚠️
This is not financial advice and is only for educational purposes. Please do your own research and make decisions based on your own knowledge and chart analysis. Financial markets can lead to serious losses, so have a thorough trading plan and risk management strategy.
Thank you❤️
Team Setupsfx_

#GBPUSD: +910 PIPS Buying Setup! Swing Setup! GBPUSD broken through the bearish trend line liquidity now we think price is likely to continue uptrend with around 910+ pips swing buying setup. We also have important news coming up this week so be careful while trading also use accurate risk management while trading.
Good luck and trade safe!
Team Setupsfx_

#GBPUSD: Three Targets Swing Buy 720+ Pips Move **Trading Setup For GBPUSD 1 Daily Time Frame**
🔺After a while where the price was mostly down, it hit a low of 1.30 but then turned around. Since then, it has been climbing steadily, with little dips that have only made it go higher. Right now, it is at 1.3490, which we think is a good time to start a long position in GBPUSD.
🔺Trading at the current price is a smart move because the price is up, which helps keep our risk in check and makes the trade more likely to succeed. We can put a stop-loss order below the blue line we marked.
🔺To make some money, we have set three goals. First, we aim for 1.3657, which is a big wall that the price needs to get over. Once it does, we can look at the second goal, which is 1.42. We will keep doing the same thing until we reach our final goal of 1.42.
🔺We would love for you to like and comment on our analysis, as it helps us make more content. Thanks so much for your support!
Sincerely,
Team SetupsFX_🏆❤️

GBP/USD Price Outlook – Trade Setup📊 Technical Structure
FPMARKETS:GBPUSD GBP/USD is rebounding from the 1.3810–1.3820 support zone, which aligns with prior demand and the lower boundary of the recent consolidation structure. Price has reclaimed short-term momentum after holding above support, suggesting buyers are defending this area.
The broader structure shows a higher low formation, while price is now pushing back toward the 1.3870–1.3880 resistance zone, where previous supply capped upside moves. As long as price remains above the support zone, the near-term bias favors further upside continuation.
🎯 Trade Setup (Bullish Bias)
Entry Zone: 1.3810 – 1.3820
Stop Loss: 1.3800
Take Profit 1: 1.3842
Take Profit 2: 1.3870 – 1.3880
Risk–Reward Ratio: Approx. 1 : 2.89
❌ Invalidation
A decisive break and sustained close below 1.3800 would invalidate the bullish setup and signal renewed downside risk.
🌐 Macro Background
GBP/USD remains supported near multi-year highs as the US Dollar stays under pressure following the Federal Reserve’s neutral rate hold and ongoing uncertainty surrounding future Fed leadership. While the Fed offered no clear dovish signal, markets continue to price in medium-term USD softness amid political and policy uncertainty.
In this environment, Sterling strength remains intact, allowing GBP/USD to stay bid as long as key technical support holds.
🔑 Key Technical Levels
Resistance Zone: 1.3870 – 1.3880
Support Zone: 1.3810 – 1.3820
Bullish Invalidation: Below 1.3800
📌 Trade Summary
GBP/USD is holding above a well-defined support zone and showing signs of continuation toward the upper resistance band. As long as price stays above 1.3810, dips are viewed as buy-the-pullback opportunities, targeting 1.3870–1.3880.
⚠️ Disclaimer
This analysis is for reference only and does not constitute trading advice. Financial markets involve significant risk; proper risk and position management are essential.

GBPUSD:Intraday Trading Setup 250+ Pips MoveDear Traders,
GBPUSD showed us the change of character has occurred and now it also has retested the price zone, now it is likely to be heading towards 1.3700 area which in our view is likely to be a next target for GBPUSD. According to the fib placement we can see price reversing from 0.618 point. As stated in the chart that there is only one swing target and stop loss can be placed based on your risk management.
Good luck and thanks for the support throughout these years, also like and comment for more such analysis.
Regards,
Team Setupsfx_

GBP/USD SWING BEARISH SETUPMarket Structure
Overall structure is bullish, driven by a strong impulsive move from ~1.3450.
Price is moving inside a steep ascending channel.
Momentum is slowing near the channel top, signaling possible exhaustion.
Trend & Price Action
Recent candles show small bodies and upper wicks near the high.
This indicates:
Buying pressure weakening
Sellers starting to step in near resistance
This supports the short-term bearish correction idea drawn on the chart.
🔴 Resistance Zone
Key resistance: 1.3700 – 1.3720
This area aligns with:
Psychological round number (1.3700)
Upper channel boundary
Recent impulsive high
Rejection here is technically logical.
🎯 Targets
1️⃣ First Target
1.3650 – 1.3660
Confluence with:
Minor horizontal support
Upper edge of the Ichimoku cloud
2️⃣ Final Target
1.3550 – 1.3580
Strong support zone:
Cloud support
Prior consolidation area
Healthy retracement within bullish trend
