GBPUSD Rising Suport Ahead!
HI,Traders !
#GBPUSD is about to retest
The rising support while
Trading in an uptrend so
I am bullish biased and
I think that we will see
A local bullish rebound !
Comment and subscribe to help us grow !
Gbpusdanalysis

GBPUSD Setting Up for ContinuationGBPUSD remains firmly supported above its recent impulse move and continues to respect the bullish structure on the 4H timeframe. Price has shifted into a controlled consolidation, with shallow pullbacks and consistent buyer response — matching the projected continuation path marked on the chart.
This type of behaviour reflects absorption rather than weakness, suggesting that larger participants are maintaining positions while liquidity rebuilds. The absence of aggressive selling further supports the idea of a potential next leg higher.
If this structure holds, the pair may attempt to extend in line with the broader trend as momentum rebuilds. Patience and confirmation remain key in this phase.
Disclosure: We are part of Trade Nation's Influencer program and receive a monthly fee for using their TradingView charts in our analysis.

GBPUSD: Bearish Drop to 1.334?FX:GBPUSD is eyeing a bearish reversal on the 4-hour chart , with price testing resistance after recent highs in an upward trendline from June 2025, converging with a potential entry zone that could spark downside momentum if sellers defend amid volatility. This setup suggests a pullback opportunity post-rally, targeting lower support levels with more than 1:2 risk-reward .🔥
Entry between 1.3566–1.3586 for a short position. Target at 1.3341 . Set a stop loss at a close above 1.3664 , yielding a risk-reward ratio of more than 1:2 . Monitor for confirmation via a bearish candle close below entry with rising volume, leveraging the pair's dynamics near resistance.🌟
Fundamentally , GBPUSD is trading around 1.357 in early February 2026, with key events this week. For the US Dollar, Nonfarm Payrolls (Jan, forecast 50K) on February 6 at 1:30 PM UTC, the week's highlight—weak data could favor GBP upside. 💡
📝 Trade Setup
🎯 Entry (Short):
1.3566 – 1.3586
(Entry from current price is valid with proper risk & position sizing.)
🎯 Target:
• 1.3341
❌ Stop Loss:
• Close above 1.3664
⚖️ Risk-to-Reward:
• > 1:2
💡 Your view?
Is this the start of a healthy pullback toward 1.3340, or will GBP bulls push through resistance and extend the rally? 👇

DeGRAM | GBPUSD formed the bearish takeover📊 Technical Analysis
● The price is breaking down from a rising wedge, confirming the bearish bias as it faces strong resistance at the upper boundary.
● The next downside targets are at 1.36200 and 1.36111. If these levels break, further downside towards the support at 1.35577 is expected.
💡 Fundamental Analysis
● Strong USD momentum and risk-off sentiment favor further downside pressure on GBP/USD, especially if economic data continues to support the US dollar.
✨ Summary
● Bearish breakout confirmed.
● Key levels to watch: 1.36200 → 1.36111 → 1.35577 for potential shorts.
-------------------
Share your opinion in the comments and support the idea with a like. Thanks for your support!

GBP/USD Declines After Bank of England DecisionGBP/USD Declines After Bank of England Decision
Yesterday’s decision by the Bank of England came as a surprise to forex traders. While the Official Bank Rate was left unchanged at 3.75%, markets were caught off guard by the notably dovish signals regarding future policy.
According to media reports, four out of nine Monetary Policy Committee members voted for an immediate rate cut. This has brought forward expectations of easing by the Bank of England, making the pound less attractive to hold and triggering its weakness yesterday.
Technical Analysis of GBP/USD
Price action in GBP/USD has been forming an upward trend (outlined by a channel) since November last year. However, yesterday’s move has put this channel at risk of a downside break.
It is worth noting that the market had only recently been in a very strong bullish phase. GBP/USD was advancing along the blue support line and even pushed above the upper boundary of the ascending channel.
Sentiment then shifted abruptly. Bears stepped in aggressively, driving the pair lower and breaking through several technical levels in sequence:
→ the blue trendline;
→ the upper boundary of the channel;
→ the channel median, reinforced by the 1.3640 level.
As a result, the price fell towards the lower boundary of the channel, strengthened by the 1.3530 level, which had acted as resistance in late December and early January.
Almost all of the bullish gains made in late January have now been erased. It cannot be ruled out that today’s rebound in GBP/USD is merely a technical recovery — a pause that allows bears to regroup before attempting a break below the lower boundary of the ascending channel, potentially steering the market into a downward trajectory (shown in red).
This article represents the opinion of the Companies operating under the FXOpen brand only. It is not to be construed as an offer, solicitation, or recommendation with respect to products and services provided by the Companies operating under the FXOpen brand, nor is it to be considered financial advice.

GBP/USD 4H MARKT ANALYSIS BEARISH PRESSURE BUILDINGMarket Structure
Price previously made a strong bullish move and created a higher high near 1.38 area.
After that, market showed rejection from the supply zone (top orange zone) and started dropping.
Currently price is approaching a mid support / demand zone around 1.3530 – 1.3500.
🔍 Current Price Behavior
Strong bearish candles show momentum shifting downward.
Price is now testing support. This is a decision area:
Either bounce from support
Or break and continue bearish trend
📉 Bearish Scenario (Your chart projection)
If price:
Breaks and closes below 1.3500 support 👉 Next possible target:
1.3400
Then strong support around 1.3330 zone
Trend bias = Bearish while price stays below 1.3600

GBPUSD: Intraday Trading Idea Possible Sell Worth 250+ PipsDear Traders,
I hope you’re doing well. We’re seeing strong selling pressure at the current price range and believe the price could drop around 1.3500, a 250+ pip move. We’re waiting for a strong bearish candle to close to confirm the bearish drop.
If you like our work, please like and comment. Follow us for more.
Team Setupsfx_

GBPUSD and EURUSD Analysis todayHello traders, this is a complete multiple timeframe analysis of this pair. We see could find significant trading opportunities as per analysis upon price action confirmation we may take this trade. Smash the like button if you find value in this analysis and drop a comment if you have any questions or let me know which pair to cover in my next analysis.

GBP/USD BULLISH PROFESSIONAL CHART ANALYSISEntry Context
Current area 1.3640 – 1.3650 = demand + structure support
Valid long only if:
Price holds above 1.3640
No strong bearish BOS on 15M
If this level holds → upside continuation favored.
🎯 Targets
TP1: 1.3685 – 1.3690
(Internal range high / first supply)
Final Target: 1.3760 – 1.3795
(Major imbalance + EQH liquidity)
This matches your projected path perfectly.
🚨 Invalidation
Clean 45M close below 1.3635
Bearish BOS below the strong low
If that happens → bullish idea is off, expect range continuation.
🧾 Summary
📈 Bias (LTF): Bullish
🧠 HTF: Range / corrective phase
🎯 Liquidity target: Buy-side above
⚠️ Trade type: Pullback continuation

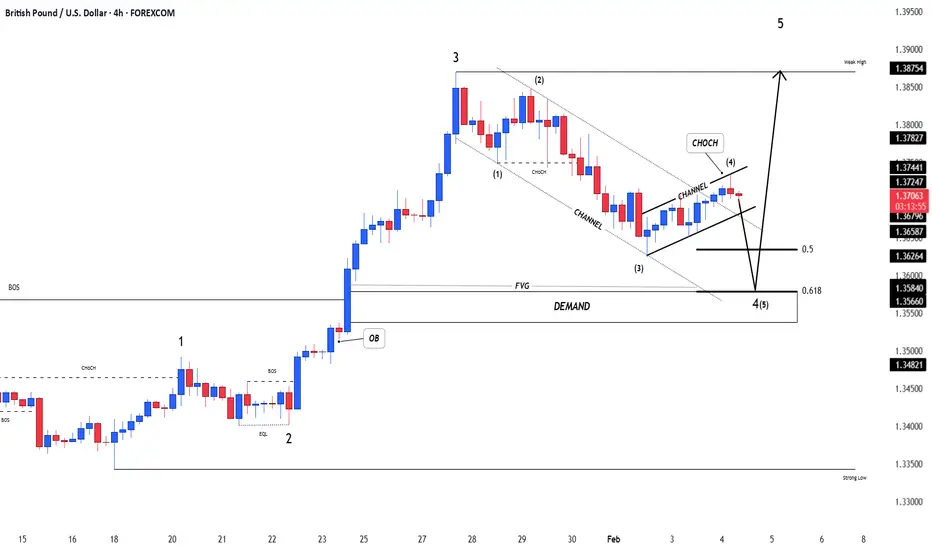
GBPUSDGBPUSD
- Fair Value Gap
- Bullish Channel as an corrective pattern in Short Time Frame and Bearish Channel in Long Time Frame
- Demand Zone
- Fibonacci Level - 50.00% / 61.80%
- Completed " 123 " Impulsive Waves
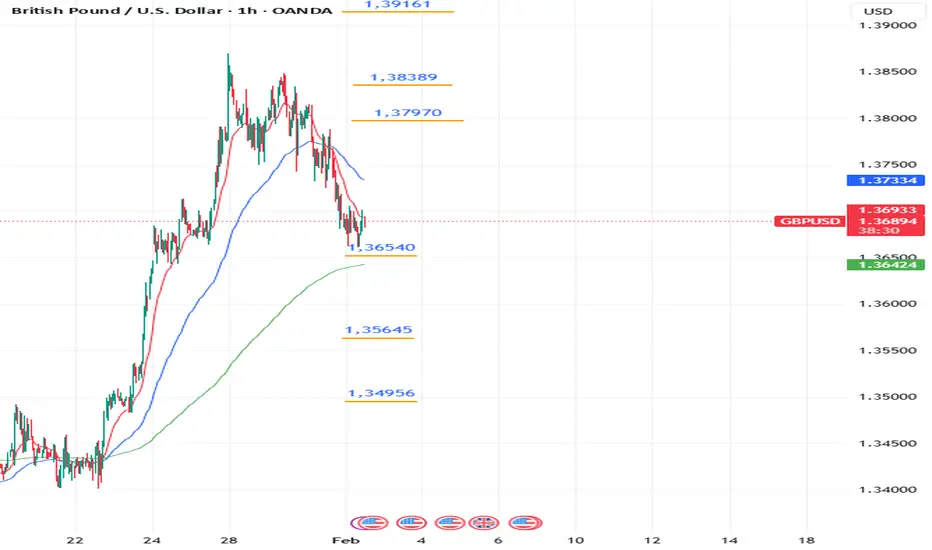
Coinranger|GBPUSD. Potential return to growth🔹DXY has made its first wave up. The potential of a move is still up to 97.43, but we could already be starting to reverse.
🔹Manufacturing PMI (18:00 UTC+3) and budget funding vote today
🔹The earnings season continues in the US
Levels:
Above
1.39161 - first upward extension
1.38389 - full set up
1.37970 - first upward wave
Below
1.36540 - full set down
1.35645 - first downward extension
1.34956 - second downward extension
The situation is still unclear. While the PMI most likely will influence the trend, it's difficult to say how the pice will react on the vote. Let's watch the US session.
---------------
Share your thoughts in the comments!
GBPUSD — FRGNT DAILY FORECAST Q1 | D4 | W5 | Y26📅 Q1 | D4 | W5 | Y26
📊 GBPUSD — FRGNT DAILY FORECAST
🔍 Analysis Approach
I’m applying a developed version of Smart Money Concepts, with a structured focus on:
• Identifying Key Points of Interest (POIs) on Higher Time Frames (HTFs) 🕰️
• Using those POIs to define a clear and controlled trading range 📐
• Refining those zones on Lower Time Frames (LTFs) 🔎
• Waiting for a Break of Structure (BoS) as confirmation ✅
This process keeps me precise, disciplined, and aligned with market narrative, rather than reacting emotionally or chasing price.
💡 My Motto
“Capital management, discipline, and consistency in your trading edge.”
A positive risk-to-reward ratio, combined with a high-probability execution model, is the backbone of any sustainable trading plan 📈🔐
⚠️ On Losses
Losses are part of the mathematical reality of trading 🎲
They don’t define you — they are necessary, expected, and managed.
We acknowledge them, learn, and move forward 📊➡️
🙏 I appreciate you taking the time to review my Daily Forecast.
Further context and supporting material can be found in the Links section.
Stay sharp 🧠
Stay consistent 🎯
Protect your capital 🔐
— FRGNT 🚀📈
FX:GBPUSD

GBP/USD – Fundamental Drive in Play (30.01.2026)📝 Description 🔍 Setup (Market + Fundamentals) FX:GBPUSD
GBP/USD has rallied strongly but is now facing heavy selling pressure at a well-defined resistance zone. Multiple rejections from the same supply area signal buyer exhaustion.
On the fundamental side, USD strength is supported by:
1.New Fed leadership announcement
2.Political agreement to avoid a US government shutdown, reducing uncertainty and favoring the dollar
Technically, price is breaking below the rising trendline, with EMA & Ichimoku losing bullish momentum.
📍 Support & Resistance
🟨 Resistance Zone: 1.3825 – 1.3865
🟥 1st Support: 1.3600
🟥 2nd Support: 1.3500
Volume profile supports downside liquidity below current price
⚠️ Disclaimer
This analysis is for educational purposes only.
Forex trading involves risk — always use proper risk management and trade responsibly.
💬 Support the Idea 👍 Like if you see GBP/USD turning bearish
💬 Comment: Sell from resistance or wait for deeper confirmation?
🔁 Share with traders watching USD fundamentals
#GBPUSD #ForexTrading #FundamentalAnalysis #PriceAction #ResistanceZone #USDStrength #TradingView #Kabhi_TA_Trading

DeGRAM | GPBUSD keep a descending structure📊 Technical Analysis
● GBP/USD continues to trade inside a well-defined descending channel, with price repeatedly rejecting the upper resistance line. The latest rebound stalled below 1.3720, confirming sellers’ control and weak bullish follow-through.
● Failure to reclaim the broken support near 1.3680 keeps downside pressure active, with price action favoring continuation toward the 1.3640–1.3620 support zone, aligned with prior lows and channel structure.
💡 Fundamental Analysis
● Persistent USD strength, supported by firm US economic data and cautious risk sentiment, limits GBP recovery in the short term.
✨ Summary
● Bearish structure remains intact below 1.3720.
● Short-term downside toward 1.3640–1.3620 is favored while price stays capped by resistance.
-------------------
Share your opinion in the comments and support the idea with a like. Thanks for your support!

GBPUSD — FRGNT DAILY FORECAST Q1 | D3 | W5 | Y26
📅 Q1 | D3 | W5 | Y26
📊 GBPUSD — FRGNT DAILY FORECAST
🔍 Analysis Approach
I’m applying a developed version of Smart Money Concepts, with a structured focus on:
• Identifying Key Points of Interest (POIs) on Higher Time Frames (HTFs) 🕰️
• Using those POIs to define a clear and controlled trading range 📐
• Refining those zones on Lower Time Frames (LTFs) 🔎
• Waiting for a Break of Structure (BoS) as confirmation ✅
This process keeps me precise, disciplined, and aligned with market narrative, rather than reacting emotionally or chasing price.
💡 My Motto
“Capital management, discipline, and consistency in your trading edge.”
A positive risk-to-reward ratio, combined with a high-probability execution model, is the backbone of any sustainable trading plan 📈🔐
⚠️ On Losses
Losses are part of the mathematical reality of trading 🎲
They don’t define you — they are necessary, expected, and managed.
We acknowledge them, learn, and move forward 📊➡️
🙏 I appreciate you taking the time to review my Daily Forecast.
Further context and supporting material can be found in the Links section.
Stay sharp 🧠
Stay consistent 🎯
Protect your capital 🔐
— FRGNT 🚀📈
FX:GBPUSD

GBPUSDGBP is less attractive for long setups, as major liquidity pools on the monthly timeframe have already been taken. We need to see whether selling pressure will persist. For now, the plan is continuation of the bullish 1W OF and 1D OF via a pullback into the discount range.

time to buy GBPUSD nowGBPUSD was in a recent downtrend for the last few weeks and struggled to stay bullish, but recently it has just broken a strong resistance trend line which it tested several times and failed to break through. GBPUSD is very likely to hit the next major resistance zone which is marked as the "TAKE PROFIT" LEVEL. There are many clear signs of new bullish movements. Time to Buy GBPUSD now.

Market Analysis: GBP/USD Retreats From HighsMarket Analysis: GBP/USD Retreats From Highs
GBP/USD is showing positive signs above 1.3580 and 1.3620.
Important Takeaways for GBP/USD Analysis Today
- The British Pound rallied above 1.3700 and 1.3800 before there was a pullback.
- There is a connecting bearish trend line forming with resistance at 1.3760 on the hourly chart of GBP/USD.
GBP/USD Technical Analysis
On the hourly chart of GBP/USD, the pair remained well-bid above 1.3500. The British Pound started a decent increase above 1.3650 against the US Dollar.
The bulls were able to push the pair above the 50-hour simple moving average and 1.3750. The pair even climbed above 1.3800 and traded as high as 1.3869. Recently, there was a pullback below 1.3760 and the 23.6% Fib retracement level of the upward move from the 1.3401 swing low to the 1.3869 high.
The pair is now consolidating below 1.3750. There is also a connecting bearish trend line forming with resistance at 1.3760. On the upside, the GBP/USD chart indicates that the pair is facing resistance near 1.3725.
The next hurdle for the bulls could be 1.3760. A close above 1.3760 could open the doors for a move toward 1.3870. Any more gains might send GBP/USD toward 1.4000.
On the downside, the bulls might remain active near the 50% Fib retracement at 1.3635. If there is a downside break below 1.3635, the pair could accelerate lower. The first major support is at 1.3510, below which the pair could test 1.3480.
The next key area for the bulls could be 1.3400, below which the pair could test 1.3320. Any more losses could lead the pair toward 1.3250.
This article represents the opinion of the Companies operating under the FXOpen brand only. It is not to be construed as an offer, solicitation, or recommendation with respect to products and services provided by the Companies operating under the FXOpen brand, nor is it to be considered financial advice.

GBPUSD Slips as Dollar Strength Dominates GBPUSD continues to face pressure as shifting macro expectations and renewed dollar demand drive momentum across FX markets. Recent price action reflects growing uncertainty around interest rates, inflation data, and global risk sentiment. This phase highlights the importance of patience and disciplined execution, as short-term reactions give way to larger directional moves. The next few sessions will be critical in revealing whether this move extends or stabilises.
Disclosure: We are part of Trade Nation's Influencer program and receive a monthly fee for using their TradingView charts in our analysis.

#GBPUSD: Previous Entry Invalidated,Next We Wait For Price! Our previous GBPUSD entry was invalidated as the pound declined while the DXY turned bearish. However, our view remains bullish on GBPUSD and the price is likely to reverse from our new entry area. Once the price enters the discounted zone we can then wait for it to reach one of our target or take-profit levels. This week’s NFP data is likely to affect our trade and could invalidate our entry if it is positive for the DXY.
Best wishes and safe trading.
Team Setupsfx

GBPUSD: Highly Probable +1400 Pips Trading Setup! Dear Traders,
📌GBPUSD has shown strong bullish momentum, with price action indicating upward pushes. However, caution is advised as temporary pullbacks are possible before sustained rallies resume. The pair’s movement is influenced by the US Dollar Index (DXY), which is showing signs of potential weakness. This supports the bullish outlook for GBPUSD.
📌Currently, the pair is in a bullish trend with temporary corrective dips expected. There’s a safe entry area for buyers around the ‘blue marked’ arrow. Three profit targets are marked, each for partial or full profit-taking. Avoid early entries near the ‘red marked’ arrow area, as it carries higher risk. Instead, prefer entries after the price breaks above the trend line, confirms liquidity absorption, and retests the breakout zone.
📌Furthermore, the US Dollar Index (DXY) is likely to decline due to upcoming economic data and market sentiment, which will favour GBP strength. The UK economic outlook is positive, supporting Sterling’s resilience. However, US economic uncertainty, with slowing growth and potential interest rate adjustments, may further pressure the dollar.
📌Finally, wait for the price to revisit the ‘blue marked’ support for a safer entry opportunity. Enter long positions after the trend line breaks and retests confirmation. Aim for the three defined targets, scaling out positions progressively. Maintain disciplined risk management throughout.
If you enjoy our work, please like and comment on the post. Your support means the world to us and encourages us to share more educational trading setups. If you’d like us to analyse any other trading plans, please comment below, and we’ll analyse them as soon as possible. 📊❤️
⚠️Disclaimer⚠️
This is not financial advice and is only for educational purposes. Please do your own research and make decisions based on your own knowledge and chart analysis. Financial markets can lead to serious losses, so have a thorough trading plan and risk management strategy.
Thank you❤️
Team Setupsfx_

#GBPUSD: +910 PIPS Buying Setup! Swing Setup! GBPUSD broken through the bearish trend line liquidity now we think price is likely to continue uptrend with around 910+ pips swing buying setup. We also have important news coming up this week so be careful while trading also use accurate risk management while trading.
Good luck and trade safe!
Team Setupsfx_

#GBP/USD Sell Trade Scenario.Here’s an up-to-date GBP/USD Sell trade outlook (technical + fundamental) to help you assess whether positioning for a Downside makes sense right now.
Thank You......
