GBP/USD Short to Long Idea (1.36300 down to 1.35600 back up)This week, I’m focusing on the setups closest to price action while keeping the bigger trend in mind. GU has been bullish overall, but price is now approaching a strong supply zone that can’t be ignored.
I’ll be waiting to see how price reacts within this supply. If it distributes as expected, I’ll look for short-term sells targeting the nearby 2hr demand zone.
Confluences for Short-Term Sells:
- Strong bullish run could retrace back to demand
- Clean 5hr supply zone that previously caused a BOS to the downside
- 2hr demand zone below still unmitigated
- DXY is near a demand, aligning with this pullback idea
- Price slowing down, showing signs of reacting to supply
P.S. If supply doesn’t hold and price instead drops to mitigate the 2hr demand, I’ll then look for potential buys to rejoin the trend.
Gbpusdanalysis

GBP/USD Weekly Outlook: Bulls Push Through as Range Expands
Traders need to be careful this coming week. Now that this message has been delivered, speculators need to understand the GBP/USD will produce dynamic results.
The U.S Federal Reserve is set to deliver their FOMC Statement and announce their Federal Funds Rate this coming Wednesday.
The U.S central bank will cut interest rates this Wednesday. The GBP/USD has gone into this weekend having nudged higher compared to the start of last week.
But the question everyone wants answered is, what will the Fed’s message be? The 1.35575 mark was achieved going into this weekend and folks who believe the GBP/USD must move higher in the coming days based on the Fed’s upcoming interest rate cut cannot be blamed.
But this doesn’t mean they are correct. The Fed will likely cut their Federal Funds Rate by 25 basis points.
GBP/USD Weekly Outlook:
Speculative price range for GBP/USD is 1.35090 to 1.37500
This will be a dynamic week in Forex. The GBP/USD will not be immune to volatility. The currency pair will be fast and day traders need to practice supreme risk management so they are not burned by the speed of Forex. Having challenged highs last week around 1.35920 on Tuesday was good bullish action, but the selling that ensued afterwards is a warning sign that caution remains a fixture in financial institutions.
As a note the GBP/USD did attain the 1.37900 vicinity on the 1st of July. Bullish traders may be dreaming of this higher values, but day traders with limited funds should be willing to cash out of big moves if profits are produced. The Federal Reserve hold the cards in the Forex market this week, the GBP/USD will react to the FOMC Policy Statement and everyone should be braced for fast conditions.
Market Analysis: GBP/USD Retains GainsMarket Analysis: GBP/USD Retains Gains
GBP/USD is showing positive signs above 1.3520.
Important Takeaways for GBP/USD Analysis Today
- The British Pound is attempting a fresh increase above 1.3520.
- There is a key bullish trend line forming with support near 1.3555 on the hourly chart of GBP/USD.
GBP/USD Technical Analysis
On the hourly chart of GBP/USD, the pair remained well-bid above 1.3495. The British Pound started a decent increase above 1.3530 against the US Dollar.
The bulls were able to push the pair above the 50-hour simple moving average and 1.3550. The pair even climbed above 1.3580 and traded as high as 1.3582. Recently, there was a pullback below 1.3555 and the 50% Fib retracement level of the upward move from the 1.3495 swing low to the 1.3582 high.
However, the bulls were active near the 1.3530 support since it coincides with the 61.8% Fib retracement. The pair is again rising above 1.3555. There is also a key bullish trend line forming with support near 1.3555.
On the upside, the GBP/USD chart indicates that the pair is facing resistance near 1.3580. The next hurdle for the bulls could be 1.3590. A close above 1.3590 could open the doors for a move toward 1.3640. Any more gains might send GBP/USD toward 1.3700.
On the downside, the bulls might remain active near the same trend line at 1.3555. If there is a downside break below 1.3555, the pair could accelerate lower.
The first major support is at 1.3530, below which the pair could test 1.3495. The next key area for the bulls could be 1.3475, below which the pair could test 1.3440. Any more losses could lead toward 1.3420.
This article represents the opinion of the Companies operating under the FXOpen brand only. It is not to be construed as an offer, solicitation, or recommendation with respect to products and services provided by the Companies operating under the FXOpen brand, nor is it to be considered financial advice.

GBP/USD Outlook - Momentum Favors the UpsideHi everyone,
As anticipated, GBP/USD broke above the 1.35300 level last week and successfully consolidated it as support. Our outlook for the week ahead remains bullish, with expectations for a continued push higher toward the 1.36850 resistance area.
A decisive break above 1.36850 would bring the next key upside targets into focus, in particular the 1.37890 level. The impulsive rally from the 1st August low continues to underpin our bullish outlook on GBP/USD.
We’ll be monitoring price action closely to see how this structure develops in the sessions ahead.
The longer-term outlook remains bullish, with expectations for the rally to continue extending from the 1.20991 January low toward 1.40000 and 1.41700.
We’ll keep you updated throughout the week with how we’re managing our active ideas.
Thanks again for all the likes, boosts, comments, and follows — we really appreciate the support!
All the best for the week ahead.
Trade safe,
BluetonaFX

GBPUSD – Buy Trade Scenario🔵 Bullish Scenario (Buy Call)
Entry Zone: Break and sustained 4H close above 1.3600 – 1.3620 (marked resistance zone).
Reasoning:
Price has tested this resistance 4–5 times, weakening the supply zone and increasing breakout probability (resistance fatigue).
Each pullback from this level has shown higher lows, suggesting bullish accumulation.
Volume profile indicates sellers are failing to defend the zone with the same intensity.
Target 1: 1.3700 (psychological round number).
Target 2: 1.3780 – 1.3800 (major liquidity pool & prior swing high).
Stop Loss: Below 1.3550 (false breakout protection).
R:R Potential: ~1:2.5 to 1:3
⚖️ Key Technical Takeaway
1.3600 – 1.3620 = Make-or-break resistance.
Since it has been tested 4–5 times, probability of a breakout is higher (resistance fatigue).
Safer strategy: Wait for a confirmed breakout with volume (bullish continuation)

GBPUSDGBPUSD needs a drop before pushing up further to take the top.
Disclosure: We are part of Trade Nation's Influencer program and receive a monthly fee for using their TradingView charts in our analysis.

GBPUSD Sellers Defend Supply Zone, Eyes Shift Toward Key SupportGBPUSD, Cable has once again struggled to push beyond the heavy resistance block around 1.3580–1.3680, with price stalling inside a supply zone and showing signs of exhaustion. The technical rejection matches up with a broader fundamental backdrop that favors USD strength while the pound faces ongoing domestic headwinds. Let’s dig deeper into the setup.
Current Bias
Bearish – price action is capped by a strong supply zone, and fundamentals lean toward further downside.
Key Fundamental Drivers
Bank of England: Recent rate cut reinforced downside pressure, and policymakers remain cautious as inflation stabilizes but growth weakens.
Federal Reserve: Sticky US inflation and cautious Fed easing expectations provide underlying support for the dollar.
Economic divergence: UK growth outlook remains soft compared to the US, with services PMI and retail sales lagging.
Macro Context
Interest rates: BoE has shifted toward a looser stance, while the Fed maintains cautious cuts. This relative policy divergence favors USD over GBP.
Economic growth: UK data (manufacturing contraction, fragile GDP estimates) paints a weak backdrop. US growth, while slowing, remains stronger.
Commodity flows: Oil weakness indirectly pressures GBP through reduced global demand sentiment.
Geopolitical: Brexit-related trade frictions persist, adding medium-term uncertainty.
Primary Risk to the Trend
A dovish Fed surprise (softer CPI, faster cuts) could undercut USD strength, boosting GBP/USD. Conversely, stronger UK wage or inflation prints could temporarily support the pound.
Most Critical Upcoming News/Event
UK CPI & Retail Sales – will set tone for BoE policy outlook.
US CPI and Fed commentary – crucial for USD trajectory.
Leader/Lagger Dynamics
GBP/USD acts as a leader within pound crosses (GBP/JPY, EUR/GBP, GBP/CHF), often setting direction. It behaves as a lagger to broader USD moves, especially after US data releases.
Key Levels
Support Levels: 1.3483, 1.3342
Resistance Levels: 1.3580, 1.3685
Stop Loss (SL): 1.3685 (above supply zone)
Take Profit (TP): 1.3342 (major downside target)
Summary: Bias and Watchpoints
GBPUSD remains under pressure after repeated rejections from the 1.3580–1.3685 supply zone. With BoE leaning dovish and UK data fragile, the bias stays bearish, favoring a move toward 1.3483 and possibly 1.3342. A stop loss above 1.3685 protects against upside squeezes, while US and UK CPI will be the deciding catalysts. For now, the setup favors sellers, with clear downside targets and the dollar holding the upper hand.

Long Term Buy Position in GBPUSDICMARKETS:GBPUSD has completed Head & Shoulder on Daily Timeframe on 25th August 2025
In this trade, I will not follow any noise as it is a long term trade with high pips in Risk but even higher reward intact. I am waiting for this price action since one month but it is not triggering the cleaned Head and Shoulder's breakout at 1.3596.
I have placed a Buy Stop Order at 1.3596 with my SL at low of inversed right shoulder.
I will take two positions both at the breakout of right shoulder at 1.3596. Both position has 2% risk in total
Position 1 with 1 % Risk
Buy Stop: 1.3596
Stop Loss: 1.3388
TP: 1.3815
Position 1 with 1 % Risk
Buy Stop: 1.3596
Stop Loss: 1.3388
TP: 1.3815

GDP on GBPUSD may push price upUpcoming GDP on GBPUSD may push the price upside as 2 step liquidity sweep has fueled the continued uptrend which may potentially continue to rise up to the area of value. As the longer term trend is up, it is highly likely price to move back up to the direction of the major trend.

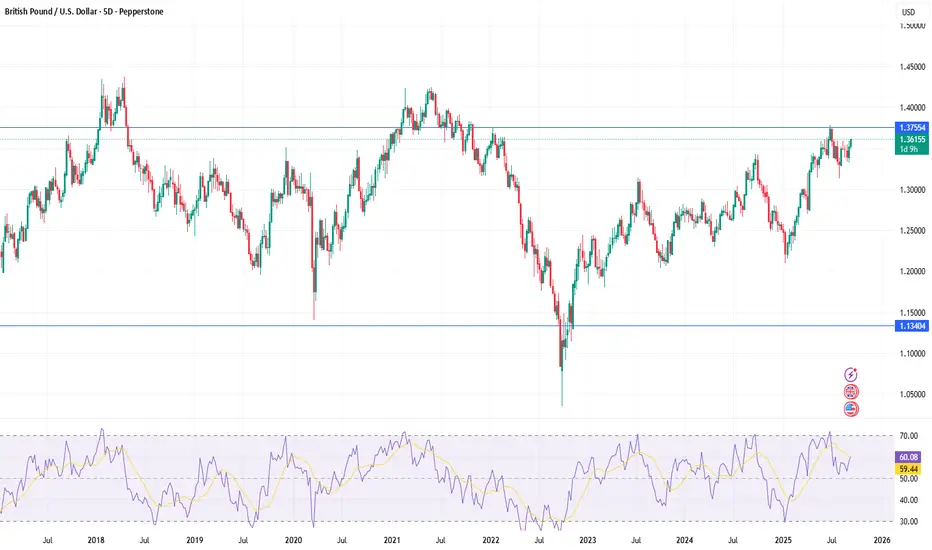
GBPUSD Faces Strong Ceiling at 1.36 – Drop to 1.32 Ahead?The first half of this year was strongly bullish for GBPUSD, with the pair climbing from 1.20 to 1.37 — a rally of nearly 1,700 pips (14%).
However, after topping in July, cable corrected around 600 pips, only to find solid support at 1.32 in August. From there, a rebound followed, pushing price back up to 1.36 by the end of the month.
Looking at the chart, we can see a clear technical picture: while GBPUSD has rebounded from support, it has also formed a very strong ceiling at 1.36. This zone has now been reinforced by a bearish pin bar printed just two days ago.
Going forward, as I already highlighted in my DXY analysis, I expect a rebound in the USD — and this will almost certainly translate into a drop in cable.
From a purely technical standpoint:
• 1.36 = strong resistance, validated by the pin bar and multiple rejections.
• 1.34 is the first support and can act as a soft target.
• In the medium term, I expect GBPUSD to revisit 1.32.
The strategy is clear: sell the rallies into resistance, as the pair appears to be at the beginning of a corrective leg lower. 🚀

GBP/USD Reversal in Play – Bearish Targets at 1.3335The pair is trading around 1.3510 after showing a clear rejection at the 1.3550–1.3590 resistance zone, which has been tested multiple times but failed to break. Sellers have stepped in strongly from this zone, forming a potential lower-high structure.
• Resistance Zone (Sell Area): 1.3550 – 1.3590 remains the key ceiling.
• Market Structure: The chart shows a gradual weakening after reaching 1.3590, suggesting the market is transitioning from distribution to markdown.
• Momentum: Candlesticks show longer upper wicks and stronger bearish closes, signaling active seller pressure.
• Supports Below:
o 1.3450 (interim support, minor target)
o 1.3370 (mid-term bearish target)
o 1.3335 (final key demand zone and bearish completion level)
This setup favors downside continuation as long as price stays below 1.3550–1.3590.
________________________________________
📉 Trade Setup (Bearish Bias)
• Entry: 1.3510 (current zone) or wait for a pullback to 1.3530–1.3540
• Stop-Loss: 1.3590 (above resistance zone)
• Take Profit 1 (TP1): 1.3450 🥇
• Take Profit 2 (TP2): 1.3370 🥈
• Take Profit 3 (TP3): 1.3335 🎯
• Risk Management: Book partial profits at TP1, trail stop-loss after TP1 to breakeven, let remaining position ride toward TP2–TP3.

GBPUSD Resume uptrendwith BOS at 1.3516 level with one single move on 4h was a sharp liquidity grab which is followed by a double bottom has given GBPUSD a very high probability rejection from this lower price. From daily perspective, price is rejecting from daily 10ema upon crossing the previous daily low. A potential confirmation of new higher high formation.
from the current price level 1.3550 expecting a move back to 1.3605 to first impulse + further upside possible move.

DeGRAM | GBPUSD broke the channel📊 Technical Analysis
● GBP/USD has broken out of the descending channel and reclaimed the 1.3390 support, confirming a bullish reversal.
● Price action shows momentum building toward 1.3590, and a sustained break above this level could open the way to 1.3770.
💡 Fundamental Analysis
● Sterling is supported by hawkish BoE commentary signaling concern over persistent inflation, while softer US wage data weighed on dollar strength.
✨ Summary
Bullish above 1.3390; targets 1.3590 → 1.3770. Invalidation on a close below 1.3390.
-------------------
Share your opinion in the comments and support the idea with a like. Thanks for your support!

The Game Series | Who Wins on GBPUSD?The market is never random — it’s a game of traps and liquidity hunts played by institutions against the crowd.
On GBPUSD, the story unfolds clearly:
🔻 First came the down wave, pulling traders into shorts and building liquidity at the lows.
🔺 Then, price flipped into an upside wave, climbing toward a major liquidity pool sitting above Equal Highs (EQH) and the Intraday High (IDM).
Now here’s where the real game begins. Institutions don’t move without collecting fuel. That’s why a fake push down into the SSL zone near 1.3330 is likely — designed to trigger stop-losses and shake weak hands out of the market.
From there, the stage is set for the strong upside push. The crowd gets trapped, liquidity gets harvested, and the real move is launched.
💡 Takeaway: Liquidity isn’t just numbers on a chart — it’s the scoreboard of the market game. The side that controls liquidity controls the outcome.
👉 Question to you: After the sweep, will the Bulls 🟢 finally secure the win, or do the Bears 🔴 still have a surprise move left?

GBPUSD Daily Forecast – Q3 | W37 | D8 | Y25GBPUSD Daily Forecast – Q3 | W37 | D8 | Y25 📊
🔹 Weekly Bias:
Remains bullish, with last week’s candle closing strong above the Daily 50 EMA.
Rejection wick adds further confluence to upside continuation.
🔹 Daily Bias:
Current daily structure holds bullish after another close above the Daily 50 EMA.
🟢 Long Scenarios
High-probability longs from defined zones, with opportunities to buy from the lows.
Weekly 50 EMA retest: a potential long area later this week — even if the weekly candle looks bearish, the bias stays bullish due to last week’s strong close above the 50 EMA.
Points of Interest: previous weekly wick lows (wicks often get filled; once filled, expect continuation to the upside).
⚡ Immediate Long Setup (London open)
Early longs are tricky, but the confluence is strong:
Daily imbalance fill + Daily 50 EMA support
Gap above price (market tendency to rebalance)
Daily order block refined with LTF order blocks
If Asia opens at lows with Asia highs unfilled → strong confluence for a London session break of structure → long entry toward Asia highs and gap fill.
Targeting a quick 1:3 RRR with aggressive trade management.
🔴 Short Scenarios
Shorts are possible but require caution.
Daily candles remain above the 50 EMA (bullish bias).
Best short zones: around previously daily highs with high confluence areas.
🔍 Analysis Approach:
I’m applying Smart Money Concepts, focusing on:
Identifying Points of Interest on the Higher Time Frames (HTFs) 🕰️
Using those POIs to define a clear trading range 📐
Refining those zones on Lower Time Frames (LTFs) 🔎
Waiting for a Break of Structure (BoS) for confirmation ✅
This method allows me to stay precise, disciplined, and aligned with the market narrative, rather than chasing price.
💡 My Motto:
"Capital management, discipline, and consistency in your trading edge."
A positive risk-to-reward ratio, paired with a high win rate, is the backbone of any solid trading plan 📈🔐
⚠️ Losses?
They’re part of the mathematical game of trading 🎲
They don’t define you — they’re necessary, they happen, and we move forward 📊➡️
🙏 I appreciate you taking the time to review my Daily Forecast.
Stay sharp, stay consistent, and protect your capital
— FRNGT 🚀
FX:GBPUSD

Post NFP Analysis on GBPUSDThe market remains bullish for the DXY.
We'll keep an eye to see either scenario play out, then we Trade

GBP/USD - Building Base for Renewed Bullish MomentumHi everyone,
As highlighted in our previous idea, GBP/USD delivered the deeper pullback toward 1.33800 before reversing to the upside and decisively hitting our NFP trade target at 1.35300 last week. However, price lacked the momentum to break and hold above this level.
Looking ahead, we anticipate a renewed attempt at 1.35300 this week from the 1.34580–1.34880 zone. A successful break and retest of support should give GBP/USD the platform to mount a challenge toward the 1.36850 resistance area.
A decisive break above 1.36850 would bring the next key upside targets into focus. The impulsive rally from the 1st August low continues to underpin our bullish outlook on GBP/USD.
We’ll be monitoring price action closely to see how this structure develops in the sessions ahead.
The longer-term outlook remains bullish, with expectations for the rally to continue extending from the 1.20991 January low toward 1.40000 and 1.41700.
We’ll keep you updated throughout the week with how we’re managing our active ideas.
Thanks again for all the likes, boosts, comments, and follows — we really appreciate the support!
All the best for the week ahead.
Trade safe,
BluetonaFX

GBPUSD: Bearish-Neutral, But Showing Signs Of WeaknessWelcome back to the Weekly Forex Forecast for the week of Sept 8 - 12.
In this video, we will analyze the following FX market: GBPUSD
The GBPUSD has been a little more bearish than EURUSD. This is still the case. Bearish and moving sideways. There was a sweep of buy side liquidity Friday, but a late retreat back into the range of last weeks range. This may indicate weakness going into this week, and I am looking for price to turn over, as it is still inside correction territory.
Enjoy!
May profits be upon you.
Leave any questions or comments in the comment section.
I appreciate any feedback from my viewers!
Like and/or subscribe if you want more accurate analysis.
Thank you so much!
Disclaimer:
I do not provide personal investment advice and I am not a qualified licensed investment advisor.
All information found here, including any ideas, opinions, views, predictions, forecasts, commentaries, suggestions, expressed or implied herein, are for informational, entertainment or educational purposes only and should not be construed as personal investment advice. While the information provided is believed to be accurate, it may include errors or inaccuracies.
I will not and cannot be held liable for any actions you take as a result of anything you read here.
Conduct your own due diligence, or consult a licensed financial advisor or broker before making any and all investment decisions. Any investments, trades, speculations, or decisions made on the basis of any information found on this channel, expressed or implied herein, are committed at your own risk, financial or otherwise.

GBPUSDGBPUSD have a potential down wave in this structure.
Disclosure: We are part of Trade Nation's Influencer program and receive a monthly fee for using their TradingView charts in our analysis.

GBPUSD Daily Forecast -Q3 | W37 | Y25📅 Q3 | W37 | Y25
📊 GBPUSD Daily Forecast
🔍 Analysis Approach:
I’m applying Smart Money Concepts, focusing on:
Identifying Points of Interest on the Higher Time Frames (HTFs) 🕰️
Using those POIs to define a clear trading range 📐
Refining those zones on Lower Time Frames (LTFs) 🔎
Waiting for a Break of Structure (BoS) for confirmation ✅
This method allows me to stay precise, disciplined, and aligned with the market narrative, rather than chasing price.
💡 My Motto:
"Capital management, discipline, and consistency in your trading edge."
A positive risk-to-reward ratio, paired with a high win rate, is the backbone of any solid trading plan 📈🔐
⚠️ Losses?
They’re part of the mathematical game of trading 🎲
They don’t define you — they’re necessary, they happen, and we move forward 📊➡️
🙏 I appreciate you taking the time to review my Daily Forecast.
Stay sharp, stay consistent, and protect your capital
— FRNGT 🚀
FX:GBPUSD

GBPUSD - LongGBPUSD Analysis - Long
In this Chart GBPUSD H4 Timeframe: By Nii_Billions.
❤️This Chart is for GBPUSD market analysis.
❤️Entry, SL, and Target is based off our Strategy.
This chart analysis uses multiple timeframes to analyze the market and to help see the bigger picture on the charts.
The strategy uses technical and fundamental factors, and market sentiment to predict a setup in GBPUSD, with well-defined entry, stop loss, and take profit levels for risk management.
🟢This idea is purely for educational purposes.🟢
❤️Please, support our work with like & comment!❤️

GBPUSD Short From Resistance!
HI,Traders !
#GBPUSD shot up sharply
And hit a horizontal resistance
Of 1.35423 from where the pair
Is already making a local
Pullback and we will be
Expecting a further bearish
Move down on Monday !
Comment and subscribe to help us grow !

GBPUSD HIGH PROBABILITY SETUP!!!🚨 GBPUSD HIGH PROBABILITY BUY SETUP 🚨
* Here We Can See The Potential Move For GBPUSD Coming Hours.
* Keep Your Eyes Close On Your Trading Positions.
* Happy PIP Hunting Traders.
£ FXKILLA £
