Pound Sterling Update: Pivot Holding Above 1.3570 🇬🇧🇺🇸GBP/USD Technical Analysis – February 9, 2026
Pivot Point: 1.3570
The price is currently trading around the 1.3570 pivot level. As long as it holds above this point, the bullish trend remains active.
📈 Bullish Scenario (Upside Trend):
First Target: The price is expected to continue its rise toward the resistance level at 1.3625.
Confirmation: Stabilizing above this level with a 1-hour or 4-hour candle close will open the way for further gains toward the 1.3650 target.
📉 Bearish Scenario (Downside Trend):
Correction: If the price performs a correction and settles below the 1.3570 pivot point, the trend will shift to the downside.
Downside Targets: The price will drop toward the support level at 1.3545, and potentially reach 1.3515 if the pressure continues.
📍 Key Levels Summary:
Resistance (Upside): 1.3625 | 1.3650
Support (Downside): 1.3545 | 1.3515
Gbpusdshort

Bitsounis / GBPUSD Short entryI generally like the reaction that GBPUSD has had on a long time frame 1d.
I'm waiting for it to break my current zone

#GBP/USD Sell Trade Scenario.Here’s an up-to-date GBP/USD Sell trade outlook (technical + fundamental) to help you assess whether positioning for a Downside makes sense right now.
Thank You......

GBPUSD: Bearish Drop to 1.334?FX:GBPUSD is eyeing a bearish reversal on the 4-hour chart , with price testing resistance after recent highs in an upward trendline from June 2025, converging with a potential entry zone that could spark downside momentum if sellers defend amid volatility. This setup suggests a pullback opportunity post-rally, targeting lower support levels with more than 1:2 risk-reward .🔥
Entry between 1.3566–1.3586 for a short position. Target at 1.3341 . Set a stop loss at a close above 1.3664 , yielding a risk-reward ratio of more than 1:2 . Monitor for confirmation via a bearish candle close below entry with rising volume, leveraging the pair's dynamics near resistance.🌟
Fundamentally , GBPUSD is trading around 1.357 in early February 2026, with key events this week. For the US Dollar, Nonfarm Payrolls (Jan, forecast 50K) on February 6 at 1:30 PM UTC, the week's highlight—weak data could favor GBP upside. 💡
📝 Trade Setup
🎯 Entry (Short):
1.3566 – 1.3586
(Entry from current price is valid with proper risk & position sizing.)
🎯 Target:
• 1.3341
❌ Stop Loss:
• Close above 1.3664
⚖️ Risk-to-Reward:
• > 1:2
💡 Your view?
Is this the start of a healthy pullback toward 1.3340, or will GBP bulls push through resistance and extend the rally? 👇

GBP/USD 4H MARKT ANALYSIS BEARISH PRESSURE BUILDINGMarket Structure
Price previously made a strong bullish move and created a higher high near 1.38 area.
After that, market showed rejection from the supply zone (top orange zone) and started dropping.
Currently price is approaching a mid support / demand zone around 1.3530 – 1.3500.
🔍 Current Price Behavior
Strong bearish candles show momentum shifting downward.
Price is now testing support. This is a decision area:
Either bounce from support
Or break and continue bearish trend
📉 Bearish Scenario (Your chart projection)
If price:
Breaks and closes below 1.3500 support 👉 Next possible target:
1.3400
Then strong support around 1.3330 zone
Trend bias = Bearish while price stays below 1.3600

GBPUSD: Intraday Trading Idea Possible Sell Worth 250+ PipsDear Traders,
I hope you’re doing well. We’re seeing strong selling pressure at the current price range and believe the price could drop around 1.3500, a 250+ pip move. We’re waiting for a strong bearish candle to close to confirm the bearish drop.
If you like our work, please like and comment. Follow us for more.
Team Setupsfx_

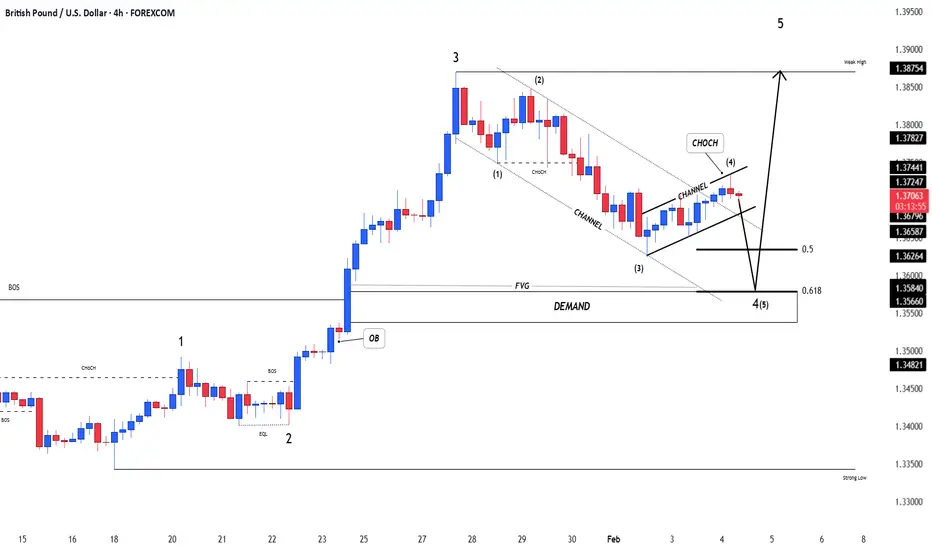
GBPUSDGBPUSD
- Fair Value Gap
- Bullish Channel as an corrective pattern in Short Time Frame and Bearish Channel in Long Time Frame
- Demand Zone
- Fibonacci Level - 50.00% / 61.80%
- Completed " 123 " Impulsive Waves
GBPUSD — FRGNT DAILY FORECAST Q1 | D4 | W5 | Y26📅 Q1 | D4 | W5 | Y26
📊 GBPUSD — FRGNT DAILY FORECAST
🔍 Analysis Approach
I’m applying a developed version of Smart Money Concepts, with a structured focus on:
• Identifying Key Points of Interest (POIs) on Higher Time Frames (HTFs) 🕰️
• Using those POIs to define a clear and controlled trading range 📐
• Refining those zones on Lower Time Frames (LTFs) 🔎
• Waiting for a Break of Structure (BoS) as confirmation ✅
This process keeps me precise, disciplined, and aligned with market narrative, rather than reacting emotionally or chasing price.
💡 My Motto
“Capital management, discipline, and consistency in your trading edge.”
A positive risk-to-reward ratio, combined with a high-probability execution model, is the backbone of any sustainable trading plan 📈🔐
⚠️ On Losses
Losses are part of the mathematical reality of trading 🎲
They don’t define you — they are necessary, expected, and managed.
We acknowledge them, learn, and move forward 📊➡️
🙏 I appreciate you taking the time to review my Daily Forecast.
Further context and supporting material can be found in the Links section.
Stay sharp 🧠
Stay consistent 🎯
Protect your capital 🔐
— FRGNT 🚀📈
FX:GBPUSD

GBP/USD – Fundamental Drive in Play (30.01.2026)📝 Description 🔍 Setup (Market + Fundamentals) FX:GBPUSD
GBP/USD has rallied strongly but is now facing heavy selling pressure at a well-defined resistance zone. Multiple rejections from the same supply area signal buyer exhaustion.
On the fundamental side, USD strength is supported by:
1.New Fed leadership announcement
2.Political agreement to avoid a US government shutdown, reducing uncertainty and favoring the dollar
Technically, price is breaking below the rising trendline, with EMA & Ichimoku losing bullish momentum.
📍 Support & Resistance
🟨 Resistance Zone: 1.3825 – 1.3865
🟥 1st Support: 1.3600
🟥 2nd Support: 1.3500
Volume profile supports downside liquidity below current price
⚠️ Disclaimer
This analysis is for educational purposes only.
Forex trading involves risk — always use proper risk management and trade responsibly.
💬 Support the Idea 👍 Like if you see GBP/USD turning bearish
💬 Comment: Sell from resistance or wait for deeper confirmation?
🔁 Share with traders watching USD fundamentals
#GBPUSD #ForexTrading #FundamentalAnalysis #PriceAction #ResistanceZone #USDStrength #TradingView #Kabhi_TA_Trading

time to buy GBPUSD nowGBPUSD was in a recent downtrend for the last few weeks and struggled to stay bullish, but recently it has just broken a strong resistance trend line which it tested several times and failed to break through. GBPUSD is very likely to hit the next major resistance zone which is marked as the "TAKE PROFIT" LEVEL. There are many clear signs of new bullish movements. Time to Buy GBPUSD now.

#GBP/USD Sell Trade Scenario.Here’s an up-to-date GBP/USD Sell trade outlook (technical + fundamental) to help you assess whether positioning for a Downside makes sense right now.
Thank You......

GBP/USD Gave Fake Breakout , Short Setup Valid To Get 200 Pips !Here is my 1H Chart on GBP/USD , We Have A Fake Breakout and then the price Back below my old res and we have a very good bearish Price Action on 1 And 2 Hours T.F Also the price playing very good around my res and i`m waiting the price to retest the broken area and giving a good bearish price action For the second time on smaller time frames to can get a confirmation to enter , So i see it`s a good chance to sell this pair if it go up a little to retest the broken area and then we can sell it and targeting 100 to 150 pips . and if we have a daily closure again above my new res then this idea will not be valid anymore .
Reasons To Enter :
1- Perfect Breakout .
2- Clear Bearish Price Action .
3- Bigger T.F Giving Good Bearish P.A .
4 - Perfect 15 Mins Closure .
5- The Price Respect The Res Again .

GBPUSD — FRGNT DAILY CHART FORECAST. Q1 | W4 | D29 | Y26📅 Q1 | W4 | D29 | Y26
📊 GBPUSD — FRGNT DAILY CHART FORECAST
🔍 Analysis Approach
I’m applying a developed version of Smart Money Concepts, with a structured focus on:
• Identifying Key Points of Interest (POIs) on Higher Time Frames (HTFs) 🕰️
• Using those POIs to define a clear and controlled trading range 📐
• Refining those zones on Lower Time Frames (LTFs) 🔎
• Waiting for a Break of Structure (BoS) as confirmation ✅
This process keeps me precise, disciplined, and aligned with market narrative, rather than reacting emotionally or chasing price.
💡 My Motto
“Capital management, discipline, and consistency in your trading edge.”
A positive risk-to-reward ratio, combined with a high-probability execution model, is the backbone of any sustainable trading plan 📈🔐
⚠️ On Losses
Losses are part of the mathematical reality of trading 🎲
They don’t define you — they are necessary, expected, and managed.
We acknowledge them, learn, and move forward 📊➡️
🙏 I appreciate you taking the time to review my Daily Forecast.
Further context and supporting material can be found in the Links section.
Stay sharp 🧠
Stay consistent 🎯
Protect your capital 🔐
— FRGNT 🚀📈
FX:GBPUSD

GBPUSD ShortThe previous trading session we had a weak Dollar Currency and this juggernaut every pair against the dollar, only for now and short term; I can see a pullback happening as the dollar will be doing some recovery for the previous big move. The MACD also showing and signaling momentum to the downside at least for now. FPMARKETS:GBPUSD

GBPUSD Short ideaA setup can be considered within the continuation of the bearish trend on the weekly timeframe, with the following rationale: 1W FP ➡️ 1D FVG ➡️ 1D FP (LI) ➡️ 1W FVG.

GBPUSD 4H – Higher Timeframe RedistributionPrice is trading inside a higher timeframe redistribution phase after a strong prior move.
What this means:
-The market is not accumulating for continuation
-Large players are offloading positions at premium prices
-Structure shows choppy highs, weak follow-through, and overlapping ranges
-Rallies into resistance are likely selling opportunities, not trend continuation
The projected path reflects:
➡️ Short-term upside to rebalance liquidity
➡️ Failure to break higher timeframe resistance
➡️ Expansion lower once redistribution is complete
This is a classic HTF redistribution:
Range → Liquidity build → Distribution → Expansion
Bias remains cautious-bearish unless price accepts above resistance with strong continuation.
📌 Higher timeframe controls direction.
Lower timeframe is only for execution.

buy GBPUSD nowGBPUSD was in a recent downtrend for the last few weeks and struggled to stay bullish, but recently it has just broken a strong resistance trend line which it tested several times and failed to break through. GBPUSD is very likely to hit the next major resistance zone which is marked as the "TAKE PROFIT" LEVEL. There are many clear signs of new bullish movements. Time to Buy GBPUSD.

TheGrove | GBPUSD BUY | Idea Trading AnalysisGBPUSD is moving in an UP and broke Support line
The chart broke through the dynamic Support line and we expect a decline in the channel after testing the current level which suggests that the price will continue to rise
We expect a decline in the channel after testing the current level
Hello Traders, here is the full analysis.
I think we can soon see more fall from this range! GOOD LUCK! Great BUY opportunity GBPUSD
I still did my best and this is the most likely count for me at the moment.
-------------------
Traders, if you liked this idea or if you have your own opinion about it, write in the comments. I will be glad ⚜️
GBP/USD SWING BEARISH SETUPMarket Structure
Overall structure is bullish, driven by a strong impulsive move from ~1.3450.
Price is moving inside a steep ascending channel.
Momentum is slowing near the channel top, signaling possible exhaustion.
Trend & Price Action
Recent candles show small bodies and upper wicks near the high.
This indicates:
Buying pressure weakening
Sellers starting to step in near resistance
This supports the short-term bearish correction idea drawn on the chart.
🔴 Resistance Zone
Key resistance: 1.3700 – 1.3720
This area aligns with:
Psychological round number (1.3700)
Upper channel boundary
Recent impulsive high
Rejection here is technically logical.
🎯 Targets
1️⃣ First Target
1.3650 – 1.3660
Confluence with:
Minor horizontal support
Upper edge of the Ichimoku cloud
2️⃣ Final Target
1.3550 – 1.3580
Strong support zone:
Cloud support
Prior consolidation area
Healthy retracement within bullish trend

GBPUSD — FRGNT DAILY CHART FORECAST. Q1 | W4 | D26| Y26 📅 Q1 | W4 | D26| Y26
📊 GBPUSD — FRGNT DAILY CHART FORECAST
🔍 Analysis Approach
I’m applying a developed version of Smart Money Concepts, with a structured focus on:
• Identifying Key Points of Interest (POIs) on Higher Time Frames (HTFs) 🕰️
• Using those POIs to define a clear and controlled trading range 📐
• Refining those zones on Lower Time Frames (LTFs) 🔎
• Waiting for a Break of Structure (BoS) as confirmation ✅
This process keeps me precise, disciplined, and aligned with market narrative, rather than reacting emotionally or chasing price.
💡 My Motto
“Capital management, discipline, and consistency in your trading edge.”
A positive risk-to-reward ratio, combined with a high-probability execution model, is the backbone of any sustainable trading plan 📈🔐
⚠️ On Losses
Losses are part of the mathematical reality of trading 🎲
They don’t define you — they are necessary, expected, and managed.
We acknowledge them, learn, and move forward 📊➡️
🙏 I appreciate you taking the time to review my Daily Forecast.
Further context and supporting material can be found in the Links section.
Stay sharp 🧠
Stay consistent 🎯
Protect your capital 🔐
— FRGNT 🚀📈
FX:GBPUSD

GBPUSD Supply Zone Reaction – Expect Further DropGBPUSD – 30M Analysis (Bearish Bias)
Strong bullish move exhausted: Price rallied aggressively and is now showing signs of weakness near the top.
Clear rejection from supply zone: Multiple candles failed to hold above the marked resistance → seller dominance confirmed.
Lower high formation: Momentum is shifting from bullish to bearish continuation.
Key support broken / being tested: The marked horizontal zone around 1.3480 is acting as the first breakdown level.
Ichimoku cloud support below: Price moving toward the cloud increases the probability of a deeper pullback.
Sell Scenario
Sell below: 1.3480 (confirmed breakdown)
Target 1: 1.3440
Target 2: 1.3410
Invalidation: Strong candle close back above 1.3520
Market Structure Bias
➡️ Short-term trend: Bearish correction
➡️ Overall structure: Bullish → Pullback phase

#GBP/USD Sell Trade Setup.Here’s an up-to-date GBP/USD Sell trade outlook (technical + fundamental) to help you assess whether positioning for a Downside makes sense right now.
Thank You......

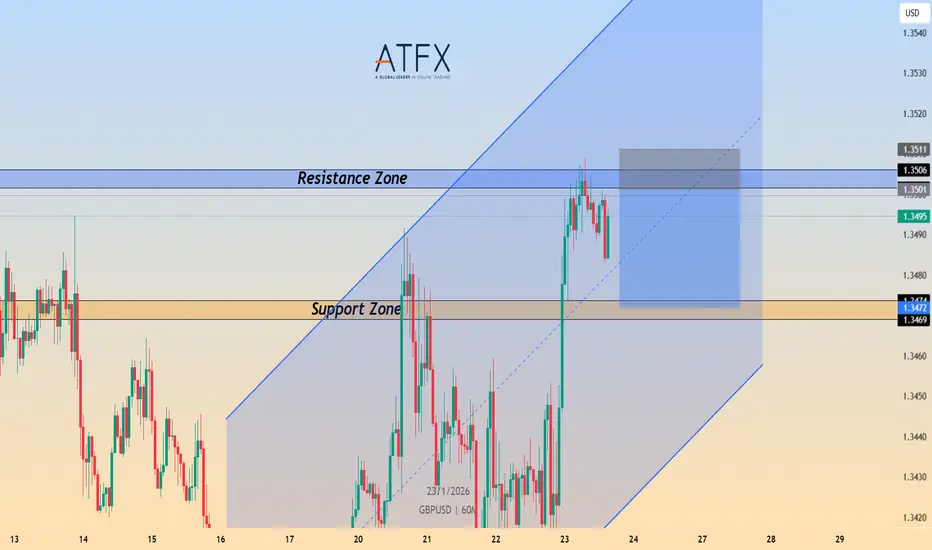
GBP/USD Price Outlook – Trade Setup📊 Technical Structure
FPMARKETS:GBPUSD GBP/USD is showing signs of a short-term bearish reversal after being rejected from the 1.3501–1.3506 resistance zone. The recent failure to sustain gains above this resistance has triggered a pullback, indicating weakening bullish momentum.
Price action suggests a corrective move lower is unfolding. As long as GBP/USD remains capped below the resistance zone, the near-term structure favors a continuation toward the 1.3469–1.3472 support zone, which coincides with the lower boundary of the channel and a key demand area.
🎯 Trade Setup (Bearish Bias)
Entry Zone: 1.3501 – 1.3506
Stop Loss: 1.3511
Take Profit 1: 1.3472
Take Profit 2: 1.3469
Risk–Reward Ratio: Approx. 1 : 2.93
📌 Invalidation
A sustained break and close above 1.3511 would invalidate the bearish setup and signal a resumption of the broader bullish trend.
🌐 Macro Background
Despite the upside surprise in UK Retail Sales, which rose 0.4% MoM in December versus expectations of a -0.1% decline, GBP/USD has struggled to extend gains and is showing signs of exhaustion near resistance.
Broader market sentiment remains cautious as investors digest geopolitical developments linked to President Trump’s trade stance and Greenland ambitions, which continue to inject uncertainty into risk markets.
On the US side, the Dollar has stabilized modestly after recent weakness, as expectations of aggressive near-term Fed easing have been pushed back. This macro backdrop supports a near-term corrective pullback in GBP/USD rather than an immediate continuation higher.
🔑 Key Technical Levels
Resistance Zone: 1.3501 – 1.3506
Support Zone: 1.3469 – 1.3472
Bearish Invalidation: Above 1.3511
📌 Trade Summary
GBP/USD has been rejected from a key resistance zone and is showing signs of short-term distribution. As long as price remains below 1.3501–1.3506, the bias favours a sell-on-rallies approach, targeting a pullback toward the 1.3472–1.3469 support region.
⚠️ Disclaimer
This analysis is for reference only and does not constitute trading advice. Financial markets involve significant risk; proper risk and position management are essential.