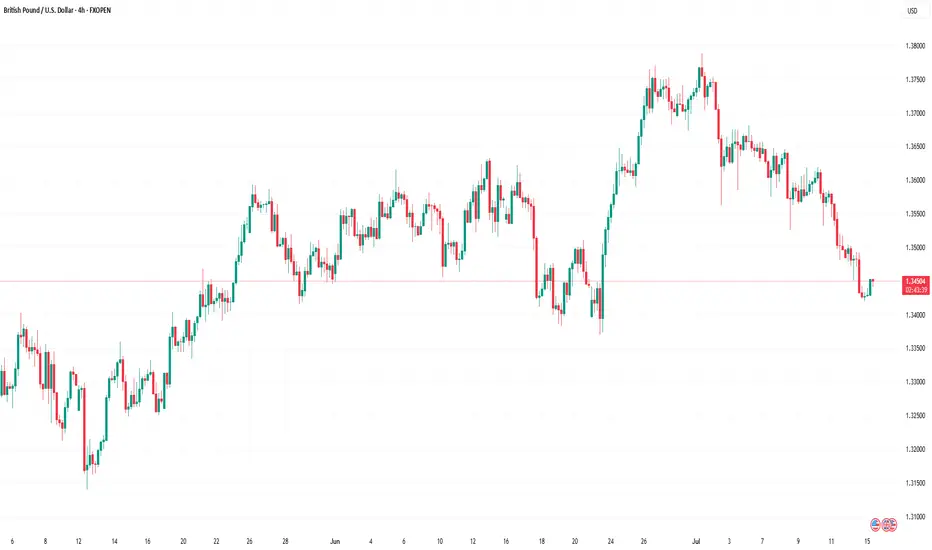
GBP/USD Breakout Done , Long Setup Valid To Get 150 Pips !Here is my 4H Chart on GBP /USD , We Have A Fake Breakout and then the price Back Above my old Support and we have a very good Bullish Price Action on 1 And 2 And 4 Hours T.F Also the price playing very good around my Support and i entered a buy trade after 4H Closure And i`m waiting the price to retest the broken area to can get a confirmation to Add another entry , So i see it`s a good chance to Buy this pair if it go Down a little to retest the broken area and then we can Buy it and targeting 100 to 150 pips . and if we have a daily closure again Below my Support then this idea will not be valid anymore .
Reasons To Enter :
1- Perfect Breakout .
2- Clear Bullish Price Action .
3- Bigger T.F Giving Good Bullish P.A .
4 - Perfect 4H Closure .
5- The Price Respect The Support Again .
Gbpusdupdate

Market Analysis: GBP/USD Attempts RecoveryMarket Analysis: GBP/USD Attempts Recovery
GBP/USD is attempting a recovery wave from 1.3035.
Important Takeaways for GBP/USD Analysis Today
- The British Pound started a recovery wave above 1.3050 and 1.3080.
- There is a key bearish trend line forming with resistance near 1.3110 on the hourly chart of GBP/USD.
GBP/USD Technical Analysis
On the hourly chart of GBP/USD, the pair started a fresh decline from 1.3220 after a decent increase. The British pound fell below 1.3150, re-entering a short-term bearish zone against the US dollar.
The pair even traded below 1.3050 and the 50-hour simple moving average. Finally, the bulls appeared near 1.3035. A low was formed near 1.3037 and the pair is now attempting a short-term recovery wave.
There was a fresh upside above 1.3050 and the 23.6% Fib retracement level of the downward move from the 1.3215 swing high to the 1.3037 low. The pair is now showing positive signs above 1.3080. Immediate resistance is near a bearish trend line at 1.3110.
The first major hurdle for the bulls on the GBP/USD chart is 1.3125 and the 50% Fib retracement. A close above 1.3125 might spark a decent increase. The next stop for the bulls might be 1.3175. Any more gains could lead the pair toward 1.3215 in the near term.
Initial support sits near the 50-hour simple moving average at 1.3080. The next key area of interest might be 1.3035, below which there is a risk of another sharp decline. In the stated case, the pair could drop toward 1.2965.
This article represents the opinion of the Companies operating under the FXOpen brand only. It is not to be construed as an offer, solicitation, or recommendation with respect to products and services provided by the Companies operating under the FXOpen brand, nor is it to be considered financial advice.

Market Analysis: GBP/USD Declines As Dollar Sees Mixed FlowsMarket Analysis: GBP/USD Declines As Dollar Sees Mixed Flows
GBP/USD started a downside correction from the 1.3470 zone.
Important Takeaways for GBP/USD Analysis Today
- The British Pound started a fresh decline and settled below the 1.3400 zone.
- There is a connecting bearish trend line forming with resistance at 1.3330 on the hourly chart of GBP/USD.
GBP/USD Technical Analysis
On the hourly chart of GBP/USD, the pair struggled above 1.3450. The British Pound started a fresh decline below 1.3400 against the US Dollar, as discussed in the previous analysis.
The pair dipped below the 1.3350 and 1.3300 levels. A low was formed at 1.32874 and the pair is now consolidating losses. On the upside, the pair is facing resistance near 1.3330 and a bearish trend line. It is close to the 23.6% Fib retracement level of the downward move from the 1.3471 swing high to the 1.3287 low.
The next key hurdle on the GBP/USD chart could be near the 50% Fib retracement at 1.3380. The main breakout zone is 1.3400. An upside break above 1.3400 could send the pair toward 1.3470.
Any more gains might open the doors for a test of 1.3500. If there is another decline, the pair could find support near 1.3285. The first key zone for the bulls might be 1.3250. A clear move below 1.3250 might send GBP/USD toward 1.3220. The next target for the bears might be 1.3200, below which the price could dive and test 1.3050.
This article represents the opinion of the Companies operating under the FXOpen brand only. It is not to be construed as an offer, solicitation, or recommendation with respect to products and services provided by the Companies operating under the FXOpen brand, nor is it to be considered financial advice.

GBPUSD H4 BULLISH SETUP FOR LONGTERMGbpusd Buying Setup Active
We Are Looking Bullish Now At Order block and its filled the order block and demand zone and we see a nice rejection candle from demand zone so we are considering buy now setup the target old high buy side liquidity and the stoploss old low below the sell side liquidity

GBP/USD - Consolidation Persists as GBP/USD Tests Key LevelsHi Everyone,
GBP/USD saw a brief relief rally before spending the remainder of the week consolidating within range.
Looking ahead, we’ll be watching closely to see whether the correction phase is complete. If price holds above the 25 September low at 1.33235, followed by a successful breach of the 1.35300 level, a retest of the 17 September high near 1.37261 remains likely. However, a break below that low could open the door for a move towards 1.31412, where fresh buying interest may re-emerge.
While there is still scope for a deeper correction towards 1.31412, our immediate focus remains on 1.33235 as the key level to monitor in the sessions ahead.
We’ll be monitoring price action closely to see how this structure develops in the sessions ahead.
The longer-term outlook remains bullish, with expectations for the rally to continue extending from the 1.20991 January low toward 1.40000 and 1.41700.
We’ll keep you updated throughout the week with how we’re managing our active ideas.
Thanks again for all the likes, boosts, comments, and follows — we really appreciate the support!
All the best for the week ahead.

GBP/USD - Relief Rally Before Deeper Retest?Hi everyone,
Our anticipated move towards 1.36850 following the break of 1.35300 played out perfectly. As expected, the reaction from the 1.36850 zone was strong, pushing GBP/USD back below 1.35300 and extending lower before finding support near the 1.33800 level.
Looking ahead, we expect the relief rally to continue towards 1.35300 before GBP/USD resumes a move lower towards the August 1st low. While we anticipate a retest of this level, our view remains that it will provide a base for renewed buying interest to build from.
We’ll be monitoring price action closely to see how this structure develops in the sessions ahead.
The longer-term outlook remains bullish, with expectations for the rally to continue extending from the 1.20991 January low toward 1.40000 and 1.41700.
We’ll keep you updated throughout the week with how we’re managing our active ideas.
Thanks again for all the likes, boosts, comments, and follows — we really appreciate the support!
All the best for the week ahead.
Trade safe,
BluetonaFX

GBP/USD Gave Fake Breakout , Short Setup Valid To Get 200 Pips !Here is my 2H Chart on GBP/USD , We Have A Fake Breakout and then the price Back below my old res and we have a very good bearish Price Action on 1 And 2 Hours T.F Also the price playing very good around my res and i`m waiting the price to retest the broken area and giving a good bearish price action on smaller time frames to can get a confirmation to enter , So i see it`s a good chance to sell this pair if it go up a little to retest the broken area and then we can sell it and targeting 100 to 150 pips . and if we have a daily closure again above my new res then this idea will not be valid anymore .
Reasons To Enter :
1- Perfect Breakout .
2- Clear Bearish Price Action .
3- Bigger T.F Giving Good Bearish P.A .
4 - Perfect 15 Mins Closure .
5- The Price Respect The Res Again .

UPDATE - GBP/USD Momentum Faces Key Test at ResistanceHi everyone,
A quick update on our GBP/USD idea shared earlier in the week:
As anticipated, once GBP/USD broke above the 1.35300 level, momentum carried the pair higher, pushing beyond 1.35955 and bringing it within reach of the 1.36850 zone. We expect this area to present notable resistance, and price action here will be key in determining whether buyers have the strength to extend the rally further.
A decisive break above 1.36850 would bring the next key upside targets into focus, in particular the 1.37890 level. The impulsive rally from the 1st August low continues to underpin our bullish outlook on GBP/USD.
We’ll be monitoring price action closely to see how this structure develops in the sessions ahead.
The longer-term outlook remains bullish, with expectations for the rally to continue extending from the 1.20991 January low toward 1.40000 and 1.41700.
We’ll keep you updated throughout the week with how we’re managing our active ideas.
Thanks again for all the likes, boosts, comments, and follows — we really appreciate the support!
All the best for the week ahead.
Trade safe,
BluetonaFX

GBP/USD Rate at 2-Month HighGBP/USD Rate at 2-Month High
As the GBP/USD chart shows, the pair is trading this morning above 1.3620 – its highest level since the beginning of July.
The bullish sentiment is driven by the divergence in central bank policies:
→ United States: Traders are betting on an interest rate cut, supported by President Trump. The Federal Reserve will announce its decision tomorrow at 21:00 GMT+3, and the market expects a reduction of at least 0.25%, from 4.25%–4.50% to 4.00%–4.25%.
→ United Kingdom: Traders anticipate the rate will remain at 4.00%. The Bank of England will announce its decision on Thursday at 14:00 GMT+3.
Although the rates of the two central banks are comparable, the situation differs: in the UK, inflation is more persistent and rate cuts are seen as risky, while in the US, President Trump is exerting pressure on the Fed’s leadership.
An additional boost for the pound comes from a wave of investment optimism linked to US President Donald Trump’s state visit to the UK. According to media reports, agreements worth around $10 billion are expected to be announced during the visit.
GBP/USD Technical Analysis
Looking at the price movements earlier this month, we noted lower highs and lower lows forming a bearish A→B→C→D structure. We also assumed that:
→ bulls could rely on support at the psychological level of 1.3400;
→ but if bearish pressure intensified, GBP/USD could fall towards the median of the descending channel.
Since then, the situation has changed considerably: bears failed to consolidate below 1.3400, and after a bullish double bottom pattern (1–2) formed, the price surged upwards.
At the same time, the GBP/USD chart highlights key signs of strong demand:
→ the descending (red) channel has been broken, and the bearish A→B→C→D structure is no longer relevant;
→ higher highs and higher lows confirm buyer dominance – providing grounds to outline a rising (blue) channel.
On the other hand, the RSI indicator is close to overbought territory, which suggests a possible pullback.
Potential support levels:
→ 1.34900: the breakout point where bulls started their advance;
→ 1.35890: a level that lost its resistance role this week;
→ the upper boundary and median of the blue ascending channel.
Taking all this into account, we could assume that in the near term, bulls may aim to lift GBP/USD towards the upper boundary of the yellow channel. It is also possible that news from the Fed and the Bank of England will aid them on this path.
This article represents the opinion of the Companies operating under the FXOpen brand only. It is not to be construed as an offer, solicitation, or recommendation with respect to products and services provided by the Companies operating under the FXOpen brand, nor is it to be considered financial advice.

GBP/USD Outlook - Momentum Favors the UpsideHi everyone,
As anticipated, GBP/USD broke above the 1.35300 level last week and successfully consolidated it as support. Our outlook for the week ahead remains bullish, with expectations for a continued push higher toward the 1.36850 resistance area.
A decisive break above 1.36850 would bring the next key upside targets into focus, in particular the 1.37890 level. The impulsive rally from the 1st August low continues to underpin our bullish outlook on GBP/USD.
We’ll be monitoring price action closely to see how this structure develops in the sessions ahead.
The longer-term outlook remains bullish, with expectations for the rally to continue extending from the 1.20991 January low toward 1.40000 and 1.41700.
We’ll keep you updated throughout the week with how we’re managing our active ideas.
Thanks again for all the likes, boosts, comments, and follows — we really appreciate the support!
All the best for the week ahead.
Trade safe,
BluetonaFX

GBP/USD - Building Base for Renewed Bullish MomentumHi everyone,
As highlighted in our previous idea, GBP/USD delivered the deeper pullback toward 1.33800 before reversing to the upside and decisively hitting our NFP trade target at 1.35300 last week. However, price lacked the momentum to break and hold above this level.
Looking ahead, we anticipate a renewed attempt at 1.35300 this week from the 1.34580–1.34880 zone. A successful break and retest of support should give GBP/USD the platform to mount a challenge toward the 1.36850 resistance area.
A decisive break above 1.36850 would bring the next key upside targets into focus. The impulsive rally from the 1st August low continues to underpin our bullish outlook on GBP/USD.
We’ll be monitoring price action closely to see how this structure develops in the sessions ahead.
The longer-term outlook remains bullish, with expectations for the rally to continue extending from the 1.20991 January low toward 1.40000 and 1.41700.
We’ll keep you updated throughout the week with how we’re managing our active ideas.
Thanks again for all the likes, boosts, comments, and follows — we really appreciate the support!
All the best for the week ahead.
Trade safe,
BluetonaFX

Market Analysis: GBP/USD Bulls in ControlMarket Analysis: GBP/USD Bulls in Control
GBP/USD started a fresh increase above 1.3500.
Important Takeaways for GBP/USD Analysis Today
- The British Pound is eyeing more gains above 1.3500.
- There is a key bearish trend line forming with resistance at 1.3530 on the hourly chart of GBP/USD.
GBP/USD Technical Analysis
On the hourly chart of GBP/USD, the pair formed a base above the 1.3390 level. The British Pound started a steady increase above 1.3440 against the US Dollar, as discussed in the previous analysis.
The pair gained strength above 1.3465 and the 50-hour simple moving average. It even cleared the 1.3500 handle and tested 1.3530. It is now consolidating gains below 1.3530.
The pair is stable above the 23.6% Fib retracement level of the upward move from the 1.3446 swing low to the 1.3529 high. It seems like the bulls might aim for more gains. The RSI moved above the 50 level on the GBP/USD chart and the pair could soon aim for an upside break above a key bearish trend line at 1.3530.
An upside break above 1.3530 could send the pair toward 1.3545. Any more gains might open the doors for a test of 1.3620. If there is a downside correction, immediate support is near the 1.3500 level and the 50-hour simple moving average.
The first major support could be near the 50% Fib retracement at 1.3485. The next pivot level sits near 1.3445. If there is a break below 1.3445, the pair could extend the decline. In the stated case, it could drop and test 1.3420. Any more losses might call for a move toward 1.3390.
This article represents the opinion of the Companies operating under the FXOpen brand only. It is not to be construed as an offer, solicitation, or recommendation with respect to products and services provided by the Companies operating under the FXOpen brand, nor is it to be considered financial advice.

GBP/USD - Support Intact, Bulls Targeting Fresh HighsHi everyone,
As highlighted in our previous idea, we were looking for a pullback into the 1.34400–1.34750 support zone before a renewed push higher toward the 1.36850 resistance level. While the Cable managed to hold support, it lacked the momentum to break above the 1.35300 level.
Looking ahead, we anticipate a renewed attempt this week, with price likely targeting the 1.36850 resistance area. However, a deeper pullback toward 1.33800 before appreciation remains a scenario firmly on our radar.
A decisive break above 1.36850 would bring the next key upside targets into focus. The impulsive rally from the 1st August low continues to underpin our bullish outlook on GBP/USD.
We’ll be monitoring price action closely to see how this structure develops in the sessions ahead.
The longer-term outlook remains bullish, with expectations for the rally to continue extending from the 1.20991 January low toward 1.40000 and 1.41700.
We’ll keep you updated throughout the week with how we’re managing our active ideas.
Thanks again for all the likes, boosts, comments, and follows — we really appreciate the support!
All the best for the week ahead.
Trade safe,
BluetonaFX

BP/USD Outlook: Pullback into Support Before Next Leg HigherHi everyone,
Despite a fundamentally turbulent week in the markets, our trading delivered a flawless run last week!
As highlighted in our previous idea, GBP/USD extended below the 1.34400–1.34750 zone before finding support above the 1.33800 level; right where we anticipated buyers would step in.
This week, we’re looking for a pullback into our first support zone before a renewed push higher toward the 1.36850 resistance level.
A decisive break above 1.36850 would bring the next key upside targets into focus. The impulsive rally from the 1st August low continues to underpin our bullish outlook on GBP/USD.
We’ll be monitoring price action closely to see how this structure develops in the sessions ahead.
The longer-term outlook remains bullish, with expectations for the rally to continue extending from the 1.20991 January low toward 1.40000 and 1.41700.
We’ll keep you updated throughout the week with how we’re managing our active ideas.
Thanks again for all the likes, boosts, comments, and follows — we really appreciate the support!
All the best for the week ahead.
Trade safe,
BluetonaFX

GBPUSD - Look for Short (INTRADAY) 1:2 It’s been a while since I last shared a trading idea. For this pair, GBPUSD generally moves inversely with the DXY. Currently, the price is consolidating, and a reversal pattern has formed on the higher timeframe, supported by the break of the HTF trendline, though it failed to create a new lower low.
This suggests price may retrace before continuing its bullish move. We could look for shorting opportunities based on price action, but always wait for price to tap into the supply order block before entering.
All the best!
Disclaimer:
This is simply my personal technical analysis, and you're free to consider it as a reference or disregard it. No obligation! Emphasizing the importance of proper risk management—it can make a significant difference. Wishing you a successful and happy trading experience!

GBP/USD Correction Into Support — Bulls Eyeing Next Leg HigherHi everyone,
The impulsive move higher from the 1st August low continues to reinforce our bullish outlook on GBP/USD.
The current correction is approaching the 1.34400–1.34750 zone, where we expect strong support to emerge, potentially setting the stage for a renewed push higher toward the 1.36850 resistance level.
A decisive break above this resistance would bring our next key upside targets into play.
We’ll be monitoring price action closely to see how this develops in the sessions ahead.
The longer-term outlook remains bullish, and we expect the rally to continue extending further from the 1.20991 January low towards 1.40000 and 1.417000.
We’ll be keeping you updated throughout the week with how we’re managing our active ideas.
Thanks again for all the likes/boosts, comments and follows. We appreciate the support! All the best for the week ahead.
Trade safe.
BluetonaFX

Market Analysis: GBP/USD Pushes HigherMarket Analysis: GBP/USD Pushes Higher
GBP/USD is showing strength above 1.3450 and 1.3500.
Important Takeaways for GBP/USD Analysis Today
- The British Pound is attempting a fresh increase above 1.3500.
- There is a key bullish trend line forming with support near 1.3550 on the hourly chart of GBP/USD.
GBP/USD Technical Analysis
On the hourly chart of GBP/USD, the pair remained well-bid above 1.3400. The British Pound started a decent increase above 1.3475 against the US Dollar.
The bulls were able to push the pair above the 50-hour simple moving average and 1.3500. The pair even climbed above 1.3550 and traded as high as 1.3594. Recently, there was a pullback below 1.3575 and the 23.6% Fib retracement level of the upward move from the 1.3399 swing low to the 1.3594 high.
However, the bulls were active near the 1.3520 support. The pair is again rising above 1.3540. There is also a key bullish trend line forming with support near 1.3550.
On the upside, the GBP/USD chart indicates that the pair is facing resistance near 1.3575. The next hurdle for the bulls could be 1.3595. A close above 1.3595 could open the doors for a move toward 1.3640.
Any more gains might send GBP/USD toward 1.3720. On the downside, the bulls might remain active near the same trend line at 1.3550. If there is a downside break below 1.3550, the pair could accelerate lower.
The first major support is at 1.3520, below which the pair could test the 50% Fib retracement at 1.3495. The next key area for the bulls could be 1.3475, below which the pair could test 1.3445. Any more losses could lead it toward 1.3400.
This article represents the opinion of the Companies operating under the FXOpen brand only. It is not to be construed as an offer, solicitation, or recommendation with respect to products and services provided by the Companies operating under the FXOpen brand, nor is it to be considered financial advice.

GBP/USD Bullish Reversal Towards Key Resistance LevelsThe GBP/USD 2-hour chart shows a clear bullish reversal from recent lows, breaking past the downtrend structure. Price is approaching the first target near 1.3540, with the second target projected at 1.3620. Momentum suggests a potential pullback before continuation, supported by higher lows and a strong upward trajectory.
Trend Overview
Current Direction: Bullish momentum after a prolonged downtrend.
Structure: Price has broken above a descending trendline, signaling potential trend reversal.
Pattern: Looks like an inverted head and shoulders formation, supporting upside continuation.
---
Key Levels
Support Zones:
1.3140–1.3160 (recent low & demand area)
1.3250 (minor support after breakout)
Resistance Zones:
1st Target: 1.3540 – aligns with previous swing high and supply zone.
2nd Target: 1.3620 – stronger resistance where sellers may re-enter.
---
Price Action Expectations
Price is currently near 1.3450, approaching the neckline of the prior consolidation zone.
Possible short-term pullback (as shown in your chart) before continuation upward toward the 1st target.
A clean break above 1.3540 with strong volume could open the way to 1.3620.

Market Analysis: GBP/USD Rebounds CautiouslyMarket Analysis: GBP/USD Rebounds Cautiously
GBP/USD is attempting a recovery wave above the 1.3215 resistance.
Important Takeaways for GBP/USD Analysis Today
- The British Pound is attempting a fresh increase above 1.3265.
- There is a contracting triangle forming with resistance at 1.3375 on the hourly chart of GBP/USD.
GBP/USD Technical Analysis
On the hourly chart of GBP/USD, the pair declined after it failed to clear the 1.3600 resistance. As mentioned in the previous analysis, the British Pound even traded below the 1.3350 support against the US Dollar.
Finally, the pair tested the 1.3140 zone and is currently attempting a fresh increase. The bulls were able to push the pair above the 50-hour simple moving average and 1.3215. The pair even climbed above the 1.3265 level.
The bulls were able to push the pair above the 50% Fib retracement level of the downward move from the 1.3385 swing high to the 1.3141 low.
On the upside, the GBP/USD chart indicates that the pair is facing resistance near 1.3375. There is also a contracting triangle forming with resistance at 1.3375 and the 76.4% Fib retracement level of the downward move from the 1.3385 swing high to the 1.3141 low.
The next major resistance is near 1.3385. A close above the 1.3385 resistance zone could open the doors for a move toward 1.3450. Any more gains might send GBP/USD toward 1.3550.
On the downside, there is decent support forming at 1.3265. If there is a downside break below 1.3265, the pair could accelerate lower. The first major support is near the 1.3215 level. The next key support is seen near 1.3140, below which the pair could test 1.3050. Any more losses could lead the pair toward 1.3000.
This article represents the opinion of the Companies operating under the FXOpen brand only. It is not to be construed as an offer, solicitation, or recommendation with respect to products and services provided by the Companies operating under the FXOpen brand, nor is it to be considered financial advice.

GBP/USD Longs to Shorts GU has been very bearish recently and is currently reacting from a clean demand zone with multiple confluences. While we may see a short-term push to the upside, I’ll be watching to see if price reaches the 3hr supply zone sitting at a premium level.
If price does reach that zone, I’ll be on the lookout for signs of Wyckoff distribution and a slowdown in momentum, which could signal the start of another bearish leg.
Confluences for GU Shorts:
Overall bearish trend remains intact — this is a pro-trend setup
Price may retrace to mitigate a 3hr supply zone
Liquidity to the downside still needs to be taken
Current demand zone may simply serve as a trigger for a retracement up to supply
P.S. If price fails to reach the supply zone and continues dropping, we’ll likely see a new break of structure and the formation of a fresh nearby supply zone, which we can then trade from.
Let’s stay sharp and have a profitable trading week ahead! 🔥📊💰

Market Analysis: GBP/USD Dips FurtherMarket Analysis: GBP/USD Dips Further
GBP/USD started a downside correction from the 1.3620 zone.
Important Takeaways for GBP/USD Analysis Today
- The British Pound started a fresh decline and settled below the 1.3500 zone.
- There is a connecting bullish trend line forming with support at 1.3415 on the hourly chart of GBP/USD at FXOpen.
GBP/USD Technical Analysis
On the hourly chart of GBP/USD at FXOpen, the pair struggled above the 1.3600 zone. The British Pound started a fresh decline below the 1.3550 pivot level against the US Dollar, as discussed in the previous analysis.
The pair dipped below the 1.3500 and 1.3450 levels. A low was formed at 1.3364 and the pair is now consolidating losses. On the upside, it is facing resistance near the 1.3475 level. The next key resistance is near 1.3490 and the 50% Fib retracement level of the downward move from the 1.3619 swing high to the 1.3364 low.
An upside break above the 1.3490 zone could send the pair toward 1.3520 and the 61.8% Fib retracement level.
More gains might open the doors for a test of 1.3620. If there is another decline, the pair could find support near the 1.3415 level and a connecting bullish trend line. The first major support sits near the 1.3365 zone.
The next major support is 1.3350. If there is a break below 1.3350, the pair could extend the decline. The next key support is near the 1.3320 level. Any more losses might call for a test of 1.3250.
This article represents the opinion of the Companies operating under the FXOpen brand only. It is not to be construed as an offer, solicitation, or recommendation with respect to products and services provided by the Companies operating under the FXOpen brand, nor is it to be considered financial advice.

GBP/USD Rate Falls to Key Support LevelGBP/USD Rate Falls to Key Support Level
As of today, the GBP/USD chart indicates that the British pound has declined by more than 2% against the US dollar since the beginning of July. Notably, the pace of the decline accelerated on Friday and continued into Monday.
According to Reuters, the pound is under pressure due to market concerns over a potential economic slowdown amid an escalating trade war. Last week’s data confirmed a contraction in UK GDP, which could have far-reaching implications. In this context, criticism of the UK government’s failure to reduce public spending is becoming more pronounced.
What’s next for GBP/USD?
Technical Analysis of the GBP/USD Chart
From a bullish perspective, it is worth noting that the pair has fallen to a significant support level around 1.3425. This level previously acted as resistance in the spring, but after a breakout, it has now turned into support (as indicated by arrows on the chart). Additionally, the RSI indicator shows strong oversold conditions, which suggests a potential short-term rebound.
From a bearish standpoint, it is concerning that the sharp rally from point A to point B has been entirely erased by the July decline. This indicates that despite significant gains by the bulls, they failed to hold them—casting doubt on GBP/USD's ability to sustain growth in the medium term.
Ongoing pressure may lead to an attempt by bears to push GBP/USD below the June low at point A. However, it is also possible that bearish momentum will weaken thereafter, potentially leading to a recovery within the developing downward channel (marked in red).
This article represents the opinion of the Companies operating under the FXOpen brand only. It is not to be construed as an offer, solicitation, or recommendation with respect to products and services provided by the Companies operating under the FXOpen brand, nor is it to be considered financial advice.
GBP/USD Outlook: Can Buyers Step Back In?Hi everyone,
GBP/USD continues to consolidate below the 1.36200 level, with multiple failed attempts to break higher confirming this area as firm resistance for now. Following the rejection, price moved lower into the 1.35300–1.34600 demand zone, where we’re watching closely for signs of renewed buying interest.
This area has previously acted as a support base, and a reaction here could set the stage for another push higher. However, if buyers fail to step in, there is scope for a deeper retracement before the next attempt to reclaim resistance. We’ll be monitoring the price action closely to see which scenario plays out.
A drop into this area was highlighted as the more probable short‑term path, and we’re now looking for GBP/USD to find support in this region; and more importantly, to hold above the 1.33800 level to form the base for another push higher.
As previously noted, a decisive break above 1.37500 would renew our expectation for further upside, with the next key target around 1.38400. We'll be monitoring price action closely to see how it unfolds.
We’ll continue to provide updates on the projected path for GBP/USD as price approaches this target.
The longer-term outlook remains bullish, and we expect the rally to continue extending further from the 1.20991 January low towards 1.40000 and 1.417000.
We’ll be keeping you updated throughout the week with how we’re managing our active ideas. Thanks again for all the likes/boosts, comments and follows — we appreciate the support!
All the best for the week ahead. Trade safe.
BluetonaFX
