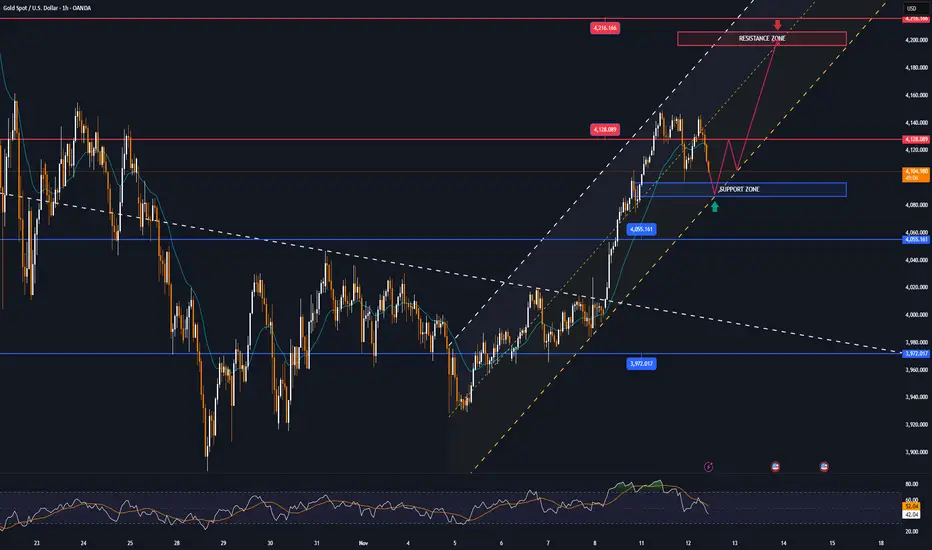
XAUUSD starting a new short-term Bullish LegGold (XAUUSD) is testing today once more its 4H MA50 (blue trend-line). Having held the Higher Lows trend-line two times already since the November 13 pull-back, a second break above the 4H MA50 can technically confirm a quick test of the Lower Highs trend-line of the Triangle. As a result, our short-term Target is 4180 (also just below the 0.618 Fibonacci retracement level).
A closing above the Lower Highs trend-line, potentially means the emergence of a Channel Up (blue), in which case we will re-buy the first 4H pull-back and have a final Target at 4275 (the 0.786 Fib). Long-term we believe Gold is going to have a bearish 2026.
---
** Please LIKE 👍, FOLLOW ✅, SHARE 🙌 and COMMENT ✍ if you enjoy this idea! Also share your ideas and charts in the comments section below! This is best way to keep it relevant, support us, keep the content here free and allow the idea to reach as many people as possible. **
---
💸💸💸💸💸💸
👇 👇 👇 👇 👇 👇
Gc1!!

GOLD market after “Fed fever”, growth momentum is challengedOANDA:XAUUSD prices remain in the spotlight as the market has been experiencing a series of strong fluctuations following mixed signals from the Federal Reserve and labor data. However, developments show that the risk of price declines is increasing as the precious metal has repeatedly failed in its efforts to hold the $4,100/ounce area, the first resistance level of this year's hot period.
For most of 2025, gold has risen more than 55%, despite high bond yields and a strong dollar. But as the Fed’s final policy meeting approaches and the market lacks consensus on the path of interest rate cuts, the traditional correlation between gold, interest rates, and the dollar is returning. According to CME’s FedWatch, the market still expects a more than 70% chance of the Fed cutting interest rates next month, while economists maintain a more cautious assessment of only about 50/50.
This puts the upcoming economic data in a decisive position for both market expectations and gold’s stability in this trading week.
Fed’s Dovish Return: A Direct Impact on Gold’s Upward Momentum OANDA:XAUUSD
Gold settled in the first half of the week as demand for havens increased, while the ADP report showed that the private sector cut an average of 2,500 jobs per week in the four weeks to November 1.
The 4,000 USD/ounce level continues to be the key threshold determining the short-term trend, as the market is moving within a correction zone but has not yet broken the medium-term bullish structure.
Technical analysis and suggestions OANDA:XAUUSD
1. Price Structure & Overall Trend
• Price is still within the ascending channel that has extended since August, although the range has narrowed compared to October. The October peak around 4,128 USD acts as a major medium-term resistance.
• The current decline is still only a pullback within the uptrend, as long as price holds above 3,972 USD (Fib 0.382) and especially the 4,000 USD psychological & technical support.
2. Key Technical Zones
• Nearest resistance: 4,128 – 4,216 USD
(A strong resistance cluster where price has been repeatedly rejected in November.)
• Nearest support: 4,055 – 4,000 USD
(This zone aligns with Fib 0.382 and the short-term bottom.)
• Deeper supports:
3,846 USD (Fib 0.5) – Important for a deep pullback scenario
3,720 USD (Fib 0.618) – Reaction support in case of strong macro volatility
3. Price Momentum – RSI
• RSI has moved out of oversold territory but remains weak and has not re-established a bullish structure.
• The RSI-MA21 is flat → the market lacks strong momentum; sideways movement or a retest of the 4,000 USD zone is highly likely.
4. Short-Term Outlook (Next Week)
• Market bias: Neutral to slightly bearish, but the medium-term uptrend remains intact.
• Price is likely to retest 4,000 USD, then form one of two scenarios:
o Hold 4,000 → rebound to 4,128 – 4,216 USD
o Break 4,000 → drop to 3,972 – 3,846 USD
👉 Conclusion: 4,000 USD is the decisive level for the short-term trend.
BUY XAUUSD PRICE 4102 - 4100⚡️
↠↠ Stop Loss 4106
→Take Profit 1 4094
↨
→Take Profit 2 4088
SELL XAUUSD PRICE 4016 - 4018⚡️
↠↠ Stop Loss 4012
→Take Profit 1 4024
↨
→Take Profit 2 4030

Weekly Market Forecast: Indices Are Weak! Wait For Sells!In this Weekly Market Forecast, we will analyze the S&P 500, NASDAQ, Gold and Silver futures, for the week of Nov 24-29th.
Enjoy!
May profits be upon you.
Leave any questions or comments in the comment section.
I appreciate any feedback from my viewers!
Like and/or subscribe if you want more accurate analysis.
Thank you so much!
Disclaimer:
I do not provide personal investment advice and I am not a qualified licensed investment advisor.
All information found here, including any ideas, opinions, views, predictions, forecasts, commentaries, suggestions, expressed or implied herein, are for informational, entertainment or educational purposes only and should not be construed as personal investment advice. While the information provided is believed to be accurate, it may include errors or inaccuracies.
I will not and cannot be held liable for any actions you take as a result of anything you read here.
Conduct your own due diligence, or consult a licensed financial advisor or broker before making any and all investment decisions. Any investments, trades, speculations, or decisions made on the basis of any information found on this channel, expressed or implied herein, are committed at your own risk, financial or otherwise.

XAU/USD ANALYSIS 11/24/20251. Fundamental Analysis:
a) Economy:
• USD:
The USD is stabilizing after a recent period of weakness as markets expect the Fed to maintain lower interest rates in 2025, reducing pressure on gold.
• US Stock Market:
U.S. equities are seeing slight corrections, reflecting cautious sentiment ahead of this week’s FOMC minutes. When stocks stall, gold often benefits.
• FED:
Recent weak economic data has increased expectations that the Fed will cut rates earlier in 2025. Any dovish signals from the Fed will support gold prices.
• TRUMP Administration:
The Trump administration is considering a new economic stimulus package and adjustments to import taxes. Protectionist-leaning policies may cause volatility in the USD, but generally increase safe-haven demand — supporting gold.
• Gold ETF (SPDR):
SPDR has recently shown mixed buying and selling, indicating capital flows are not yet surging but also no longer experiencing heavy outflows. This is a neutral signal but slightly supportive of price stability.
b) Politics:
Tensions in the Middle East and concerns about the upcoming EU elections keep defensive capital flows active. These factors help support gold and limit the risk of deep declines.
c) Market Sentiment:
The market is in a mild risk-off state, with capital shifting toward safe assets, though not strongly yet. This aligns with gold maintaining its base and having the potential to break out if key technical levels are breached.
2. Technical Analysis:
• Price is maintaining a long-term uptrend line from early November.
• A compression triangle pattern has been broken to the upside — a clear bullish signal.
• The 4,064 level is a key retest zone currently being tested.
• If this zone holds, upside targets will expand.
• RSI on the M30 timeframe is in a balanced zone, not overbought — favorable for further upside movement.
Conclusion: The trend leans bullish as long as price does not break below the trendline and the 4,029 zone.
RESISTANCE: 4,096 – 4,125 – 4,193
SUPPORT: 4,029 – 4,000 – 3,964
3. Yesterday’s Market (21/11/25):
• Gold fluctuated strongly from the 4,029 support area and bounced back along the trendline.
• Buyers dominated late in the session, setting up a foundation for today’s recovery.
• Volatility has been narrowing, signaling a potential breakout.
4. Strategy for Today (24/11/25):
🪙 SELL XAUUSD | 4147 – 4145
SL: 4153
TP1: 4137
TP2: 4129
🪙 BUY XAUUSD | 3964 – 3966
SL: 3960
TP1: 3972
TP2: 3978

GOLD MARKET ANALYSIS AND COMMENTARY - [Nov 24 - Nov 28]This week, the international OANDA:XAUUSD price continued to hold above the support level of 4,000 USD/oz, but the risk of price decline is increasing due to geopolitical tensions and expectations that the FED will cut interest rates at the December meeting is not enough to create a strong rebound for gold prices.
The gold price next week may continue to fluctuate in a narrow range, waiting for US economic data to clarify the FED's interest rate reduction roadmap.
Retail sales and producer price index (PPI) reports, along with other data due next week, could help us get a better idea of the US economic situation. If the US economic data is below expectations, it could increase expectations for a Fed rate cut in December, pushing gold back above $4,100/oz next week. However, if these data continue to reduce expectations for a Fed rate cut, gold could break the important support level of $4,000/oz next week, opening the door to $3,845-$3,800/oz.
However, in the long term, gold prices are still expected to continue to rise as central banks continue to buy, although the pace of buying may slow down due to the high gold price. Moreover, gold has proven its value, even when compared to other stores of value such as cryptocurrencies, due to the sharp decline of bitcoin and many other cryptocurrencies. Therefore, the appeal of gold is still very large and has no rivals in the financial investment environment.
📌Technically, on the H4 chart, an important support level is established around the 4,000 USD/oz threshold. If this level is broken, the gold price is at risk of falling deeply to 3,900 or even 3,850 USD/oz. In case the gold price forms a double bottom pattern at 4,000 and breaks through the 4,132 resistance level, there is a chance to recover above the 4,200 USD/oz threshold.
SELL XAUUSD PRICE 4176 - 4174⚡️
↠↠ Stop Loss 4180
BUY XAUUSD PRICE 3964 - 3966⚡️
↠↠ Stop Loss 3960

GOLD rises amid uncertain signals from US economyOANDA:XAUUSD continued to rise in Wednesday's session, as investors increased their holdings of safe-haven assets amid the delay of US employment data due to the government shutdown and the market prepared for the minutes of the Federal Reserve's October meeting.
As of the morning of November 20, spot gold was trading around $4,078/ounce, up about $11, or 0.27%, from the previous day.
Gold's rise coincided with the stabilization of global stocks after a sell-off related to concerns about artificial intelligence valuations. However, investor sentiment remained cautious ahead of Nvidia's business results and a series of US economic data due this week.
Weakening labor market signals support OANDA:XAUUSD
Data released on Tuesday showed the number of Americans receiving unemployment benefits rose to a two-month high in mid-October, a sign that the labor market may be losing momentum.
Against this backdrop, any signs of labor market weakness would reinforce expectations that the Fed may have to ease policy more quickly, providing support for gold, a non-yielding asset that benefits from lower interest rates.
Market focus: Fed minutes and delayed jobs data
Investors are turning their attention to the minutes from the Fed’s October meeting, due at 2 p.m. ET. Despite the 25 basis point cut at its most recent meeting, Chairman Jerome Powell continued to maintain a cautious stance, leaving open the possibility of a pause in easing if inflation risks return.
Separately, the September jobs report, delayed by the government shutdown, is due out on Thursday. This is seen as an early indicator of economic growth strength, with Reuters forecasting non-farm payrolls to rise by around 50,000 jobs.
Any weaker-than-expected figure could boost haven demand and continue to support gold prices.
Rising interest rate cut expectations, a key driver of OANDA:XAUUSD
According to CME FedWatch, the market now rates a 51% chance of the Fed cutting rates again at its next meeting, up from 46% in the previous session.
This increase in expectations is the core factor triggering capital flows to gold, in the context of falling real yields and investors looking for value preservation as the growth outlook becomes more uncertain.
TECHNICAL ANALYSIS AND SUGGESTIONS OANDA:XAUUSD
After recovering from the bottom around $4,000, gold price hit the 0.236 Fibonacci retracement at $4,128 and was immediately rejected, showing that profit-taking pressure is still strong.
• The main trend is still up, as the price is still in the medium-term uptrend channel and above the important MA line.
• The 3,972 area (Fib 0.382) is acting as short-term support, accompanied by the MA line right below around 3,942.
• Since it has not been able to break the 0.382 Fib level, gold is currently not in the best condition for a new uptrend.
RSI has rebounded but has not yet exceeded 60, showing that the buyers have not fully returned, but there are no signs of strong weakness.
SELL XAUUSD PRICE 4108 - 4106⚡️
↠↠ Stop Loss 4112
→Take Profit 1 4100
↨
→Take Profit 2 4094
BUY XAUUSD PRICE 3982 - 3984⚡️
↠↠ Stop Loss 3978
→Take Profit 1 3990
↨
→Take Profit 2 3996

GOLD $GC Levels and Patterns AnalysisTraders and Investors,
Gold (XAUUSD) has been consolidating mostly but still has been giving a lot of great short term and swing trade opportunities.
I have updated the important levels and zones which can act as support and resistance. They should guide us a bit for the best possible trade opportunities.
There as possible W pattern forming. It has not formed or completed yet. It must first break the trend line and confirm the break. BTW, that trend line can also give us a good opportunities around it. Next, the price has to break the mid point of potential W pattern. Once it has done that, it can complete the W pattern.
Trade what you see, wait for the confirmations and manage the risk as always.
Follow for more. Please support this analysis by liking, commenting, and sharing with friends, colleagues, traders, and trading communities. Thanks👍🙂

COPPER / GOLD & ISM PMI = Critical For AltseasonBeen seeing a lot of commentary on COPPER / GOLD.
This is a strong indication of industrial growth in the economy, as the demand for copper rises with build-outs.
The ISM PMI has a very strong correlation with C/G, also showing strength in the economy, as consumers buy more which gives businesses the ability to expand operations.
In a nutshell, these charts portray “Retail” ie “Main Street”.
There’s a very real possibility that we do not get our typical Alt Season at all this cycle if C/G & ISM PMI do not have a violent move up in the next few months. (more on this later)
The last time we saw such a divergence between these two was in January 2016 where it took C/G ~230 days to turn-up.
This would put Alt-Season Q4 ’26 - Q1 ’27, which makes sense theoretically based on Trump’s suspected stimulus plans which would come right before mid-terms.
This would give us our typical year-long bear market which has snuck up on us all because we lacked the retail euphoria phase due to very weak retail participation.
HOPIUM:
In 2016 When the ISM climbed above 50, COPPER soon found a bottom and Alts ripped.
Notice the bullish divergence on the RSI during that time, same as we are seeing now.
It looking like C/G may have found a bottom on this multi-decade parallel channel.
*Our livelihood depends on the ISM showing immense strength in the coming months so that C/G can follow.

Defensive money returns to GOLD as US labor data worsensOANDA:XAUUSD prices maintained a slight decline in the Asian session, trading around $4,075/ounce as the market turned its attention to the Fed meeting minutes. The upside momentum is weakening, but downside pressure remains limited as money flows continue to seek support from the prospect of easing policy.
New data from ADP reinforces the view that the US labor market is losing momentum. The private sector lost an average of 2,500 jobs a week in the four weeks to November 1, as a host of large companies from Amazon to Target announced plans to cut staff. A report from Challenger showed the number of planned layoffs in October was the highest in more than two decades. Jobless claims rose to 1.9 million, and data from the Cleveland Fed showed 39,000 layoff announcements last month.
These signals are emerging just as the market remains concerned about a weakening U.S. economy, even though expectations for rate cuts are not yet firmly established. Still, sentiment has shifted: the FedWatch tool now shows nearly a 50% probability of a rate cut at the Fed’s December meeting, up from below 40% earlier this week. This development has helped gold rebound after three consecutive losing sessions, especially since the precious metal typically benefits in a low-rate environment.
However, gold’s recovery remains relatively fragile. Prices fell more than 3% on Friday and dropped another 1% on Monday as expectations for Fed easing were revised. This has made the market more sensitive to signals from monetary policy and economic data.
The short-term focus is on the minutes of the late-October FOMC meeting and the upcoming nonfarm payrolls report, both to be released this week. Forecasts suggest U.S. job growth may slow to around 55,000 in September—a pace reflecting cooling hiring demand.
Several Fed officials have struck a more dovish tone. Governor Waller described the labor market as “weak” and noted that core inflation is moving closer to the 2% target. Richmond Fed President Thomas Barkin expects upcoming data to offer more clues on the direction of the economy. These comments, combined with the market’s interpretation of soft labor signals, are creating an environment in which each new data point has the potential to significantly impact gold pricing.
In my view, gold is likely to continue trading within a narrow range as the market awaits clearer confirmation from the Fed while simultaneously assessing the risks of a slowing U.S. economy. Rate-cut expectations remain the key factor supporting gold in the current phase.
Technical analysis and suggestions OANDA:XAUUSD
Recovery Trend and Conditions for a New Uptrend
This morning's developments show that gold prices are trying to recover after a long correction, with a bounce back to the $4,070/ounce area, corresponding to the lower border of the medium-term Ascending Channel.
The price structure has remained within the uptrend channel since August, but the momentum has weakened significantly after the price failed twice before the strong resistance zone of $4,216/ounce (Fib 0.236). The $3,972–$3,990/ounce (Fib 0.382) level continues to act as an important buffer zone, and the fact that the price did not break this zone in the recent decline is a positive signal.
RSI hit the oversold zone and is bouncing up, indicating that selling pressure is weakening and the market is entering a rebalancing phase.
For a new uptrend to form, it is necessary:
Necessary condition: price holds above 3,972 USD/ounce, remaining above the rising trend line of the price channel.
Sufficient condition: close above 4,128 USD/ounce and then confirm above 4,216 USD/ounce, the key resistance zone that determines the return to a strong uptrend.
Only when these two conditions are met, the medium-term uptrend structure will be fully restored.
SELL XAUUSD PRICE 4116 - 4114⚡️
↠↠ Stop Loss 4120
→Take Profit 1 4108
↨
→Take Profit 2 4102
BUY XAUUSD PRICE 4025 - 4027⚡️
↠↠ Stop Loss 4021
→Take Profit 1 4033
↨
→Take Profit 2 4039

Gold Holds $4000Gold has retraced lower from last week’s high, though it is holding above 4000 for now. Two bullish pinbars have also formed on the daily chart, hinting at a potential swing low. A break above yesterday’s high could see bulls target the 4200 handle, with a move through the 4250 high bringing the 4300 handle and monthly S1 into view.
However, keep in mind the weekly chart may be forming a Wave B within a broader ABC correction. I’ll also be watching for signs of a swing high on the daily chart and a potential resumption of the move lower from the record high. A 100% projection of Wave A from B implies a downside target near 3800.
Matt Simpson, Market Analyst at City Index.

GOLD MARKET ANALYSIS AND COMMENTARY - [Nov 17 - Nov 21]Last week, OANDA:XAUUSD prices rose from $3,999/oz to $4,245/oz, but then fell sharply to $4,032/oz and closed the week at $4,084/oz.
The reason gold prices rose sharply last week after news of the US government reopening was because White House press secretary Karoline Leavitt said the Bureau of Labor Statistics (BLS) may never release October employment and inflation data because the federal government was shut down during this period, not doing statistical work. These comments put the USD under selling pressure, pushing gold prices above $4,200/oz.
However, hawkish comments from Fed officials later pushed gold prices down sharply to $4,032/oz. Specifically, St. Louis Fed Governor Alberto Musalem said that the labor market is expected to remain at near full employment and the Fed needs to be cautious in operating monetary policy at this time. Meanwhile, Minneapolis Fed Governor Neel Kashkari emphasized that inflation is still too high, meaning the Fed should pause interest rate cuts.
The sharp decline in market expectations of a Fed rate cut in December may continue to have a negative impact on gold prices in the short term. However, gold prices will hardly fall sharply as macro risks and geopolitical conflicts persist and central banks’ demand for gold continues to increase.
📌According to technical analysis, the support level for gold prices next week is at 3,930 USD/oz. If it holds above this level, gold prices will continue to hover around 4,000 USD/oz in the short term. However, if gold prices fall below this level next week, they may fall to the 3,800 USD/oz area.
SELL XAUUSD PRICE 4176 - 4174⚡️
↠↠ Stop Loss 4180
BUY XAUUSD PRICE 3949 - 3951⚡️
↠↠ Stop Loss 3945

XAUUSD Far from signaling a BUY yet.Gold (XAUUSD) has been trading within a +1 year Channel Up and has found itself on a correction (Bearish Leg) since it's All Time High (ATH), which was a Higher High for the pattern, 1 month ago.
Despite this -11% Bearish Leg so far, it hasn't even broken yet below its 1D MA50 (blue trend-line), which is something it has done on both previous Bearish Legs. As you can see those have been fairly similar to the current one (-10.92% and -9.32% respectively). All started after roughly +40% Bullish Legs led to those.
Notice also that both Bullish Legs had to test the 1D MA100 (green trend-line) before the started. At the same time the 1W RSI hit its Buy Zone.
As a result, Gold hasn't waved a buy signal yet.
---
** Please LIKE 👍, FOLLOW ✅, SHARE 🙌 and COMMENT ✍ if you enjoy this idea! Also share your ideas and charts in the comments section below! This is best way to keep it relevant, support us, keep the content here free and allow the idea to reach as many people as possible. **
---
💸💸💸💸💸💸
👇 👇 👇 👇 👇 👇

GOLD: The Daily and Weekly +FVGs Hold The Key! In this Weekly Market Forecast, we will analyze the Gold (XAUUSD) for the week of Nov. 17-21st.
Gold is still strong, but struggled to move higher last week. It is currently inside a bullish FVG, and this would be the key PD Array to watch. If the market shows respect to the +FVG, then expect higher prices. If it fails, and we see the market close below it on a daily close basis, buys should be avoided until the Weekly +FVG is reached.
Enjoy!
May profits be upon you.
Leave any questions or comments in the comment section.
I appreciate any feedback from my viewers!
Like and/or subscribe if you want more accurate analysis.
Thank you so much!
Disclaimer:
I do not provide personal investment advice and I am not a qualified licensed investment advisor.
All information found here, including any ideas, opinions, views, predictions, forecasts, commentaries, suggestions, expressed or implied herein, are for informational, entertainment or educational purposes only and should not be construed as personal investment advice. While the information provided is believed to be accurate, it may include errors or inaccuracies.
I will not and cannot be held liable for any actions you take as a result of anything you read here.
Conduct your own due diligence, or consult a licensed financial advisor or broker before making any and all investment decisions. Any investments, trades, speculations, or decisions made on the basis of any information found on this channel, expressed or implied herein, are committed at your own risk, financial or otherwise.

GOLD: Look For Bullish Breakout From The +FVGIn this Weekly Market Forecast, we will analyze the Gold (XAUUSD) for the week of Nov. 10-14th.
Gold has been consolidating in a +FVG since last week... and it is still holding! Wait for price to break the high of the consolidation and then look for long setups.
Be mindful that price may sweep the sell side LQ before it moves higher.
Enjoy!
May profits be upon you.
Leave any questions or comments in the comment section.
I appreciate any feedback from my viewers!
Like and/or subscribe if you want more accurate analysis.
Thank you so much!
Disclaimer:
I do not provide personal investment advice and I am not a qualified licensed investment advisor.
All information found here, including any ideas, opinions, views, predictions, forecasts, commentaries, suggestions, expressed or implied herein, are for informational, entertainment or educational purposes only and should not be construed as personal investment advice. While the information provided is believed to be accurate, it may include errors or inaccuracies.
I will not and cannot be held liable for any actions you take as a result of anything you read here.
Conduct your own due diligence, or consult a licensed financial advisor or broker before making any and all investment decisions. Any investments, trades, speculations, or decisions made on the basis of any information found on this channel, expressed or implied herein, are committed at your own risk, financial or otherwise.

GOLD volatility, monetary policy and political riskThe global OANDA:XAUUSD went through a volatile trading session on Tuesday, as prices fell more than $50 in the North American session before recovering around $30, ending the day in the green. As of Wednesday morning, November 12, spot gold stood at around $4,128/ounce, up around $2 on the day.
The main drivers of this development came from two opposing factors: the prospect of the Federal Reserve (Fed) possibly cutting interest rates in December, and capital withdrawals from gold ETFs after a long rally.
Policy pressures and labor market signals
U.S. private payrolls data, according to preliminary estimates from ADP Research, showed a weekly average of 11,250 job cuts in the four weeks ended October 25. The weaker-than-expected figure sent the dollar to a low of 99.29, giving gold a chance to rebound.
The move comes just as Washington is about to end its longest government shutdown in history, which has stalled the release of economic data. Investors are hoping the reopening of the government will quickly bring a wave of pent-up data that will help better determine the true state of the U.S. economy.
“As the government reopens, we’re going to start seeing more cracks in the economy,” said Marc Chandler, chief strategist at Bannockburn Global Forex. This expectation reinforces the belief that the Fed will begin its easing cycle in December. According to the CME FedWatch tool, the probability of a rate cut has risen to 64%, while Fed Governor Milan hinted at the possibility of a 50 basis point cut due to a weak labor market and slowing inflation.
ETF Profit Taking, Gold Temporarily Adjusts
However, gold’s rally was capped by profit-taking in the ETF market. Bloomberg data shows gold ETFs have seen four straight weeks of outflows, after eight weeks of net buying. “Every 1% move in the gold price translates into about 10 tonnes of ETF outflows,” said Michael Haigh, head of FIC research at Société Générale.
The reversal reflects investors’ defensive sentiment after gold peaked at $4,380 an ounce in mid-October, a new record high amid political uncertainty and expectations of lower interest rates. Still, safe-haven demand was strong enough to help prices recover to $4,126.77 by the end of Tuesday’s session, up 0.3%.
US Politics: A lull ahead of data
The US Senate has passed a deal to reopen the government, while the Republican-controlled House is expected to approve it this week, before it goes to the White House for President Trump to sign into law. The reopening of the government not only ends the government shutdown but also sets the stage for a new cycle of data releases, including official jobs and inflation reports.
Medium-term outlook: Gold demand remains strong
Despite short-term volatility, fundamentals remain supportive of gold. The precious metal has risen more than 55% year-to-date, on track for its biggest gain since 1979. “The medium-term support from global easing to central bank demand remains intact,” said Christopher Wong, a strategist at OCBC.
Summary
The gold market is operating in a cycle of monetary policy expectations and geopolitical safe-haven sentiment. As the Fed moves closer to easing and delayed data looms, price volatility is likely to remain high.
However, with sustained central bank buying and global risks remaining intact, gold remains a strategic asset in a reshaping global financial landscape.
Technical analysis OANDA:XAUUSD
Gold prices are maintaining a short-term uptrend channel formed from the October bottom. After a deep correction around $3,970 – $3,850/ounce (corresponding to the Fibonacci levels of 0.382 and 0.5), the price has bounced back and is currently trading around $4,123, close to the technical resistance zone of Fib 0.236 at $4,128.
The moving average (MA21) is currently at $4,055, acting as a dynamic support zone in the short term. The recent candlestick structure shows that the bullish momentum is being consolidated with a series of higher lows, while the RSI has recovered towards 55, confirming that the bullish momentum is regaining the upper hand.
If gold holds above the $4,055 zone, the next upside targets are:
• Near resistance: $4,216 – $4,220 (psychological level and 0.236 Fibonacci resistance zone).
• Extended resistance: $4,308 – $4,380 (historic old peak zone).
On the contrary, if the price loses $4,055, the $3,972 – $3,846 zone will become the main support zone to watch, corresponding to the lower boundary of the current uptrend channel.
The overall trend remains bullish, provided the $4,055 support zone holds. The current phase is a recovery accumulation phase, which could open up a further rally towards $4,300 if US economic data continues to be weak and the Fed reinforces easing expectations.
SELL XAUUSD PRICE 4201 - 4199⚡️
↠↠ Stop Loss 4205
→Take Profit 1 4193
↨
→Take Profit 2 4187
BUY XAUUSD PRICE 4090 - 4092⚡️
↠↠ Stop Loss 4086
→Take Profit 1 4098
↨
→Take Profit 2 4105
XAUUSD : 4H Elliott wave at correction stageNow Correction stage
Short-term pattern :
Long to zone 4045 - 4193
Invalid if drops below 3884
Buy entry zone 3945-3975 if it breaks the yellow trendline
, will double confirm to C and end of X
Stop loss 3884
(If it can meet that green arrow zone, we wait and see a rejection candle for short again)
PS.
Medium-term pattern: Gold should drop below 3885, and wait for its reversal to get the bullish Long-term trend again

GOLD surpasses $4,140/ounce, signaling a new cycleOANDA:XAUUSD continued to climb in the Asian session on November 11, trading around $4,148/ounce, up $32 in the morning alone, after rising nearly 3% in the previous session. The two-day rally, the strongest since May, reflects the defensive sentiment of global investors in the face of a weakening US economic outlook and the possibility of the Federal Reserve (Fed) soon shifting monetary policy.
Bloomberg said gold maintained its gains after the US Senate approved a bipartisan deal to end the longest government shutdown in history, supported by President Donald Trump. The bill is expected to pass the House of Representatives this week by a 60-40 vote, paving the way for the resumption of work for hundreds of thousands of federal workers and stalled food aid.
The political situation has eased somewhat, but investors remain cautious. The reopening of the government means that a slew of delayed economic data will soon be released, which could shed more light on the growth picture. Bloomberg analysts said the upcoming data “are likely to show a worsening economic outlook,” reinforcing expectations for a Fed rate cut sooner than expected.
The probability of a 25 basis point cut in December is now above 65%, according to CME's FedWatch tool. Falling bond yields and a weak dollar have pushed money back into gold, the traditional safe haven, especially as the global rate-hike cycle ends and US fiscal risks emerge.
In the international market, gold is still up more than 50% since the beginning of the year, despite a short-term correction last month. Net buying from central banks, especially in Asia and the Middle East, and increased physical gold investment in the private sector, continue to be the core drivers for the prolonged bull cycle.
Commentary: Gold’s Return as a Barometer of US Economic Confidence
Gold’s November rally was more than a short-term political response. It reflected a deeper shift in global market sentiment: that the US dollar is losing its primacy amid rising debt, fiscal spending and domestic political divisions.
While U.S. stock markets hover around historic highs, institutional investors are beginning to rebalance their portfolios in a defensive direction, increasing their exposure to precious metals and government bonds. At the same time, central banks in China, India and Turkey continue to accumulate gold, a move that makes both financial and geopolitical sense, as they seek to reduce their dependence on the dollar payment system.
If the Fed does ease later in the year, gold could consolidate above $4,000 an ounce as a new price level, while risk assets face correction pressure. In an era where U.S. financial stability is no longer a given, the precious metal is returning to its old role as a gauge of confidence in the U.S. currency and government.
Technical analysis OANDA:XAUUSD
Gold prices are consolidating above the $3,970–$3,850/oz support zone, after bouncing back from the 0.382 Fibonacci line ($3,972) and remaining within the rising price channel (channel a) formed since July. The price structure suggests that a correction has been completed, as the recovery in buying pressure pushed the price above the short-term MA around $4,055, towards the 0.236 Fibonacci level at $4,128, which is currently a key short-term resistance zone.
The RSI has recovered from the 40 zone to near 60, indicating a return of bullish momentum, while recent daily candles have all closed above the medium-term uptrend line. A firm close above $4,130 could confirm the bullish trend, opening a new bullish cycle with the next target at $4,216, and further to the $4,380/oz zone, the upper end of the current price channel. Conversely, a loss of $3,940 would weaken the bullish structure and send gold back to the $3,850–$3,870 accumulation zone.
• Observation:
Gold is showing signs of forming a new base above the $4,000 area, reinforcing the scenario of a medium-term bullish cycle if it breaks the $4,130 resistance. Short-term profit-taking pressure may appear, but the main trend is currently leaning positive in the second half of November.
SELL XAUUSD PRICE 4180 - 4178⚡️
↠↠ Stop Loss 4184
→Take Profit 1 4172
↨
→Take Profit 2 4166
BUY XAUUSD PRICE 4088 - 4090⚡️
↠↠ Stop Loss 4084
→Take Profit 1 4096
↨
→Take Profit 2 4102

XAUUSD Has it started a Bear Cycle according to the Dollar??Gold (XAUUSD) may be rising early into the week on news of a potential U.S. government opening but remains heavily rejected from the Highs of the past 3 weeks.
At the same time, the U.S. Dollar Index (DXY illustrated by the black trend-line) has been staging its first legitimate bottom since December 2020 and is rebounding. That DXY's bottom came a few months after Gold's top for that Cycle. The result was the start of Gold's new 2-year Bear Cycle.
In fact that DXY bottoming pattern was also present in 2011, right before Gold topped this time. This suggests that the current DXY bottom has the potential to start a new multi-year rally, hence a new Bear Cycle for Gold.
This pattern is further strengthened by the fact that Gold has formed a Quadruple Top on its 1W RSI Resistance Zone, similar to both of its previous Cycle Top patterns since 2011.
Is the Dollar signaling a Bear Cycle on Gold?
-------------------------------------------------------------------------------
** Please LIKE 👍, FOLLOW ✅, SHARE 🙌 and COMMENT ✍ if you enjoy this idea! Also share your ideas and charts in the comments section below! This is best way to keep it relevant, support us, keep the content here free and allow the idea to reach as many people as possible. **
-------------------------------------------------------------------------------
💸💸💸💸💸💸
👇 👇 👇 👇 👇 👇

GOLD MARKET ANALYSIS AND COMMENTARY - [Nov 10 - Nov 14]This week, international OANDA:XAUUSD prices continued to move sideways around the $4,000/oz mark and closed the week at $4,001/oz.
As the U.S. government remains partially shut down and economic data are incomplete, investors find it increasingly difficult to assess the state of the U.S. economy and its impact on the gold market. As a result, many are seeking opportunities in other markets, including stocks and the U.S. dollar. This explains why gold prices have been trading sideways.
Gold’s stability around the $4,000 level reflects an ongoing tug-of-war between fundamental factors — notably strong central bank buying, safe-haven demand, technical profit-taking pressure, and the rebound of the U.S. dollar.
Although gold prices may continue to move sideways next week, analysts believe the metal has greater upside potential than downside risk in the medium to long term.
📌From a technical perspective, the current resistance level is around 4,150, while support lies near 3,890. If the price breaks above 4,045, it could recover toward 4,150, and a further breakout could push it up to the 4,250 zone. Conversely, if the price falls below 3,900, it could trigger a sell-off, driving gold down toward the 3,750 area.
Notable technical levels are listed below.
Support: 3,750 – 3,900 USD
Resistance: 4,045 – 4,150 – 4,250 USD
SELL XAUUSD PRICE 4151 - 4149⚡️
↠↠ Stop Loss 4155
BUY XAUUSD PRICE 3955 - 3957⚡️
↠↠ Stop Loss 3851

Gold’s Tight Range = Big Opportunity! Watch These Key Levels.COMEX:GC1! COMEX:GC1! (Gold Futures) | Market Analysis & 2025 Outlook
After hundreds of requests since my last ideas, I’ve decided to share another detailed breakdown — this time for Gold Futures COMEX:GC1! . Let’s dive in.
COMEX: COMEX:GC1! Breakdown
Fundamental Analysis → NEUTRAL to BULLISH
Gold remains range-bound as markets await clearer direction from global inflation data and U.S. rate expectations. Safe-haven demand continues to support the metal, but a strong dollar has kept price capped.
Technical Analysis → RANGING (Neutral Bias)
Currently consolidating within a 4H range since October 25th, with price bouncing between resistance near 4045 and support around 3940.
A close below 3940 opens the door for lows near 3823.
A close above 4045 could trigger a move toward the fair value gap around 4235.
If price sustains above 4235, the next major target would be a breakout beyond the all-time high at 4398.
This sideways structure suggests accumulation before a decisive move — traders should stay patient for a confirmed breakout before committing heavy capital.
Sentimental Analysis → Market in Waiting Mode
Gold traders are showing hesitation — institutions and retail alike are waiting for key macro catalysts. The current equilibrium reflects indecision rather than reversal.
My Suggestion:
While the bias remains neutral, a smart strategy is to wait for confirmation from the range extremes.
Trade Plan:
BUY Setup: If we see a strong 4H or daily close above 4045, aim for 4235, then 4398.
SELL Setup: If price closes below 3940, look for continuation to 3823 before considering long re-entries.
Use proper risk management — risk small until direction confirms.
Conclusion
Gold’s current range offers both opportunity and caution. Be patient and let the breakout guide your next move. Remember — the market rewards discipline more than prediction.
If you enjoyed this breakdown, drop a LIKE, COMMENT, and FOLLOW for more updates and technical setups.
See you soon on the next trade idea! ✨📊

The Gold Rush and Washington's Strategic MoveThe US OANDA:XAUUSD and OANDA:XAGUSD markets are experiencing an unprecedented boom, with demand up 58% in the last three months alone, precious metal ETFs attracting over $16 billion. But behind this wave of investment is not just a defensive sentiment against inflation or geopolitical risks, but also a deeper shift in the global resource power structure.
On November 6, the US Department of the Interior unexpectedly added copper, silver and metallurgical coal to its list of “critical minerals,” expanding the strategic scope of supply security. The list, updated every three years by the US Geological Survey (USGS), will serve as the basis for a new round of tariff reviews under Section 232, a legal tool that allows tariffs on national security grounds.
The move was seen by analysts as a clear political signal: Washington is increasingly viewing industrial and precious metals not just as commercial goods, but as strategic assets in global supply chain competition.
A Strategic, Not Just Commercial List
According to the USGS, the definition of “critical minerals” includes materials that are essential to the economy or national security, are vulnerable to supply chain disruptions, and have systemic impacts if they are not available.
Silver, a metal widely used in electronics, solar panels, jewelry, and investments, is the most notable case. Its inclusion on the list has caused market volatility: New York silver stocks hit record levels, while London markets saw short-term shortages. The United States currently relies on imports for nearly two-thirds of its silver needs, mainly from Mexico and Canada.
The addition of silver “is the start of a new policy cycle,” said Suki Cooper, an analyst at Standard Chartered, and if tariffs are imposed, it could reshape the global balance of supply and demand for precious metals. While some silver customs codes have been exempted, the political signals from Washington are enough to trigger a wave of speculation and hoarding.
From Minerals to Geopolitical Power
This is not a one-off change. The US administration, starting with Trump and continuing under Biden, is remaking mineral policy as part of its national security strategy.
From promoting domestic mining, to funding smelting projects, to using financial tools like tax credits and federal loans, Washington is trying to reduce its dependence on imports, especially from China, which now dominates many rare and industrial metals supply chains.
In addition to silver, elements such as lead, silicon, phosphate, uranium and rhenium were also added to the list, reflecting the US vision of a “transitional energy economy”. Meanwhile, elements with the highest risk of supply chain disruption, such as rhodium, gallium, germanium, tungsten and rare earths, remain in the “special priority” category.
The resource power structure is shifting, and the US clearly wants to reshape that order, starting with establishing a “self-reliant mineral ecosystem”.
Gold, silver and investor defense
In this context, the acceleration of the gold and silver markets reflects more than just traditional safe haven sentiment. The 58% surge in precious metals demand in the US shows that capital is shifting from financial assets to physical goods, a manifestation of concerns about the debt cycle, expansionary monetary policy and prolonged geopolitical volatility.
Precious metal ETFs recorded net inflows of $16 billion in the most recent quarter alone, while gold prices continue their relentless bull run. Gold and silver are being repositioned as “strategic assets”, not just temporary shelters.
Long-term impact
The US upgrade of its mineral policy represents a turning point in post-globalization industrial policy: not just to protect productive capacity, but also to create leverage in strategic competition with other economies.
If tariffs and financial support are implemented in a coordinated manner, the metals market could enter a prolonged bull market, with higher volatility and deeper fragmentation in global trade.
In the long run, this is not just a story about gold or silver prices, but about how the US reshapes the physical power base of the 21st century economy.
Technical outlook analysis OANDA:XAUUSD
After a strong rally from July to early October, gold prices have entered a correction and consolidation period around the $3,850–$4,000/ounce range. The daily chart shows a short-term bearish structure within a falling channel, but selling pressure is showing signs of weakening as prices hold above the 0.5 Fibonacci level at $3,846/ounce.
The RSI is moving sideways around the neutral level of 50, indicating that the bearish momentum has slowed down, while the short-term MA21 (around $4,055) is acting as important dynamic resistance. A decisive break above $3,973–$4,000 could be an early signal for a technical recovery towards the $4,120 (0.236 Fibo) range.
Conversely, if the price loses the $3,846 mark, corrective pressure could pull the price to the next support zone at $3,720 (Fibo 0.618), which corresponds to the medium-term bottom of the current price channel.
Overview:
Gold is in a consolidation phase after a long rally, with the range narrowing and awaiting a fresh catalyst from monetary policy or geopolitics. A compression phase before a breakout is likely, with lower risk for buyers if prices continue to hold above the $3,850 area.
SELL XAUUSD PRICE 4021 - 4019⚡️
↠↠ Stop Loss 4025
→Take Profit 1 4013
↨
→Take Profit 2 4007
BUY XAUUSD PRICE 3939 - 3941⚡️
↠↠ Stop Loss 3935
→Take Profit 1 3947
↨
→Take Profit 2 3953

GOLD rises despite strong ADP jobs dataOANDA:XAUUSD prices rose more than 1% on Wednesday to $3,978.92 an ounce, despite better-than-expected U.S. private-sector jobs data, reflecting cautious investor sentiment amid high stock market valuations and uncertainty surrounding President Donald Trump’s tariff policies, which are reshaping the global economic landscape.
The ADP employment report showed that the private sector added 42,000 jobs in October, well above the forecast of 28,000, reinforcing the view that the US labor market remains strong and therefore the Fed can delay rate cuts. However, the rise in real yields has not been enough to dampen demand for havens, as investors view gold as a hedge against a potential correction in risk assets.
Christian Borjon Valencia (FXStreet) said gold prices were supported by dovish comments from several Fed officials. Meanwhile, Jim Wyckoff (Kitco Metals) said “safe haven demand is back” as investors “are increasingly concerned about the AI stock bubble and the overvaluation of the US market.”
Financial markets are in a wait-and-see mode as the US Supreme Court holds a hearing on the legality of tariffs imposed by President Trump under the International Emergency Economic Powers Act. An adverse ruling could result in the government having to repay more than $100 billion in tariffs and limit the White House’s ability to direct trade policy, potentially sending shockwaves through the dollar and commodity markets.
Conservative justices, including Chief Justice John Roberts and Neil Gorsuch, have questioned whether the president has the authority to unilaterally impose a “tax on Americans” without congressional approval. A decision against Trump could weaken his central “economic weapon” and drive money into risk-free assets like gold.
On the political prediction market Kalshi, the likelihood of the court backing Trump has fallen from nearly 50% to just about 30%, reflecting growing skepticism about the sustainability of the tariff strategy.
These factors combine to suggest that OANDA:XAUUSD is consolidating its position in a transitional period between monetary policy and political uncertainty, a period in which the Fed is cautious, Washington faces regulatory risks and its power structure is challenged.
Technical Analysis OANDA:XAUUSD
Gold prices are entering a narrow consolidation phase around the $3,940–$3,980/ounce range, after a correction from the $4,380 peak. The daily chart shows that the short-term downtrend channel structure is still maintained, but the downside momentum has weakened significantly. The $3,896 (0.5 Fib) zone continues to act as a key support, while the $3,972–$4,055 resistance zone (0.382 Fib and MA20) is the decisive threshold for the next trend.
The RSI is slowly recovering from the neutral zone and is showing signs of converging with the moving MA, implying that selling pressure is drying up and the market may form a short-term bottom. If the price breaks out decisively at $3,972, the current accumulation pattern could be completed, opening a recovery cycle towards $4,128, the 0.236 Fib mark of the previous decline.
The conditions for a new bull run lie in gold prices remaining stable above the $3,900 support zone, combined with improved cash flows and expectations of the Fed shifting to a more dovish stance in December. In that case, the current consolidation zone could become the basis for a new rally, rather than just a technical pullback.
SELL XAUUSD PRICE 4022 - 4020⚡️
↠↠ Stop Loss 4026
→Take Profit 1 4014
↨
→Take Profit 2 4008
BUY XAUUSD PRICE 3948 - 3950⚡️
↠↠ Stop Loss 3944
→Take Profit 1 3956
↨
→Take Profit 2 3962

GOLD recovers slightly before ADP, pressure from Dollar and FEDIn the Asian trading session on Wednesday morning (November 5), spot OANDA:XAUUSD prices edged up around $3,938/ounce, after falling nearly 2% yesterday. The sharp correction reflected pressure from the US dollar, currently at a three-month high, along with the waiting for the ADP private employment data, which is considered an early indicator of the US labor market.
Tuesday's decline, which saw gold lose $69.52, equivalent to 1.74%, came amid money flowing out of gold and back into the greenback, while investors reassessed the monetary policy outlook of the Federal Reserve (Fed).
The US government remains shut down, delaying many official economic data. As a result, the market has shifted its focus to private indicators, especially the ADP employment report for October, due out tonight. The US economy is estimated to have added just 25,000 jobs in the month, a low level that suggests a marked weakening in job growth.
Previously, September data showed the private sector lost 32,000 jobs, the sharpest decline since March 2023, contrary to expectations for an increase of 50,000. These signals reinforce the view that the Fed's monetary tightening cycle is coming to an end.
However, according to CME Group's FedWatch tool, the probability of the Fed cutting interest rates at its December meeting has dropped to about 71%, compared with more than 90% last week, after Fed officials sent cautious signals. The dollar's recovery and stable bond yields have temporarily lost gold's advantage in the short term.
By its very nature, non-yielding gold tends to perform well in low interest rate and economic uncertainty environments. Therefore, the current correction is seen as a technical pause, as the market awaits clearer signals on Fed policy and the health of the US economy.
The medium-term outlook remains positive, but the near-term direction will depend on ADP employment data and interest rate expectations, two factors that are reshaping gold’s position in the new global policy cycle.
Technical Analysis OANDA:XAUUSD
Gold price is hovering around $3,939/ounce, recording a slight recovery after hitting a short-term bottom near $3,930. The price action shows that gold is moving in a corrective downtrend channel, formed after a period of vertical increase from August to mid-October.
In terms of technical structure, the 0.382 Fibonacci zone at 3,972 USD ounce remains an important resistance level, while the 3,896 USD level (0.5 Fibo) acts as medium-term support. The MA21 average is currently around 4,055 USD, creating a dynamic barrier above, reflecting that the short-term downtrend is still dominant. The RSI indicator remains below 50, indicating that the market is still in a state of accumulation, lacking clear momentum.
Overall, the main trend of gold is still rebalancing after an impressive series of increases, with the possibility of fluctuating in a narrow range of 3,890 - 3,980 USD/ounce before there is a new breakout signal.
In the short term, gold is likely to continue to fluctuate within a consolidation range, waiting for new catalysts from US employment data and the Fed's interest rate orientation to determine the next direction.
SELL XAUUSD PRICE 4017 - 4015⚡️
↠↠ Stop Loss 4021
→Take Profit 1 4009
↨
→Take Profit 2 4003
BUY XAUUSD PRICE 3920 - 3922⚡️
↠↠ Stop Loss 3916
→Take Profit 1 3928
↨
→Take Profit 2 3934
