XAUUSD Could top in September but long term looks bright.Gold (XAUUSD) has been trading within a Channel Up for the past 2 years and right now it is unfolding its latest Bullish Leg. That started after the previous pull-back/ consolidation phase (May - July) hit and found Support on the 1D MA100 (red trend-line).
This trend-line has been Gold's major Support and buy entry since mid-October 2023. Every pull-back on/ near it, kick-started a Bullish Leg, the weakest of which has been +16.59% and the strongest +23.75%.
Since April 15 2024, the 1D RSI Resistance has been a great indication of when to sell (equally for buying the Support), so even though we expect the current Bullish Leg to complete a +22.06% rise at least, we will be looking at the RSI Resistance more closely to time the sell.
The subsequent pull-back should bounce on the dashed pivot trend-line and naturally again on the 1D MA100, which will be a buy opportunity towards the ultimate long-term Target of 4300 (+22.00% again).
-------------------------------------------------------------------------------
** Please LIKE 👍, FOLLOW ✅, SHARE 🙌 and COMMENT ✍ if you enjoy this idea! Also share your ideas and charts in the comments section below! This is best way to keep it relevant, support us, keep the content here free and allow the idea to reach as many people as possible. **
-------------------------------------------------------------------------------
💸💸💸💸💸💸
👇 👇 👇 👇 👇 👇
Gc1!!

Gold | Oil | Dollar | Silver | Natural Gas Price ForecastGold | Oil | Dollar | Silver | Natural Gas Price Forecast
NYMEX:NG1! AMEX:UNG AMEX:BOIL PEPPERSTONE:NATGAS

GOLD rebounds strongly, supported by US dataGold prices were volatile during the New York trading session on Thursday (September 11) due to the influence of the US CPI index and initial data on unemployment benefits applications. OANDA:XAUUSD price has recovered strongly during today's Asian session (September 12) and is currently trading at 3,647 USD/oz.
Very weak initial U.S. jobless claims data eased concerns over inflation data. The likelihood of a Federal Reserve rate cut next week remains high, supporting gold prices and recouping most of the day’s losses.
Data released by the U.S. Bureau of Labor Statistics on Thursday showed the consumer price index (CPI) rose more than expected in August from the previous month, but the year-over-year increase was in line with expectations.
The data showed that the CPI rose 0.4% month-over-month in August, beating the 0.3% forecast by economists surveyed by Dow Jones. However, the 2.9% year-over-year increase was in line with expectations. Moreover, the core CPI, which excludes the more volatile food and energy components, rose 0.3% month-over-month and 3.1% year-over-year, both in line with Dow Jones' forecasts.
Meanwhile, the US labor market is showing signs of slowing: weekly jobless claims unexpectedly jumped on Thursday after jobs growth data was revised down earlier this week. In the week ending September 6, initial jobless claims rose 27,000 to a seasonally adjusted 263,000, the highest since October 2021, far exceeding market expectations of 235,000.
Initial data on unemployment claims 'saved' OANDA:XAUUSD
Gold rallies after finding support at the 0.382% Fibonacci extension trendline note to readers in yesterday's issue.
The rally has now just cleared the 0.50% Fibonacci level, which provides the initial conditions for a possible retest of the all-time high at the 0.618% Fibonacci level.
The technical structure has not changed much with the uptrend dominating the market, from the uptrend channel as the main trend, the main support from EMA21 while RSI has not shown any signal for the possibility of a price decrease.
Therefore, the technical chart summary is completely uptrend and the notable price points during the day will be listed as follows.
Support: 3,613 - 3,600 USD
Resistance: 3,645 - 3,677 USD
SELL XAUUSD PRICE 3682 - 3680⚡️
↠↠ Stop Loss 3686
→Take Profit 1 3674
↨
→Take Profit 2 3668
BUY XAUUSD PRICE 3530 - 3532⚡️
↠↠ Stop Loss 3526
→Take Profit 1 3538
↨
→Take Profit 2 3544

Multi-Asset Execution Chart Analysis & TradesAnalysis Date : September 11, 2025
Trading Analyst : Institutional Intelligence Framework
Methodology : Enhanced Dual Renko Chart System with Optimized Technical Indicators
Executive Summary
Execution chart analysis validates the exceptional institutional opportunities identified in our structure analysis. All three primary equity indices show perfect technical confirmation of institutional positioning with strong momentum indicators. Commodity and currency markets reveal significant technical conflicts requiring defensive positioning adjustments.
Enhanced Indicator Configuration
DMI/ADX Visual Standards :
ADX (Green) : Trend strength indicator (>25 = strong trend)
+DI (Blue) : Bullish directional movement
-DI (Red) : Bearish directional movement
Line Weight : 3pt for enhanced visibility
Dual Stochastics Configuration :
Tactical (5,3,3) : %K (Dark Blue), %D (Teal) - Short-term momentum
Strategic (50,3,3) : %K (Black), %D (Red Circles) - Medium-term context
Primary Opportunities - Technical Validation (75-85% Total Allocation)
1. DOW JONES (YM) - 30-35% ALLOCATION
Classification : OPTIMAL RISK/REWARD - Superior Technical Confirmation
YM Execution View:
Execution Signal Analysis :
DEMA Status : Bullish alignment confirmed (black above orange)
ADX : 47.74 (highest trend strength among all indices)
+DI/-DI Ratio : 2.69:1 bullish dominance
Momentum Quality : Exceptional - strongest ADX with optimal positioning
Stochastics : Tactical 98.86/84.24, Strategic 98.86/84.02 (peak momentum)
Technical Trade Setup :
Bullish Scenario (80% probability) :
Entry : /MYM at current levels 46,050 (optimal positioning confirmed)
Technical Edge : Strongest ADX + minimal extension risk
Stop Loss : 45,000 (2.3% risk - best among indices)
Target 1 : 47,000 (+2.1% - close 40% position)
Target 2 : 48,000 (+4.2% - close 30% position)
Trail Strategy : 150-point swing lows on remaining 30%
Consolidation Scenario (15% probability) :
Range : 45,500-46,500 around YTD POC consensus
Strategy : Accumulate on any dips to 45,700
Advantage : Minimal downside to institutional support
Risk Management : Optimal positioning within institutional zone
Bearish Scenario (5% probability) :
Trigger : Break below 45,000 (institutional consensus violation)
Action : Reduce position by 50%
Probability : Very low given YTD POC validation and technical strength
Re-entry : Require fresh institutional accumulation evidence
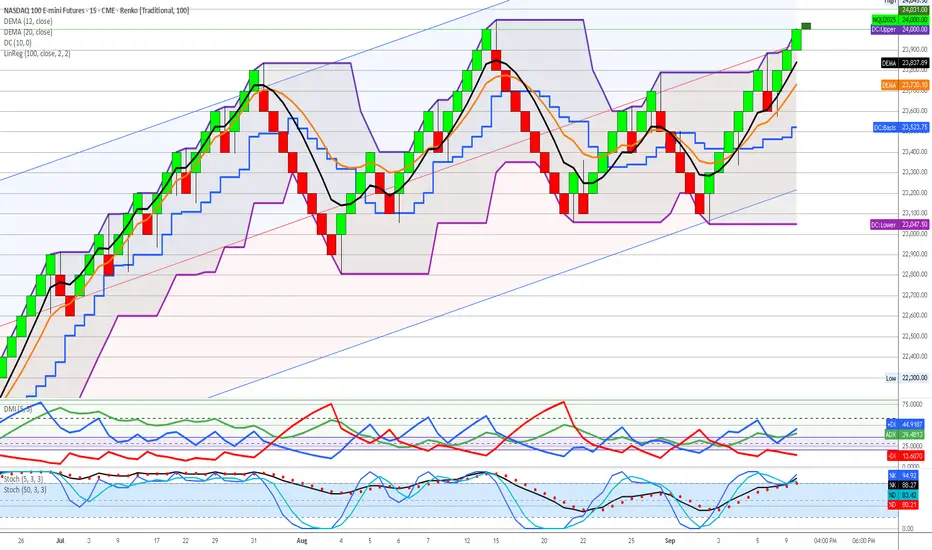
2. NASDAQ 100 (NQ) - 25-30% ALLOCATION
Classification : EXCEPTIONAL MOMENTUM - Exceptional Institutional Backing
NQ Execution View:
Execution Signal Analysis :
DEMA Status : Strong bullish alignment (black above orange)
ADX : 44.91 (exceptional trend strength)
+DI/-DI Ratio : 2.90:1 bullish dominance (highest among indices)
Momentum Quality : Exceptional directional bias
Stochastics : Tactical 88.27/80.21, Strategic 88.27/80.21 (strong sustainable)
Technical Trade Setup :
Bullish Scenario (75% probability) :
Entry : /MNQ at current levels or pullback to 23,700-23,800
Technical Edge : Highest +DI/-DI ratio with institutional backing
Stop Loss : 23,000 (4.3% risk)
Target 1 : 25,000 (+4.3% - close 50% position)
Target 2 : 25,500 (+6.1% - close 25% position)
Trail Strategy : 100-point swing lows on remaining 25%
Consolidation Scenario (20% probability) :
Range : 23,500-24,500 above institutional accumulation
Strategy : Scale into weakness, maintain core position
Management : Use tactical stochastics for entry timing
Support : 26.8:1 institutional backing provides confidence
Bearish Scenario (5% probability) :
Trigger : Break below 23,000 (Q3 POC violation)
Action : Exit all positions immediately
Reassessment : Wait for institutional re-accumulation
Probability : Very low given exceptional institutional support
3. S&P 500 (ES) - 20-25% ALLOCATION
Classification : SOLID CONFIRMATION - Strong Institutional Support
ES Execution View:
Execution Signal Analysis :
DEMA Status : Bullish alignment maintained (black above orange)
ADX : 41.32 (strong trend strength)
+DI/-DI Ratio : 1.74:1 bullish dominance
Momentum Quality : Solid institutional validation
Stochastics : Tactical 34.44/93.30, Strategic 98.26/95.30 (extreme overbought)
Technical Trade Setup :
Bullish Scenario (70% probability) :
Entry : /MES on any pullback to 6,450-6,500
Current Caution : Strategic stochastics extremely overbought
Stop Loss : 6,300 (3.8% risk)
Target 1 : 6,700 (+2.8% - close 50% position)
Target 2 : 6,800 (+4.4% - close 25% position)
Profit Management : Take profits on strength given overbought conditions
Consolidation Scenario (25% probability) :
Range : 6,400-6,600 around institutional levels
Strategy : Wait for tactical stochastics to reset before adding
Management : Reduce position size until momentum cools
Context : Strategic overbought suggests pause needed
Bearish Scenario (5% probability) :
Trigger : Break below 6,300 (institutional support failure)
Action : Systematic position reduction
Management : Tight stops given overbought technical readings
Re-entry : Wait for technical reset and institutional validation
Secondary Opportunities - Mixed Technical Signals (10-15% Total Allocation)
4. WTI CRUDE OIL (CL) - 8-12% ALLOCATION
Classification : INSTITUTIONAL CONFLICT - Defensive Positioning Required
CL Execution View:
Execution Signal Analysis :
DEMA Status : Bullish alignment (black above orange)
ADX : 42.19 (strong trend strength)
+DI/-DI Ratio : BEARISH 2.44:1 (-DI 42.10 vs +DI 17.86)
Critical Conflict : DEMA bullish vs DMI strongly bearish
Stochastics : Tactical 9.26/27.64, Strategic 27.64/33.61 (oversold setup)
Technical Trade Setup :
Bullish Scenario (45% probability) :
Entry Criteria : WAIT for +DI to cross above -DI for confirmation
Current Action : Reduce position size due to momentum conflict
Stop Loss : 61.50 (tight due to bearish momentum)
Target : 65.50 if technical alignment achieved
Risk Management : Maximum 1.5% account risk due to signal conflict
Neutral Scenario (35% probability) :
Range : 62.00-64.00 within institutional accumulation
Strategy : Maintain minimal defensive position
Monitoring : Daily +DI/-DI relationship for momentum shift
Institutional Support : Strong Q2 accumulation provides floor
Bearish Scenario (20% probability) :
Trigger : Break below 61.00 (institutional support failure)
Action : Complete position liquidation
Reason : Bearish momentum confirming institutional breakdown
Re-entry : 58.00 area (Q2 POC support) with technical confirmation
High-Risk Positions - Technical Deterioration (0-8% Total Allocation)
5. NATURAL GAS (NG) - 3-5% ALLOCATION
Classification : HIGH RISK - Institutional Disengagement Confirmed
NG Execution View:
Execution Signal Analysis :
DEMA Status : Bearish alignment (black below orange)
ADX : 42.79 (strong trend - bearish direction)
+DI/-DI Ratio : EXTREME BEARISH 6.30:1 (-DI 53.25 vs +DI 8.45)
Technical Reality : All major indicators bearishly aligned
Stochastics : Tactical 0.00/6.70 (maximum oversold), Strategic 51.98/65.70
Technical Trade Setup :
Bullish Scenario (20% probability) :
Entry Criteria : AVOID - all technical signals bearish
Required Confirmation : DEMA bullish cross + DMI reversal + institutional re-engagement
Current Action : Complete avoidance recommended
Speculative Only : Maximum 1% account risk if attempting reversal play
Neutral Scenario (30% probability) :
Range : 2.80-3.20 with declining institutional participation
Strategy : Avoid new positions, monitor for institutional return
Risk : 65% volume decline from Q1 peak activity
Liquidity : /MNG insufficient volume (13,991) for meaningful sizing
Bearish Scenario (50% probability) :
Continuation : Further decline toward 2.50-2.70 historical lows
Institutional Reality : Smart money disengagement pattern
Technical Confirmation : 6.30:1 bearish momentum supports decline
Strategy : Complete avoidance until institutional re-engagement
6. EURO FUTURES (6E) - 2-3% ALLOCATION
Classification : DANGEROUS EXTENSION - Technical Breakdown Confirmed
6E Execution View:
Execution Signal Analysis :
DEMA Status : Bearish crossover (black below orange)
ADX : 29.21 (moderate trend strength)
+DI/-DI Ratio : BEARISH 1.19:1 (-DI 29.21 vs +DI 24.49)
Extension Risk : 12.1% above YTD POC institutional consensus
Stochastics : Tactical 23.24/66.57, Strategic 74.26/90.89 (extremely overbought)
Technical Trade Setup :
Bullish Scenario (15% probability) :
Entry : AVOID - dangerous extension with technical breakdown
Existing Positions : Immediate systematic profit-taking required
Risk : Overextension + bearish technical = correction imminent
Management : Emergency profit-taking protocols engaged
Neutral Scenario (25% probability) :
Range : 1.1650-1.1800 at dangerous extension levels
Strategy : Avoid range trading given extension risk
Risk Assessment : All signals point to mean reversion
Professional Response : Defensive positioning only
Bearish Scenario (60% probability) :
Target : Return to YTD POC 1.0525 (-12.1% correction)
Technical Trigger : DEMA bearish cross + momentum deterioration
Strategy : Short opportunities on any strength above 1.1780
Entry : /M6E shorts with tight stops above 1.1820
Risk Control : Maximum 1% account risk given extension
7. GOLD FUTURES (GC) - 0% ALLOCATION
Classification : LIQUIDATION - High Risk Territory
GC Execution View:
Execution Signal Analysis :
DEMA Status : Bearish crossover from distribution highs
ADX : 34.91 (declining trend strength)
+DI/-DI Ratio : BEARISH 1.31:1 (-DI 34.91 vs +DI 26.64)
Extension Risk : 12.2%+ beyond ALL institutional positioning
Stochastics : Tactical 11.25/30.89, Strategic 89.46/93.86 (maximum overbought)
Technical Trade Setup :
Emergency Liquidation Protocol :
Immediate Action : Complete liquidation using market orders if necessary
Rationale : Void territory + technical breakdown = catastrophic risk
No Stops : Emergency exit protocols - immediate execution required
Reallocation : Proceeds to YM, NQ, ES primary opportunities immediately
Short Opportunity (High Probability) :
Strategy : /MGC shorts on any rallies above 2,690
Target : 2,380-2,400 (return to institutional zones)
Stop : 2,720 (tight risk control)
Correction Magnitude : 12-15% decline expected
Risk : Maximum 1% account risk for speculative short
Portfolio Risk Management Protocols
Position Sizing Framework
Maximum Risk Per Trade : 2% account value (1.5% for conflicted signals)
Portfolio Heat Limit : 15% total risk across all positions
Correlation Controls : Maximum 85% equity exposure given technical alignment
Cash Management : 5-10% opportunity fund for technical setups
Technical Signal Hierarchy
Primary Confirmation : DEMA + DMI + ADX alignment required
Entry Timing : Stochastics for tactical positioning optimization
Risk Management : Institutional levels for strategic stop placement
Profit Taking : Systematic protocol at 2:1, 3:1, trail remainder
Market Scenario Analysis
Scenario A: Continued Equity Strength (70% probability)
Characteristics : Technical momentum sustains institutional accumulation
Winners : YM, NQ, ES (maximize allocation to 85%)
Losers : GC, 6E (extension corrections accelerate)
Strategy : Aggressive equity positioning, complete defensive liquidation
Technical Catalyst : ADX strength maintenance + DEMA alignment
Scenario B: Technical Consolidation (25% probability)
Characteristics : Momentum indicators cool, range-bound trading
Management : Reduce position sizes, use stochastics for timing
Opportunity : Accumulate on pullbacks to institutional levels
Risk Control : Tighter stops, faster profit-taking on strength
Technical Signal : ADX decline below 35, stochastics reset
Scenario C: Technical Breakdown (5% probability)
Trigger : DEMA bearish crosses on primary indices
Action : Emergency position reduction protocols
Management : Systematic liquidation, increase cash to 25%+
Re-entry : Wait for institutional level retests with technical confirmation
Probability : Very low given exceptional institutional backing
Weekly Monitoring Checklist
Daily Technical Assessment
DEMA relationship maintenance across all positions
DMI momentum quality and directional bias confirmation
Stochastics positioning for entry/exit timing optimization
ADX strength validation for trend continuation
Risk Management Verification
Position sizing within 2% account risk per trade
Portfolio heat below 15% total risk exposure
Stop loss proximity to institutional support levels
Profit-taking discipline at predetermined targets
Technical Signal Evolution
Cross-asset momentum convergence/divergence analysis
Stochastics reset opportunities for position optimization
DEMA separation quality for trend strength assessment
Institutional level respect vs violation monitoring
Key Success Factors
Technical Execution Excellence
Signal Clarity : Enhanced visual indicators enable precise timing
Risk Discipline : Systematic adherence to technical signal hierarchy
Momentum Quality : ADX + DMI confirmation prevents false signals
Entry Optimization : Dual stochastics for tactical timing precision
Institutional Integration
Strategic Context : Structure charts provide positioning intelligence
Tactical Timing : Execution charts optimize entry/exit precision
Risk Management : Institutional levels anchor stop placement
Professional Standards : Both frameworks align for optimal decisions
Framework Validation Results
Primary Opportunities : Perfect technical confirmation of institutional intelligence
Risk Identification : Technical signals validate structure chart warnings
Professional Execution : Enhanced indicators enable institutional-grade precision
Capital Preservation : Systematic risk management across all timeframes
Risk Disclaimer : All trading involves substantial risk of loss. Past performance does not guarantee future results. Technical analysis and institutional intelligence frameworks are tools for risk assessment and should not be considered guaranteed predictors of future price movement. Position sizing and risk management protocols must be adjusted based on individual account size, risk tolerance, and market conditions.
Document Status : Active execution framework requiring daily technical monitoring and weekly risk assessment updates. Integration with structure analysis mandatory for optimal decision-making.
Framework Evolution : Enhanced visual indicators and systematic technical analysis represent significant advancement in execution precision. Continuous optimization based on market regime changes and signal quality assessment required.
Multi-Asset Market Analysis & Trade IdeasAnalysis Date : September 10, 2025
Trading Analyst : Institutional Intelligence Framework
Methodology : Dual Renko Chart System with Enhanced Volume Profile Analysis
Executive Summary
Current market analysis reveals exceptional institutional opportunities across equity indices with significant commodity sector divergence. The enhanced institutional intelligence framework identifies unprecedented buying dominance in major equity markets while revealing dangerous extensions in traditional safe-haven assets.
Portfolio Allocation Strategy : 75-85% equity allocation with minimal commodity/currency exposure based on institutional positioning intelligence.
Primary Opportunities (70-85% Total Allocation)
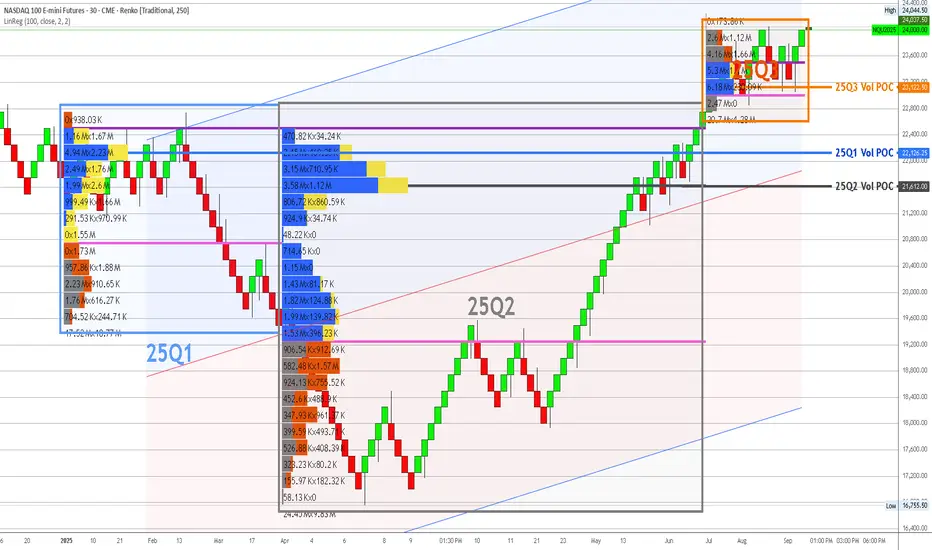
1. NASDAQ 100 (NQ) - 25-30% ALLOCATION
Classification : PRIMARY OPPORTUNITY - Institutional Backing
YTD View:
Institutional Intelligence :
Q3 Volume Analysis : 26.8:1 buying dominance (6.18M UP vs 230.69K DOWN)
Current Position : 23,963 (+3.4% above Q3 POC 23,186)
Support Structure : Exceptional multi-quarter institutional foundation
Risk Assessment : LOWEST RISK - strongest institutional conviction identified
Trade Recommendations :
Bullish Scenario (65% probability) :
Entry : /MNQ at current levels or any pullback to 23,500-23,600
Position Size : Maximum 2.5% account risk per position
Target 1 : 24,500 (close 50% position)
Target 2 : 25,000 (close 25% position)
Target 3 : 25,500+ (trail remaining 25%)
Stop Loss : 23,000 (below Q3 institutional support)
Neutral Scenario (25% probability) :
Range : 23,200-24,200 consolidation
Strategy : Scale into positions on weakness toward 23,400
Management : Hold core position, trade edges of range
Re-evaluation : Weekly basis for breakout confirmation
Bearish Scenario (10% probability) :
Trigger : Break below 23,000 (institutional support failure)
Action : Exit all positions immediately
Re-entry : Require fresh institutional accumulation evidence
Risk Control : Maximum 2% loss on allocation
2. S&P 500 (ES) - 25-30% ALLOCATION
Classification : PRIMARY OPPORTUNITY - Strong Institutional Support
3-QTR View:
YTD View:
Institutional Intelligence :
Q3 Volume Analysis : 5.21:1 buying dominance (11.3M UP vs 2.17M DOWN)
Current Position : 6,550 (+2.7% above Q3 POC 6,375)
Support Structure : Consistent institutional accumulation across quarters
Risk Assessment : LOW RISK - exceptional institutional backing
Trade Recommendations :
Bullish Scenario (70% probability) :
Entry : /MES at current levels or pullback to 6,450-6,500
Position Size : Maximum 2.5% account risk per position
Target 1 : 6,650 (close 50% position)
Target 2 : 6,750 (close 25% position)
Target 3 : 6,850+ (trail remaining 25%)
Stop Loss : 6,300 (below Q3 institutional support)
Neutral Scenario (20% probability) :
Range : 6,400-6,600 consolidation
Strategy : Accumulate on weakness, trim on strength
Management : Maintain core position size
Monitoring : Weekly institutional level respect
Bearish Scenario (10% probability) :
Trigger : Break below 6,300 (institutional support violation)
Action : Systematic position reduction
Stop Loss : 6,250 (complete exit level)
Re-entry : Wait for institutional re-engagement signals
3. DOW JONES (YM) - 20-25% ALLOCATION
Classification : HIGH CONVICTION - YTD POC Validation
3-QTR View:
YTD View:
Institutional Intelligence :
Q3 Volume Analysis : 11.5:1 buying dominance (455.32K UP vs 83.17K DOWN)
YTD POC Alignment : Perfect alignment with Q1 POC at 45,150
Current Position : 45,651 (+1.1% above institutional consensus)
Risk Assessment : VERY LOW RISK - optimal positioning
Trade Recommendations :
Bullish Scenario (75% probability) :
Entry : /MYM at current levels (optimal positioning confirmed)
Position Size : Maximum 2.5% account risk per position
Target 1 : 46,200 (close 40% position)
Target 2 : 46,800 (close 30% position)
Target 3 : 47,500+ (trail remaining 30%)
Stop Loss : 44,800 (below YTD/Q1 POC consensus)
Neutral Scenario (20% probability) :
Range : 45,000-46,000 consolidation around institutional consensus
Strategy : Hold core position, add on dips to 45,200
Management : Optimal risk/reward positioning maintained
Advantage : Minimal downside to institutional support
Bearish Scenario (5% probability) :
Trigger : Break below 45,000 (YTD POC violation)
Action : Reduce position by 50%
Ultimate Stop : 44,500 (complete exit)
Assessment : Highly unlikely given institutional validation
Secondary Opportunities (15-20% Total Allocation)
4. WTI CRUDE OIL (CL) - 15-20% ALLOCATION
Classification : SOLID OPPORTUNITY - Strong Institutional Foundation
3-QTR View:
YTD View:
Institutional Intelligence :
Q3 Volume Analysis : 1.94:1 buying dominance (1.38M UP vs 710.76K DOWN)
Current Position : 63.27 (within Q3 institutional accumulation zone)
Support Structure : Massive Q2 institutional accumulation at 57.50
Risk Assessment : LOW RISK - multiple institutional support layers
Trade Recommendations :
Bullish Scenario (60% probability) :
Entry : /MCL at current levels or pullback to 62.50-63.00
Position Size : Maximum 2% account risk per position
Target 1 : 67.00 (close 50% position)
Target 2 : 69.00 (close 25% position)
Target 3 : 71.00+ (trail remaining 25%)
Stop Loss : 61.50 (below Q3 institutional support)
Neutral Scenario (30% probability) :
Range : 62.00-65.00 consolidation within institutional zone
Strategy : Scale into positions on weakness
Management : Patient accumulation approach
Support : Strong institutional backing provides downside protection
Bearish Scenario (10% probability) :
Trigger : Break below 61.00 (institutional support failure)
Action : Exit positions systematically
Re-entry : 58.00 area (Q2 POC support)
Risk Management : Tight stops due to support proximity
Defensive Positions (8-12% Total Allocation)
5. NATURAL GAS (NG) - 8-12% ALLOCATION
Classification : MODERATE RISK - Declining Institutional Engagement
3-QTR View:
YTD View:
Institutional Intelligence :
Q3 Volume Analysis : Mixed activity with reduced institutional participation
Q1 Peak : 10.6:1 buying dominance (697K UP vs 65K DOWN) - historical high
Current Concern : 65% volume decline from Q1 peaks
Risk Assessment : MODERATE - institutional disengagement evident
Trade Recommendations :
Bullish Scenario (45% probability) :
Entry : Current levels only with tight risk controls
Position Size : Maximum 1.5% account risk per position
Target 1 : 3.40 (close 60% position)
Target 2 : 3.60 (close remaining 40%)
Stop Loss : 2.90 (below Q3 POC support)
Neutral Scenario (35% probability) :
Range : 3.00-3.20 consolidation
Strategy : Avoid new positions, monitor for re-engagement
Management : Maintain defensive positioning
Watch : Volume quality for institutional return
Bearish Scenario (20% probability) :
Trigger : Break below 2.90 (Q3 support failure)
Action : Complete position liquidation
Assessment : Institutional abandonment acceleration
Avoidance : No re-entry until fresh accumulation evidence
Risk Management Positions (8-13% Total Allocation)
6. EURO FUTURES (6E) - 5-8% ALLOCATION
Classification : DEFENSIVE ONLY - Dangerous Extension
3-QTR View:
YTD View:
Institutional Intelligence :
YTD POC Analysis : 1.0525 (aligned with Q1 POC)
Current Position : 1.1769 (+12.9% above institutional consensus)
Extension Risk : DANGEROUS - trading far beyond smart money positioning
Risk Assessment : HIGH RISK - profit-taking territory
Trade Recommendations :
Bullish Scenario (25% probability) :
Entry : AVOID new long positions
Existing Positions : Systematic profit-taking recommended
Target : 1.1850 maximum (close all positions)
Risk : Overextension beyond institutional support
Neutral Scenario (35% probability) :
Range : 1.1650-1.1800 at dangerous extension levels
Strategy : Range trading only with tight stops
Position Size : Maximum 1% account risk
Management : Defensive positioning required
Bearish Scenario (40% probability) :
Trigger : Any breakdown below 1.1700
Target : Return to institutional consensus (1.0525)
Action : Short opportunities on strength
Strategy : Mean reversion to YTD POC likely
7. GOLD FUTURES (GC) - 3-5% ALLOCATION
Classification : EXTREME CAUTION - Maximum Extension
3-QTR View:
YTD View:
Institutional Intelligence :
Extension Analysis : 12.2% above all institutional positioning
Q2 Peak Activity : 11.5:1 buying dominance at 3,430 levels
Current Position : 2,676 (extremely overextended)
Risk Assessment : MAXIMUM RISK - correction vulnerability
Trade Recommendations :
Bullish Scenario (15% probability) :
Entry : AVOID all new long positions
Existing : Immediate profit-taking recommended
Risk : Extreme overextension unsustainable
Management : Defensive exit strategy only
Neutral Scenario (25% probability) :
Range : 2,650-2,700 at unsustainable levels
Strategy : No positioning recommended
Assessment : Range trading too risky given extension
Monitoring : Watch for breakdown signals
Bearish Scenario (60% probability) :
Target : 3,400-3,500 (return to institutional zones)
Correction Magnitude : 12-15% decline likely
Strategy : Short opportunities on any strength
Entry : /MGC shorts on rallies above 2,690
Stop : 2,720 (tight risk control)
Target : 3,450 (institutional accumulation zone)
Risk Management Protocols
Position Sizing Framework
Maximum Risk Per Trade : 2% of account value
Maximum Sector Exposure : 6% (energy, metals, currencies)
Portfolio Heat : Maximum 15% total risk across all positions
Cash Reserve : 5-12% for opportunities and margin requirements
Stop Loss Hierarchy
Tactical Stops : 2-3 Renko blocks on execution charts
Strategic Stops : Below/above institutional POC levels
Emergency Stops : Below major quarterly support levels
Time Stops : Exit if no progress within 15 trading days
Profit Taking Protocol
Systematic Approach :
Target 1 : Close 40-50% of position at 2:1 risk/reward
Target 2 : Close 25-30% of position at 3:1 risk/reward
Target 3 : Trail remaining 20-25% with institutional level stops
Correlation Management
Equity Exposure : Maximum 75-85% combined (NQ+ES+YM)
Commodity Exposure : Maximum 25-30% combined (CL+NG)
Currency Exposure : Maximum 10% (6E only)
Safe Haven Exposure : Maximum 5% (GC defensive only)
Market Scenario Planning
Scenario A: Continued Equity Strength (60% probability)
Characteristics : Institutional accumulation continues, economic resilience
Winners : NQ, ES, YM (maximize equity allocation)
Losers : GC, 6E (extension corrections)
Strategy : Aggressive equity positioning, defensive commodity stance
Scenario B: Market Consolidation (25% probability)
Characteristics : Range-bound trading around institutional levels
Winners : YM (optimal positioning), CL (institutional support)
Neutral : NQ, ES (trade ranges)
Strategy : Reduce position sizes, focus on institutional level trading
Scenario C: Risk-Off Environment (15% probability)
Characteristics : Institutional support failure, flight to quality
Winners : Cash, defensive positioning
Losers : All risk assets
Strategy : Emergency protocols, systematic position reduction
Trigger : Break below major institutional support levels
Weekly Monitoring Checklist
Daily Assessment
Institutional POC level respect across all markets
Volume quality and institutional engagement trends
Position sizing within risk parameters
Stop loss proximity to institutional levels
Weekly Review
Portfolio allocation vs. target percentages
Risk/reward ratios for all open positions
Institutional volume profile evolution
Correlation analysis across positions
Performance tracking vs. benchmarks
Monthly Evaluation
Quarterly volume profile updates
YTD POC alignment reassessment
Strategy performance attribution
Risk management protocol effectiveness
Market regime change identification
Key Success Factors
Institutional Intelligence Priority
Decision Hierarchy :
Institutional volume profile positioning (strategic)
YTD POC alignment validation (tactical)
Technical indicator confirmation (execution)
Risk management protocols (defensive)
Discipline Requirements
Systematic adherence to position sizing formulas
Emotional detachment from individual trade outcomes
Institutional level respect over short-term price action
Professional risk management with systematic protocols
Performance Expectations
Win Rate Target : 55-65% (institutional backing advantage)
Risk/Reward Minimum : 2:1 average across all trades
Maximum Drawdown : <8% of trading capital
Consistency : Positive monthly returns 65%+ of time
Disclaimer : All trading involves risk of loss. Past performance does not guarantee future results. Position sizes and risk management protocols must be adjusted based on individual account size and risk tolerance. This analysis is for educational purposes and should not be considered personalized investment advice.
Document Status : Active trading framework requiring weekly updates and quarterly reassessment.
XAUUSD Stable uptrend eyes quick rise to $3695Gold (XAUUSD) has been trading within a short-term Channel Up on the 1H time-frame lately, fueled mainly by its 1H MA20 (red trend-line), with the 1H MA50 (blue trend-line) acting as the last Support.
Right now it is holding the 1H MA20 and as long as it does, we expect it to repeat at least a +1.87% Bullish Leg, similar to the last two. Our immediate Target is $3695.
-------------------------------------------------------------------------------
** Please LIKE 👍, FOLLOW ✅, SHARE 🙌 and COMMENT ✍ if you enjoy this idea! Also share your ideas and charts in the comments section below! This is best way to keep it relevant, support us, keep the content here free and allow the idea to reach as many people as possible. **
-------------------------------------------------------------------------------
💸💸💸💸💸💸
👇 👇 👇 👇 👇 👇

A Gold/GLD Drop Scenario You Should Not IgnoreSometimes you don't need a ton of information.
Sometimes, it's just the right moment when a few facts come together, and you make up your mind.
That's the case now with Gold for me.
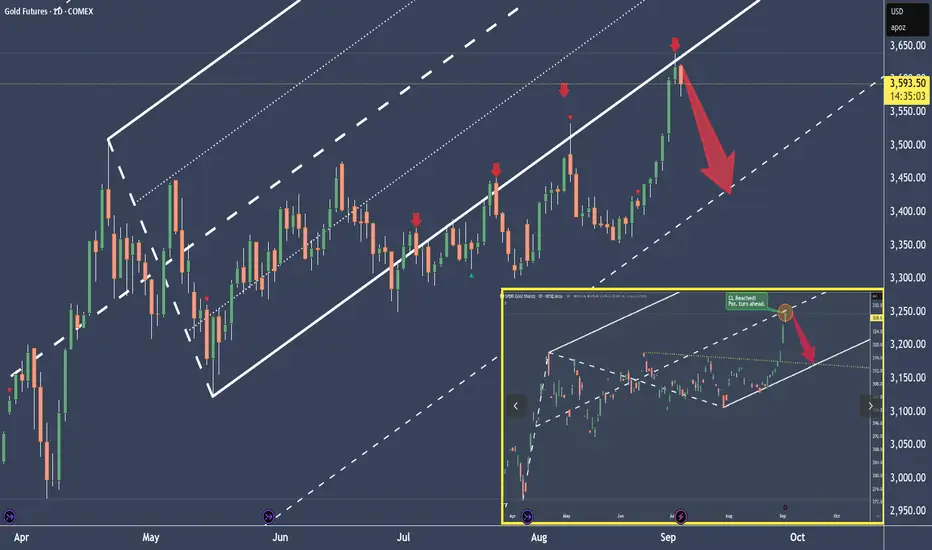
We know that the behavior changed when Gold left the Fork in July.
We also know that if price leaves a Fork, it's highly possible we’ll see a test/re-test at the L-MLH, the lower median line parallel.
Additionally, Allan H. Andrews, the inventor of the Median Lines/Forks, wrote back then that price could also crawl along the parallel line for a longer period. And if price can't manage to jump back into the Fork—regaining the trajectory of the slope—it will trade in the opposite direction sooner or later.
Last but not least: I checked GLD too. Surprisingly it reached the Centerline just yesterday (See screenshot in the right lower corner of the Chart). So price has a high tendency to turn in the opposite direction when balanced again.
So, there you have it.
I’m planning a short, with profits at the WL as my first target.
But what if it goes wrong, if price climbs higher?
Well, then I’ll probably get stopped out, which is nothing more than part of this business.
Any questions?
Don't hesitate to ask me. It's the only way humans learn—by asking questions.
Cheers
§8-)
GOLD hits $3,600 target, market focuses on CPIOANDA:XAUUSD continued to surge, hitting a record high of $3,600/ounce on Friday, following unusually weak U.S. non-farm payrolls data. The market now believes there is a 10% chance the Federal Reserve will cut interest rates by 50 basis points in September, leaving investors wary of the risk of a significant rate cut at this meeting.
The Federal Reserve is likely to cut interest rates by 50 basis points in September
According to the CME's "Fed Watch" tool, the probability of the Fed keeping interest rates unchanged in September is 0, the probability of cutting interest rates by 25 basis points is 88.3%, and the probability of cutting interest rates by 50 basis points is 11.7% (the probability was 0 before the release of non-farm payrolls data).
OANDA:XAUUSD is currently hitting new highs as bulls see a significant slowdown in employment as a sign of more rate cuts. The outlook for gold remains bullish as employment concerns continue to outweigh inflation in the short to medium term.
OANDA:XAUUSD is up 37% this year, driven largely by a weaker dollar, central bank buying, dovish monetary policy and rising geopolitical and economic uncertainty.
Gold itself does not generate interest, but it does well in low- or high-uncertainty environments, making it a safe haven for investors’ money.
The outlook for gold is positive as the Federal Reserve’s independence is under threat following Trump’s attempt to fire Fed Governor Tim Cook, weakening the dollar and boosting investor appetite for the precious metal. Gold traders are focused on next week’s US Consumer Price Index (CPI) data. If inflation continues to decline, that would strengthen the case for a rate cut at the September 16-17 meeting.
Technical Outlook Analysis OANDA:XAUUSD
First, gold has achieved the $3,600 price target and a new all-time high.
Currently, the technical conditions and technical positions are all bullish, with a short-term directional bullish channel and major support from the EMA21. Meanwhile, the Relative Strength Index (RSI) has not provided any signals of a possible correction in momentum, even though it has been operating in the overbought zone (80 to 100) for some time.
In the short term, gold may retest the all-time high, then target around $3,613 in the short term, which is the price point of the 0.382% Fibonacci extension. And the nearest support is noted at $3,574, which is the price point of the 0.236% Fibonacci extension.
As long as gold remains above $3,550, it is not in a position to correct lower, and any dips due to profit-taking should be considered as a short-term move rather than a trend.
Finally, the overall trend of gold is bullish, and the notable points will also be listed as follows.
Support: $3,574 – $3,550
Resistance: $3,600 – $3,613
SELL XAUUSD PRICE 3607 - 3605⚡️
↠↠ Stop Loss 3611
→Take Profit 1 3599
↨
→Take Profit 2 3593
BUY XAUUSD PRICE 3548 - 3550⚡️
↠↠ Stop Loss 3544
→Take Profit 1 3556
↨
→Take Profit 2 3562

GOLD MARKET ANALYSIS AND COMMENTARY - [Sep 08 - Sep 12]This week, the international OANDA:XAUUSD price increased sharply, from 3,436 USD/oz to 3,600 USD/oz and closed the week at 3,586 USD/oz. The reason for the sharp increase in gold price this week is due to the conflict between the Trump administration and the FED increasing when Mr. Trump announced the dismissal of FED Governor Lisa Cook. Previously, Mr. Trump repeatedly attacked FED Chairman Jerome Powell for not reducing interest rates and also threatened to fire Mr. Powell.
In addition, the US non-farm payrolls (NFP) report for August dealt a further blow to the already weak job market, as employers added just 22,000 jobs, far below economists' forecasts of 75,000. The dismal figure followed an equally worrying July report of 73,000 new jobs, while revisions reduced the number by 258,000 jobs from the previous two months. Meanwhile, the unemployment rate rose to 4.3%.
The worsening jobs picture has reinforced expectations that the Fed will cut interest rates at its meeting on September 16-17. Market participants now see a 0.25% rate cut as a near certainty, with some economists even suggesting the Fed could cut rates by as much as 0.5%.
Next week, the US will release two important inflation figures, CPI and PPI. If the monthly core CPI increases by 0.5% or more, it may cause investors to reassess the probability of multiple rate cuts by the FED this year. This will support the USD, which will be detrimental to gold prices next week. On the contrary, if the core CPI increases by only 0.3%, it may cause the USD to fall, supporting gold prices to continue to rise next week.
📌Technically, on the H4 chart, if the gold price maintains its uptrend, it will move up to the next resistance level determined at the Fibonacci extension Fibo261.8 level around the threshold of 3,680 USD/oz. In case of a correction, the support level should be noted around the hard resistance level as well as the dynamic resistance level at the area of 3,450 USD/oz.
Notable technical levels are listed below.
Support: 3,574 – 3,550USD
Resistance: 3,600 – 3,613USD
SELL XAUUSD PRICE 3681 - 3679⚡️
↠↠ Stop Loss 3685
BUY XAUUSD PRICE 3449 - 3451⚡️
↠↠ Stop Loss 3445


Gold at the Crossroads: Decisive Battle at $3,600 After BreakoutAsset: XAUUSD ( Gold Spot / US Dollar )
Analysis Date: September 5, 2025
Current Closing Price: $3,586.54 (as of 12:59 AM UTC+4)
Timeframes Analyzed: 1H, 4H, D, W
Market Context: Record High Territory - Bullish Momentum Sustained
Executive Summary & Market Outlook
Gold (XAUUSD) has executed a critical technical breakout, pushing above the $3,580 resistance and challenging the monumental $3,600 psychological and technical barrier. The asset is in a firm bullish trend but is now testing a zone where profit-taking and fresh selling pressure historically emerge. The price action in the coming sessions will be decisive. A sustained break above $3,600 could trigger a momentum-fueled rally towards $3,650, while a rejection here may form a short-term top, leading to a retracement towards $3,550 support. This analysis integrates multi-timeframe signals for intraday and swing traders.
Multi-Timeframe Technical Analysis
1. Trend Analysis (Daily & 4-Hour Chart):
Primary Trend: Bullish. The sequence of Higher Highs (HH) and Higher Lows (HL) is unequivocal on the daily chart.
Momentum: The breakout above the previous resistance near $3,580 is a significant bullish victory. However, the rapid ascent has left the price extended, increasing the probability of a consolidation or pullback.
2. Key Chart Patterns & Theories:
Breakout & Re-test Pattern: The move above $3,580 has broken the structure of the previous consolidation. The ideal bullish scenario now involves a successful re-test of the $3,580 level as new support. This would confirm the breakout's validity and offer a high-probability long entry.
Elliott Wave Theory: The rally from the last significant low is impulsive in nature. We are likely in a later stage of a Wave 3 or a Wave 5 extension. This suggests that while the trend is up, the cycle is maturing. Wave 4 corrections typically retrace to the 38.2% Fibonacci level of Wave 3, which would be near $3,520.
Gann Theory: The $3,600 level represents a key psychological and mathematical resistance. A decisive break and close above it could open the path to the next Gann angle/resistance level, projected near $3,620-$3,630.
Ichimoku Cloud (H4/D1): Price is trading well above the Senkou Span (Cloud) on both timeframes, confirming the strong bullish trend. The Cloud itself is thick and rising, providing strong dynamic support far below current levels.
3. Critical Support & Resistance Levels:
Resistance (R1): $3,600 - $3,610 (Key Psychological & Technical Barrier)
Resistance (R2): $3,630 (Next Projected Target)
Resistance (R3): $3,650 (Measured Move Target)
Current Closing Price: ~$3,586.54
Support (S1): $3,580 (Previous Resistance - New Potential Support)
Support (S2): $3,550 - $3,555 (Bullish Trend Line & 21-period EMA confluence)
Support (S3): $3,520 (Major Swing Low & 38.2% Fib Retracement)
4. Indicator Consensus:
RSI (14-period on 4H): Reading is in the 68-72 range, touching on overbought territory. This does not signal an immediate reversal but warns that buying momentum may be overextended in the short term. Watch for bearish divergence on the 1H chart for early signs of a pullback.
Bollinger Bands (4H): Price is peeking outside the upper band, a classic sign of a strong trending move. A move back inside the bands will signal a pause in the trend.
Moving Averages: The bullish alignment (EMA8 > EMA21 > EMA50) is perfect on all timeframes. The EMA 21 on the 4H chart (~$3,555) has acted as dynamic support and is a key level for the bullish thesis.
Volume & VWAP: Volume spiked on the initial breakout. The Anchored VWAP (from the recent swing low) shows price is extended above the mean. A pullback to the VWAP would be a healthy development.
Trading Strategy & Forecast
A. Intraday Trading Strategy (5M - 1H Charts):
Bullish Scenario (Breakout Hold): A pullback to the $3,580 - $3,582 area that finds support (e.g., bullish pin bar, engulfing pattern) presents a low-risk long opportunity. Entry: On bullish confirmation at support. Stop Loss: Below $3,575. Target: $3,600 (TP1), $3,610 (TP2).
Bearish Scenario (Rejection at Highs): If price fails to break $3,600 and shows rejection (long upper wicks, RSI divergence), a short trade for a pullback to $3,570 - $3,575 is viable. Entry: On rejection signals. Stop Loss: Tight, above $3,605. Target: $3,565 (S1).
Momentum Breakout: A strong 1H close above $3,605 could be faded with a small long position, targeting $3,620.
B. Swing Trading Strategy (4H - D Charts):
Bullish Bias: The strategy remains "buy the dip." The most attractive zones for adding long positions are a successful re-test of $3,580 or a deeper pullback to the stronger support confluence at $3,550 - $3,555.
Bearish Risk: A daily close back below $3,560 would be a warning sign that the breakout may have failed (a potential bull trap), opening the door for a deeper correction to $3,520. This would invalidate the immediate upside breakout scenario.
Risk Management & Conclusion
Key Risk Events: Monitor for any surprise geopolitical developments or unexpectedly hawkish comments from Fed officials, which could trigger a "flight-to-safety" rally or a dollar-strength selloff in gold, respectively.
Position Sizing: The increased volatility at key levels demands conservative position sizing. Risk no more than 1% of capital per trade.
Conclusion: XAUUSD is at a critical technical and psychological juncture. The breakout is bullish, but the battle for $3,600 is the key to the next directional move. Swing traders should be patient for a better risk/reward entry on a pullback. Intraday traders can play the range between $3,580 and $3,600 until a decisive break occurs. The overall structure favors the bulls, but a period of consolidation is the most likely immediate outcome.
Overall Bias: 🟢 Bullish above $3,555 | 🟡 Neutral/Bearish below $3,560
For individuals seeking to enhance their trading abilities based on the analyses provided, I recommend exploring the mentoring program offered by Shunya Trade. (Website: shunya dot trade)
I would appreciate your feedback on this analysis, as it will serve as a valuable resource for future endeavors.
Sincerely,
Shunya.Trade
Website: shunya dot trade
Disclaimer: This post is intended solely for educational purposes and does not constitute investment advice, financial advice, or trading recommendations. The views expressed herein are derived from technical analysis and are shared for informational purposes only. The stock market inherently carries risks, including the potential for capital loss. Therefore, readers are strongly advised to exercise prudent judgment before making any investment decisions. We assume no liability for any actions taken based on this content. For personalized guidance, it is recommended to consult a certified financial advisor.

Gold. Expect entry into the fifth waveThe current decline looks like the 4th wave
Before it, 3 in 3 is visible
There is an alternative probability of the marking, that the marking will lengthen and we will get a stronger upward impulse.
But in both scenarios there is another increase in quotes with a target of 3600-3650
In general, the growth of gold is due to a reduction in central bank investments from American treasuries.
Just today we described how investments of India and other non-Western countries in American debt are decreasing.
All this spurred the growth of gold quotes

XAUUSD Can it really get to $8000???Gold (XAUUSD) has been practically on a non-stop rally since the last time it tested its 1M MA50 (blue trend-line) 2 years ago (October 2023). It is no coincidence that the result of such a test was an aggressive rally, as this level has historically been Gold's long-term Support and what separates its Bull from its Bear Cycles.
More specifically, Gold has started trading within a multi-decade Channel Up since the August 1993 High. It first Bear Cycle (red Rectangle) started then end finished the moment it touched the pattern's bottom. Shortly after, the price broke sustainably above the 1M MA50, confirming the new Bull Cycle in the form of an internal (green) Channel Up.
This phase peaked a little above the 3.618 Fibonacci extension. That was when the latest Bear Cycle started, which again broke below the 1M MA50 and has been very similar in symmetrical terms to the first one. The new Bull Cycle started after the August 2018 Low.
With the use of the Time Cycles, we can estimate that in October 2029 the current long-term Bull Cycle might end. This doesn't mean that there won't be a sizeable correction until then, but the long-term bullish trend should stay intact.
By October 2029, contact with the Channel's top should have hit $8000, which is still marginally below the current 3.618 Fibonacci extension. This suggests that each of Gold's Time (Super) Cycle is approximately 18 years.
If such a continuous rise is materialized that doesn't only gives meaning to Gold's use as a 'safe-haven' but should also tell us a lot about future inflation and deliver a warning to economies and especially central bank strategy implementation.
-------------------------------------------------------------------------------
** Please LIKE 👍, FOLLOW ✅, SHARE 🙌 and COMMENT ✍ if you enjoy this idea! Also share your ideas and charts in the comments section below! This is best way to keep it relevant, support us, keep the content here free and allow the idea to reach as many people as possible. **
-------------------------------------------------------------------------------
💸💸💸💸💸💸
👇 👇 👇 👇 👇 👇

Gold, Yields, and the Fed: How Monetary Policy Drives Markets
Few forces shape global markets more than U.S. monetary policy. The Federal Reserve’s dual mandate, maximum employment and 2% inflation is the anchor for its decisions. For traders, understanding how these objectives translate into interest rate changes is critical for positioning in gold futures and across the yield curve.
The Fed’s Dual Mandate
1. Maximum Employment: Support jobs and minimize unemployment.
2. Stable Prices (2% inflation target): Prevent runaway inflation or deflation.
The Fed balances these goals using interest rates:
• Raising rates: Cools demand, strengthens the dollar, lifts yield, weighs on gold.
• Cutting rates: Stimulates demand, weakens the dollar, lowers real yields, supports gold.
The tension lies in the trade-off: controlling inflation often hurts employment, while boosting employment risks higher inflation.
Gold and Monetary Policy
Gold is highly sensitive to real interest rates (nominal yields minus inflation):
• Hawkish Fed: Higher real yields, dollar strength, gold struggles.
• Dovish Fed: Lower real yields, weaker dollar, gold rallies.
However, given the recent surge in gold prices despite higher rates, traders must ask:
• Will gold continue rising as odds of rate cuts increase, and when they are eventually delivered?
• Is the traditional correlation between the dollar and gold futures prices breaking down?
Gold’s rally has also been driven by geopolitical tensions and rising long term yields, reflecting rising debt burdens across the globe.
Yield Curve and Monetary Policy
The yield curve reflects expectations about growth, inflation, and Fed policy.
• Short end (1M–5Y): Anchored by Fed policy rates. If markets expect hikes/cuts, the front end moves first.
• Long end (10Y–30Y): Driven by expectations for long-term inflation, growth, and Treasury supply/demand dynamics.
Typically, investors and market participants watch for the following patterns:
• Inverted curve: Short yields > long yields, often a recession signal. See last year’s yield curve.
• Steepening curve: Usually follows Fed cuts, as front-end yields drop faster than the back end.
Two Classic Scenarios
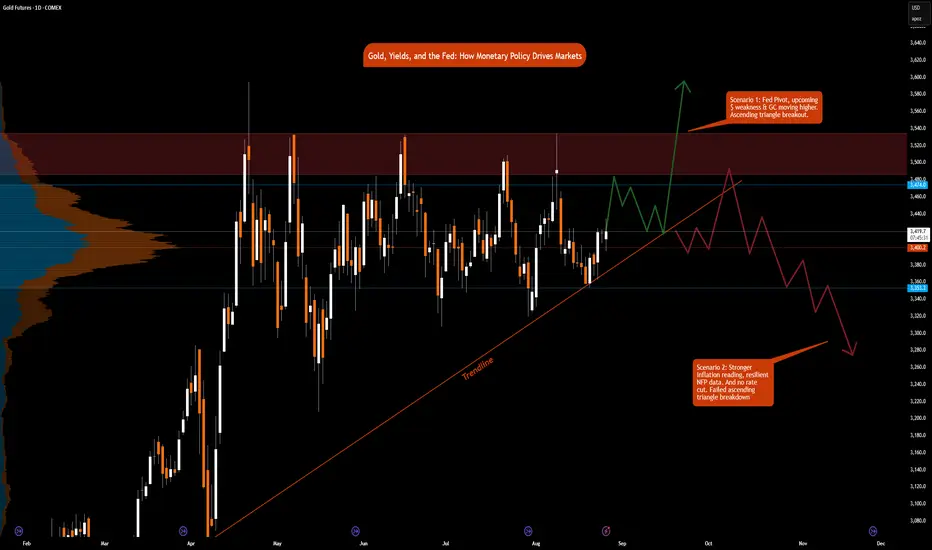
Scenario 1: Inflation Stays High, Jobs Weaken
• Fed resists cutting, prioritizing price stability.
• Gold: Consolidates or weakens (real yields elevated).
• Yield curve: While the short end stays pinned, long end could rise on higher inflation risk and increasing debt worries, signaling stagflation risk.
Scenario 2: Inflation Stabilizes, Jobs Weaken
• Fed pivots dovish, prioritizing employment.
• Gold: Breaks higher on falling real yields.
• Yield curve: Steepens as short yields fall faster than long yields.
The Policy Backdrop
Powell’s last symposium before his term ends, at the Jackson Hole appearance, Fed Chair Powell delivered a dovish pivot, highlighting rising risks to the labor market while downplaying the inflationary effects of tariffs. The reasoning behind this shift deserves its own deep dive, but for now, our focus remains squarely on how monetary policy, specifically interest rate decisions, impacts inflation, growth, supply, and demand in the U.S. economy.
What’s on the Docket Until the Next Fed Meeting (September 17, 2025)
Markets will be glued to data in the coming weeks:
• Aug PCE / Core PCE (Aug 28–29) → Fed’s preferred inflation gauge.
• Aug NFP (Sep 5) → Labor market health; weak print strengthens the case for cuts.
• Aug PPI (Sep 10) → Upstream price pressures; hot numbers signal inflation risks.
• Aug CPI & Core CPI (Sep 11) → Key headline data; softer print supports dovish case.
• Fed Decision (Sep 17) → Will Powell stress inflation vigilance, or shift toward labor concerns?
How the Charts Tie It Together
• Gold Futures:
o Ascending Triangle breakout above resistance towards $3,600, if Fed pivots dovish and deliver a rate cut or a bigger rate cut.
o Ascending Triangle breakdown toward $3,350 if inflation remains sticky and the Fed holds. In this scenario, gold remains in balance overall.
• Yield Curve:
o Short end reacts directly to Fed rate expectations.
o Long end reflects investor conviction on inflation, growth and increasing debt concerns.
Takeaway for Traders
The Fed’s dual mandate creates a constant push and pull between inflation control and employment support. Gold and the yield curve are two of the clearest real-time mirrors of that balancing act:
• Watch short-term yields and gold to gauge how markets are pricing the Fed’s next move.
• Watch the long end of the curve to see whether investors believe inflation is truly anchored.
By linking economic data → Fed mandate → asset price response, traders gain a roadmap that works not just for this Fed meeting, but for every one that follows.
In our next educational blog we will briefly explore other policy tools used by the Fed i.e., QE and QT. Quantitative Easing and Quantitative Tightening.
FRED:FEDFUNDS ECONOMICS:USINTR
CME_MINI:ES1! CME_MINI:MNQ1! CME_MINI:NQ1! COMEX:GC1! MCX:GOLD1!
CBOT:ZB1! CBOT:ZN1!
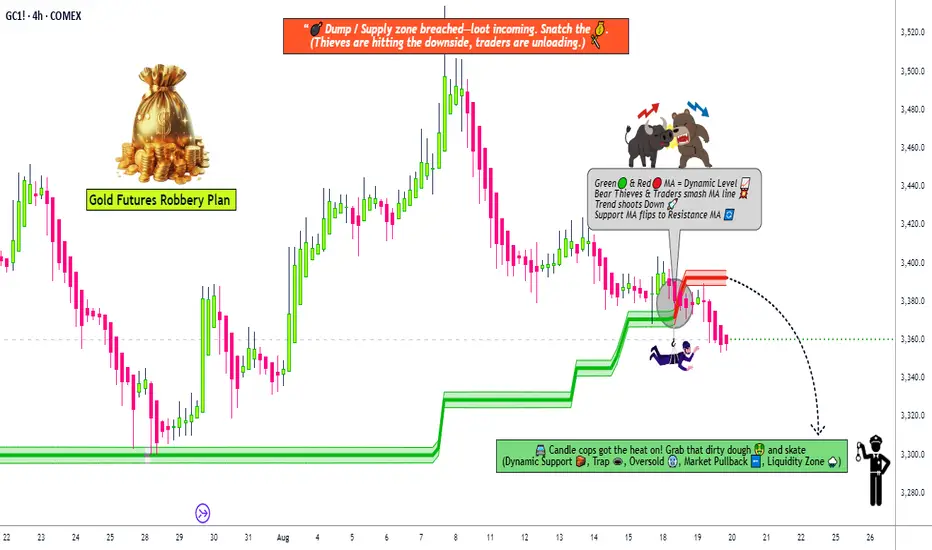
GC1! Thief Trader Mission – Short Gold, Grab the Loot🚨💰 Thief Trader Gold Heist Plan – GC1! "The Gold" Metal Market 🎭🔒
🌟Hey Robbers & Money Makers!🌟
Welcome back to another OG Thief Trader Robbery Plan — today we’re targeting the shining vault of GC1! "The Gold".
This time, the mission is BEARISH. The vault doors are heavy, but with layered sell entries, we’re breaking in! 💣💸
📜 The Plan (Swing/Day Trade)
Entry 🏴☠️: Any price level — but real thieves don’t rush! Use layered sell limit entries like a pro:
🔹 3360.0
🔹 3370.0
🔹 3380.0
(Add more layers if you’re greedy enough 👀💰)
Stop Loss 🛑: Thief SL @ 3400.0 (but remember, OG’s — adjust your SL with your own risk appetite & strategy).
Target 🎯: Police barricade spotted near 3300.0 — our final escape point is 3310.0. Grab the gold & run before the cops catch you 🚔💨.
📊 Thief Strategy 🕵️♂️
We don’t enter with just one order — layering strategy is the art of the heist. Multiple entries = multiple chances to loot the market. Scalpers & swingers both welcome to join this robbery.
📰 Thief’s Outlook (Gold Market Status)
Trend: Bearish bias 🐻
Setup: Short the rallies 🔥
Sentiment: Overloaded bulls = perfect robbery target 🎯
Fundamentals & Macros: Inflation heat & policy shifts keeping gold shaky ⚖️
⚠️ Robbery Warning 🚨
Avoid getting trapped during major news releases 📢.
Protect your loot with trailing stops 🛡️.
Never risk your whole bag on one entry — spread it thief-style.
💖 Support the crew! 💖
Follow, like, and share this heist plan with your robbery gang 🤝. The more OG’s we got, the bigger the score 💎💰.
See you after the escape, thieves — with pockets full & smiles wide 🏆🤑🐱👤
XAUUSD about to make new ATH and head to $3800Gold (XAUUSD) is on a huge rebound following the double bounce on its 1W MA20 (red trend-line), a level which has been previously associated with the start of very strong rallies.
The 2-year Channel Up that started back in October 2023 has always formed a consolidation Triangle before the next Bullish Leg and on the three past occasions that was initiated after a 1W MA20 contact.
Assuming we 'just' repeat the minimum +22.41% Bullish Leg, we are targeting at least $3800 before the current peaks.
-------------------------------------------------------------------------------
** Please LIKE 👍, FOLLOW ✅, SHARE 🙌 and COMMENT ✍ if you enjoy this idea! Also share your ideas and charts in the comments section below! This is best way to keep it relevant, support us, keep the content here free and allow the idea to reach as many people as possible. **
-------------------------------------------------------------------------------
💸💸💸💸💸💸
👇 👇 👇 👇 👇 👇

GOLD (XAUUSD): Bullish! Look For Buys!In this Weekly Market Forecast, we will analyze the Gold (XAUUSD) for the week of Sept 1 - 15th.
Gold has been ranging for months. August closed strong, above the high of July. I am looking for continuation of this bullish momentum in September.
Wait for buying opportunities. Be patient. +FVGs will form, and present the best POIs for long entries.
Enjoy!
May profits be upon you.
Leave any questions or comments in the comment section.
I appreciate any feedback from my viewers!
Like and/or subscribe if you want more accurate analysis.
Thank you so much!
Disclaimer:
I do not provide personal investment advice and I am not a qualified licensed investment advisor.
All information found here, including any ideas, opinions, views, predictions, forecasts, commentaries, suggestions, expressed or implied herein, are for informational, entertainment or educational purposes only and should not be construed as personal investment advice. While the information provided is believed to be accurate, it may include errors or inaccuracies.
I will not and cannot be held liable for any actions you take as a result of anything you read here.
Conduct your own due diligence, or consult a licensed financial advisor or broker before making any and all investment decisions. Any investments, trades, speculations, or decisions made on the basis of any information found on this channel, expressed or implied herein, are committed at your own risk, financial or otherwise.

Gold | Oil | Dollar | Silver | Natural Gas Price ForecastGold | Oil | Dollar | Silver | Natural Gas Price Forecast
COMEX:GC1!
COMEX:SI1!
AMEX:UNG
NYMEX:CL1!

GOLD MARKET ANALYSIS AND COMMENTARY - [Sep 01 - Sep 05]This week, the international OANDA:XAUUSD price increased quite strongly from 3,352 USD/oz to 3,453 USD/oz. The reason for the continued increase in gold price is because investors are still expecting the FED to cut interest rates by 0.25% at the upcoming September meeting, as well as the conflict between the Trump administration and the FED.
Next week, financial markets in the US will be closed for Labor Day on Monday. On Tuesday, the Institute for Supply Management (ISM) will release its manufacturing PMI data. The PMI is forecast to increase slightly to 48.6 in August from 48 in July. If the forecast is correct, it will have a negative impact on gold prices next week.
In addition, on Friday, the US will release the August non-farm payrolls (NFP) report. If the NFP continues to decline compared to the expected 74,000 jobs, it will force the Fed to cut interest rates in September, which will have a positive impact on gold prices next week. On the contrary, a stronger-than-expected NFP growth, combined with an unchanged unemployment rate of 4.2%, could make the market tilt towards the Fed continuing to delay interest rate cuts, causing gold prices to fall next week. However, given the current US economic situation, the August NFP may continue to decline.
📌Technically, on the H4 chart, the gold price broke the Trendline and it is likely that the price will continue to increase to near the threshold of 3500 USD/oz. In case the price corrects again, it will return to the resistance zone at the threshold of 3370.
Notable technical levels are listed below.
Support: 3,430 – 3,400 – 3,371USD
Resistance: 3,450 – 3,500USD
SELL XAUUSD PRICE 3541 - 3539⚡️
↠↠ Stop Loss 3545
BUY XAUUSD PRICE 3369 - 3371⚡️
↠↠ Stop Loss 3365

# XAUUSD Gold Technical Analysis & Trading Strategy Forecast - 2# XAUUSD Gold Technical Analysis & Trading Strategy Forecast - August 2025
Comprehensive Multi-Timeframe Analysis for Intraday and Swing Trading
Current Price: $3,448.12 USD (as of August 31, 2025, 16:03 UTC+4)
24H Change: +0.91%
Monthly Performance: +5.31%
YTD Performance: +37.77%
Market Sentiment: Bullish with Momentum Consolidation
---
Executive Summary
Gold has reached unprecedented heights, trading above $3,400 for the first time in history. Gold rose to $3,448.50 on August 29, 2025, up 0.91% from the previous day, with prices rising 5.31% over the past month and up 37.77% compared to the same time last year. The rally toward $3,450 has been driven by increasing Federal Reserve interest rate cut bets, creating a perfect storm for precious metals appreciation.
Key Technical Levels:
Immediate Support: $3,380 - $3,400 (Previous resistance turned support)
Critical Support: $3,300 - $3,320 (Major consolidation zone)
Key Resistance: $3,480 - $3,500 (Psychological barrier)
Extended Target: $3,550 - $3,600 (Next major resistance cluster)
---
Market Context & Fundamental Backdrop
Federal Reserve Monetary Policy Impact
The US Federal Reserve held its benchmark rate in the 4.25 to 4.5 percent range during its July 2025 meeting, maintaining a cautious stance amid evolving economic conditions. Fed interest rates are driving gold toward $3,500/oz with monetary policy impacts creating significant investment opportunities.
Macroeconomic Environment
Fed Funds Rate: 4.25-4.50% (unchanged but dovish signals emerging)
Inflation Expectations: Moderating, supporting rate cut narrative
Geopolitical Tensions: Elevated, providing safe-haven demand
Dollar Strength: Weakening on rate cut expectations
Gold's Fundamental Drivers
1. Monetary Policy Anticipation: Market pricing in multiple Fed rate cuts
2. Currency Debasement: Continued fiscal expansion supporting hard assets
3. Institutional Demand: Central bank buying and ETF inflows
4. Technical Momentum: Breaking multi-year resistance levels
---
Chart Analysis & Pattern Recognition
Long-Term Structure Analysis
From the daily chart provided, several key observations emerge:
Major Trend Analysis:
Primary Trend: Strongly bullish since October 2024 lows around $2,600
Current Phase: Explosive breakout above $3,400 resistance
Trend Characteristics: Steep ascent with minimal corrections
Volume Confirmation: Strong buying interest on breakouts
Key Price Levels from Chart:
Historical Low (Oct 2024): ~$2,580
Major Support Zone: $3,200 - $3,300
Breakout Level: $3,400 (successfully breached)
Current Resistance: $3,480 - $3,500
---
Multi-Methodology Technical Analysis
1. Candlestick Pattern Analysis
Recent Formation: Strong bullish momentum candles
Pattern: Consecutive higher highs and higher lows
Current Structure: Testing resistance with strong bodies
Volume Analysis: Increasing on advances, light on corrections
Momentum: Sustained buying pressure evident
2. Elliott Wave Theory Analysis
Wave Structure: Completing extended Wave 5 of larger degree
Primary Count: In Wave 5 of Cycle degree from 2020 lows
Current Position: Extended Wave 5 targeting $3,500-$3,600
Subwave Analysis: Minor wave 3 or 5 in progress
Fibonacci Extensions:
- 1.618 extension: $3,520
- 2.618 extension: $3,680
Invalidation Level: Break below $3,300 would reset count
3. Harmonic Pattern Recognition
Active Pattern: Bullish Deep Crab completion zone
Pattern Type: Large timeframe Deep Crab from 2020 lows
Completion Zone: $3,200-$3,400 (completed)
Current Phase: Impulse move following harmonic completion
Next Targets:
- Conservative: $3,550
- Extended: $3,750
4. Wyckoff Market Cycle Analysis
Current Phase: Markup Phase (Distribution Signs Monitored)
Background: Institutional accumulation completed below $3,200
Current Action: Strong markup with broad participation
Volume Characteristics: Healthy on advances, suspect on declines
Warning Signs: Watch for climactic volume above $3,500
Distribution Alerts: Any selling on strength above $3,480
5. W.D. Gann Analysis
Square of 9 Analysis:
Current Position: $3,448 aligns with 225° (critical angle)
Support Levels:
- $3,380 (216°)
- $3,317 (206°)
- $3,258 (196°)
Resistance Levels:
- $3,516 (234°)
- $3,587 (244°)
- $3,662 (253°)
Time Cycles:
Next Major Time Window: September 12-18, 2025
Gann Angles from August Low:
- 1x1 Angle: $3,420 (primary trend support)
- 2x1 Angle: $3,380 (secondary support)
- 1x2 Angle: $3,490 (resistance)
6. Ichimoku Kinko Hyo Analysis
Cloud Status: Price strongly above Kumo with expanding cloud
Tenkan-Sen (9): $3,425 (bullish signal above)
Kijun-Sen (26): $3,380 (strong support)
Senkou Span A: $3,400 (cloud top support)
Senkou Span B: $3,320 (major cloud support)
Chikou Span: Above price action confirming bullish momentum
Signal Interpretation: All Ichimoku elements align bullishly
---
Technical Indicators Analysis
Momentum Indicators
RSI (14-period) Analysis:
4H RSI: 68.5 (approaching overbought but still room)
Daily RSI: 72.3 (overbought but strong trend)
Weekly RSI: 78.2 (extended but not diverging)
Divergence Watch: No negative divergence observed
MACD Analysis:
Signal: Bullish crossover confirmed on all timeframes
Histogram: Expanding positive histogram
Momentum: Accelerating with no signs of weakness
Warning Level: Watch for divergence above $3,500
Volatility & Trend Strength
Bollinger Bands (20, 2):
Current Position: Upper band walk in progress
Band Configuration: Expanding bands indicating strong trend
Squeeze Analysis: Recent expansion from consolidation
Volatility: Increasing supporting continued move
Average True Range (ATR):
Daily ATR: $45-55 (elevated volatility)
Trend Strength: ATR expanding confirming strong trend
Stop Loss Guidance: Use 2x ATR for swing positions
Volume Analysis
Volume Weighted Average Price (VWAP):
Daily VWAP: $3,420 (key support)
Weekly VWAP: $3,350 (major support)
Volume Profile:
- High Volume Node: $3,200-$3,300
- Value Area High: $3,380
- Point of Control: $3,280
Volume Characteristics:
Accumulation Evidence: Higher volume on advances
Distribution Watch: Monitor volume above $3,480
Institutional Activity: Consistent buying support
Moving Average Configuration
Short-term Alignment:
EMA 21: $3,410 (immediate support)
EMA 50: $3,350 (intermediate support)
SMA 100: $3,280 (major trend support)
EMA 200: $3,180 (long-term trend support)
Golden Cross Status: All major averages in bullish alignment
---
Multi-Timeframe Trading Strategy
Intraday Trading Strategy (5M - 4H)
# Primary Bullish Scenario (70% Probability)
Long Entry Opportunities:
Entry 1: $3,420-$3,440 (VWAP support retest)
Entry 2: $3,380-$3,400 (previous resistance turned support)
Entry 3: $3,480+ breakout (momentum continuation)
Stop Loss Levels:
Aggressive: $3,380 (below key support)
Conservative: $3,350 (below VWAP support)
Take Profit Targets:
TP1: $3,480 (immediate resistance)
TP2: $3,520 (Fibonacci extension)
TP3: $3,550 (psychological level)
Risk-Reward Analysis: 1:3.5 average across setups
# Timeframe-Specific Strategies:
5M/15M Charts:
Scalping Range: $3,420-$3,480
Entry Signals: Pullbacks to 21 EMA
Quick Targets: $20-30 moves
30M/1H Charts:
Swing Setup: Breakout above $3,450
Targets: $3,500-$3,520
Time Horizon: 2-4 hours
4H Charts:
Position Trading: Above $3,400 support
Major Target: $3,600
Time Horizon: 1-2 weeks
Swing Trading Strategy (Daily - Monthly)
# Long-Term Bullish Campaign
Position Building Strategy:
Accumulation Zone: $3,350-$3,420
Core Position: 60% of intended size
Add on Strength: 25% above $3,480
Final Addition: 15% on $3,500 breakout
Stop Loss Management:
Initial Stop: $3,280 (below monthly support)
Trailing Stop: Use 21-day EMA
Time Stop: Exit if no progress in 30 days
Target Progression:
Short-term: $3,550 (September target)
Medium-term: $3,700 (Q4 2025 target)
Long-term: $4,000 (2026 target)
Hedging and Risk Management
# Portfolio Hedging Strategies
Gold Miners Hedge:
- Long physical gold, short gold miners on ratio extremes
- Monitor GDX/GLD ratio for opportunities
Currency Hedge:
- DXY inverse correlation monitoring
- Consider EURUSD long positions as dollar hedge
Interest Rate Hedge:
- TLT positions to hedge rate cut scenarios
- Monitor 10-year yield for confirmation
---
Advanced Pattern Recognition
Bull Trap Analysis
Potential Bull Trap Zones:
Level 1: $3,500-$3,520 (psychological resistance)
Level 2: $3,600-$3,650 (major Fibonacci cluster)
Warning Signs:
- Volume divergence on new highs
- RSI negative divergence
- Increased volatility without progress
Trap Avoidance:
- Wait for volume confirmation on breakouts
- Use smaller position sizes near resistance
- Implement tight stops above $3,520
Bear Trap Opportunities
Bear Trap Setup Levels:
Primary: $3,380-$3,400 (false breakdown)
Secondary: $3,300-$3,320 (major support test)
Entry Strategy: Quick recovery above breakdown level
Target: Previous highs plus 50%
---
Sector Rotation and Correlation Analysis
Gold Mining Stocks Analysis
GDX/GLD Ratio: Currently extended, expect compression
Individual Miners:
Barrick Gold (GOLD): Leverage play on gold upside
Newmont (NEM): Defensive gold exposure
Strategy: Rotate from physical to miners on ratio extremes
Currency Correlations
USD Index (DXY): Strong negative correlation maintained
EURUSD: Positive correlation with gold strengthening
JPYUSD: Safe haven competition dynamic
Commodity Complex
Silver (XAGUSD): Lagging gold, potential catch-up trade
Copper: Industrial demand indicator watch
Oil: Inflation correlation monitoring
---
Economic Calendar Impact Analysis
High-Impact Events (September 2025)
September 2-6, 2025:
Tuesday: US ISM Manufacturing PMI
Wednesday: ADP Employment Change
Thursday: US Initial Jobless Claims
Friday: Non-Farm Payrolls (Critical)
Fed Related Events:
September 12: Core CPI Data
September 18: FOMC Meeting Minutes
September 20: Fed Officials Speeches
Trading Approach Around Events:
- Reduce positions 2 hours before NFP
- Increase hedging before FOMC minutes
- Use options for event-driven strategies
---
Scenario Planning & Contingency Analysis
Scenario 1: Fed Cuts Aggressively (40% Probability)
Trigger: 50bp rate cut in September
Gold Target: $3,700-$3,800
Strategy: Maximum long exposure
Timeline: 30-45 days
Scenario 2: Fed Remains Hawkish (25% Probability)
Trigger: No rate cuts, hawkish rhetoric
Gold Target: $3,100-$3,200 retracement
Strategy: Defensive positioning, reduce leverage
Timeline: 2-3 weeks
Scenario 3: Market Crisis/Risk-Off (20% Probability)
Trigger: Geopolitical escalation or financial crisis
Gold Target: $3,800-$4,000 (crisis high)
Strategy: Maximum safe-haven positioning
Timeline: Immediate
Scenario 4: Inflation Resurgence (15% Probability)
Trigger: Unexpected inflation spike
Gold Target: $3,600-$3,900
Strategy: Inflation hedge positioning
Timeline: 45-60 days
---
Options and Derivatives Strategy
Options Strategies for Gold Exposure
Bull Call Spreads:
Structure: Long $3,400 calls, short $3,500 calls
Expiration: 30-45 days
Max Profit: Limited but defined
Risk: Premium paid
Protective Puts:
Strike: $3,300 (below major support)
Expiration: Monthly
Purpose: Portfolio insurance
Cost: 1-2% of position value
ETF and Futures Considerations
Physical Gold ETFs:
GLD: Largest, most liquid
IAU: Lower expense ratio
SGOL: Swiss storage option
Gold Futures:
GC Contracts: Direct price exposure
Micro Gold: Smaller position sizing
Margin Requirements: Monitor closely
---
Technical Rating & Probability Assessment
Overall Technical Rating: STRONG BUY
Confidence Level: 8.5/10
Timeframe Ratings:
Intraday (1H-4H): BUY (85% bullish)
Short-term (Daily): STRONG BUY (90% bullish)
Medium-term (Weekly): STRONG BUY (85% bullish)
Long-term (Monthly): BUY (75% bullish)
Key Bullish Catalysts:
1. Technical Breakout: Clean break above $3,400 resistance
2. Fed Policy: Rate cut expectations building
3. Momentum: All timeframes aligned bullishly
4. Volume: Confirming accumulation patterns
Bearish Risk Factors:
1. Overextension: RSI levels stretched on weekly charts
2. Fed Hawkishness: Potential policy surprise
3. Dollar Strength: DXY recovery could pressure gold
4. Profit Taking: Natural at psychological $3,500 level
---
Weekly Trading Plan & Execution
Week of September 2-6, 2025
# Monday-Tuesday: Consolidation Expected
Strategy: Accumulate on dips to $3,420-$3,440
Targets: $3,480 resistance test
Risk Management: Tight stops below $3,400
# Wednesday-Thursday: Event Risk Management
Strategy: Reduce leverage ahead of economic data
Focus: Defensive positioning pre-NFP
Opportunity: Post-event volatility trades
# Friday: NFP Reaction Strategy
Bullish NFP: Sell the news, expect pullback
Bearish NFP: Add to long positions aggressively
Neutral NFP: Continue trend-following approach
Position Sizing Recommendations
Conservative: 2-3% portfolio allocation
Moderate: 5-7% portfolio allocation
Aggressive: 8-12% portfolio allocation
Risk per Trade: Maximum 1% of total capital
---
Long-Term Investment Thesis
Secular Bull Market Drivers
Monetary Debasement: Continued fiat currency depreciation
Geopolitical Uncertainty: Ongoing global tensions
Central Bank Demand: Record official sector purchases
Supply Constraints: Limited new mine development
Price Targets by Timeline
Q4 2025: $3,600-$3,800
Q1 2026: $3,800-$4,200
End 2026: $4,200-$4,800
2027-2028: $5,000+ potential
Investment Allocation Strategy
Core Holdings: 40% physical gold/ETFs
Trading Position: 30% futures/options
Mining Exposure: 20% quality miners
Cash Reserve: 10% for opportunities
---
Risk Disclaimers and Considerations
Market Risks
Volatility Risk: Gold can experience sharp moves
Liquidity Risk: Reduced liquidity during market stress
Currency Risk: USD movements affect returns
Storage Risk: Physical gold storage considerations
Regulatory and Tax Implications
Tax Treatment: Different rules for physical vs. paper gold
Reporting Requirements: Large position disclosure rules
Regulatory Changes: Potential trading restrictions
Technical Analysis Limitations
Pattern Failure: Technical patterns can fail
Black Swan Events: Unexpected market shocks
Model Risk: Over-reliance on historical patterns
Execution Risk: Slippage and timing issues
---
Conclusion & Strategic Recommendations
Gold's technical picture presents one of the most compelling bullish setups in recent history. Gold closed August with a strong daily close in premium territory, pressing into the 3460–3480 supply zone, with bulls maintaining control of momentum as September opens.
Immediate Action Items:
1. Accumulate Positions: Use any dip to $3,400-$3,420 as buying opportunity
2. Manage Risk: Implement proper position sizing and stop losses
3. Monitor Fed Policy: Watch for dovish signals supporting further upside
4. Prepare for Breakout: Position for potential move to $3,550-$3,600
Key Success Factors:
Discipline: Stick to predetermined risk management rules
Patience: Allow patterns to develop fully
Flexibility: Adapt to changing market conditions
Diversification: Use multiple gold investment vehicles
The confluence of technical, fundamental, and sentiment factors creates a rare alignment supporting significantly higher gold prices. While short-term volatility is expected, the medium to long-term outlook remains decidedly bullish.
Final Rating: STRONG BUY with careful risk management
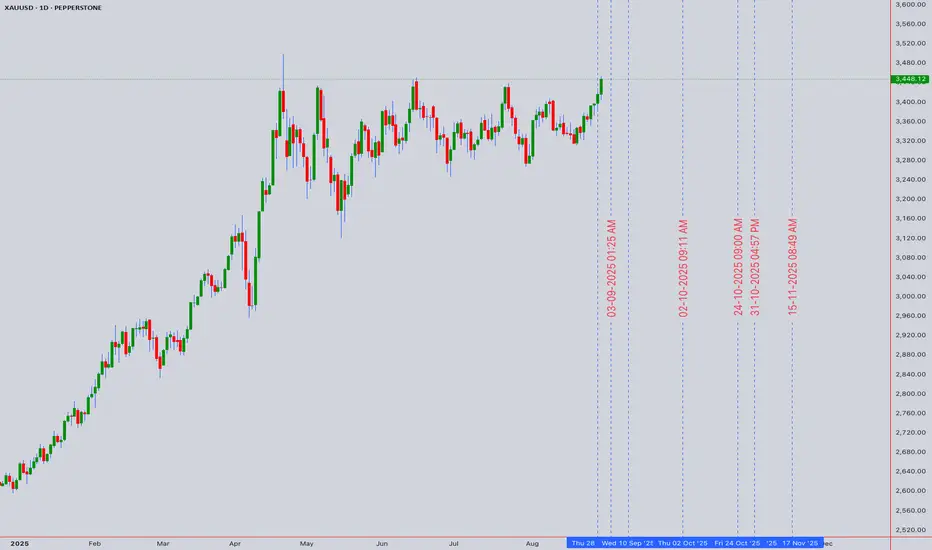

XAUUSD Gold Technical Analysis: Weekly Forecast# XAUUSD Gold Technical Analysis: Advanced Multi-Timeframe Trading Strategy & Weekly Forecast
Current Price: $3,448.12 (As of August 30, 2025, 12:54 AM UTC+4)
Asset Class: XAUUSD / Gold Spot
Analysis Date: August 30, 2025
---
Executive Summary
Gold (XAUUSD) continues its extraordinary bull market trajectory, currently trading at $3,448.12 per ounce, representing a phenomenal 37.77% year-over-year gain. Recent market data confirms gold rose to $3,448.50 on August 29, 2025, posting a daily gain of 0.91% and a substantial 5.31% monthly advance. Our comprehensive technical analysis reveals the precious metal is positioned within a critical resistance zone near $3,390-3,400, forming a pennant/ascending triangle pattern with declining volume suggesting near-term indecision. Analytical forecasts project potential targets of $3,597.89 by end-2025, supported by ongoing monetary accommodation and geopolitical uncertainties.
---
Multi-Timeframe Technical Analysis
Elliott Wave Analysis
Gold's price action demonstrates a complex five-wave impulse structure within a Grand Super Cycle:
Primary Count: Currently in Wave 5 of (5) of - final extension phase
Wave Structure: Completing terminal impulse toward $3,800-4,000 zone
Corrective Potential: Wave 4 completion suggests limited downside to $3,200-3,150
Extended Projection: Long-term targets reach $4,200-4,500 by 2026-2027
Invalidation Level: Break below $3,150 would negate primary bullish count
Fibonacci Relationships: Current wave exhibits 1.618 extension characteristics
Wyckoff Market Structure Analysis
Gold exhibits Wyckoff Distribution Phase characteristics at current elevated levels:
Phase: Early Distribution with testing of supply levels
Volume Analysis: Declining volume on recent advances indicates weakening demand
Price Action: Narrowing ranges with repeated tests of $3,400 resistance
Composite Operator Activity: Institutional profit-taking evident above $3,350
Market Character: Building selling pressure against strong underlying demand
Accumulation Zones: $3,150-3,250 represents potential future re-accumulation
W.D. Gann Comprehensive Analysis
Square of 9 Analysis:
- Current price $3,448.12 positioned at critical 180-degree Gann resistance
- Next major Gann square: $3,721 (360-degree completion from cycle low)
- Time and price convergence: September 18-25, 2025 (Autumn Equinox influence)
- Cardinal Gann levels: $3,481, $3,600, $3,721 (geometric progressions)
Angle Theory Application:
- 1x1 Rising Angle Support: $3,250-3,300 (primary trend support)
- 2x1 Accelerated Angle: $3,500-3,550 (next resistance cluster)
- 1x2 Support Angle: $3,000-3,100 (major correction boundary)
- 1x4 Long-term Support: $2,800-2,900 (secular bull market support)
Time Cycle Analysis:
- 120-day cycle completion due: Mid-September 2025
- Seasonal Gann Pattern: September-October historically strong for gold
- Major time window: October 12-22, 2025 (critical turning point)
- Lunar cycles: New moon September 15 coincides with technical resistance
Price Forecasting & Squaring of Price and Time:
- Immediate resistance: $3,480-3,520
- Primary target: $3,650-3,750
- Extended projection: $3,850-4,000
- Time harmony suggests breakthrough after October equinox
Ranges in Harmony:
- Current range: $3,350-3,480 (compression phase)
- Next expansion: $3,200-3,800 (major trading range)
- Long-term channel: $2,500-4,500 (multi-year projection)
---
Japanese Candlestick & Harmonic Pattern Analysis
Recent Candlestick Formations (Daily Chart)
Doji Patterns: August 28-30 showing indecision at resistance
Long Upper Shadows: Repeated rejection at $3,450-3,480 levels
Bullish Marubozu: August 26 confirming strong buying interest
Volume Divergence: Declining volume on recent rally attempts
Evening Star Formation: Potential three-candle reversal pattern developing
Harmonic Pattern Recognition
Potential Bat Pattern: Completion zone $3,380-3,420 (current area)
ABCD Pattern: Active correction targeting $3,200-3,250
Gartley Formation: Long-term bullish pattern projecting $4,200+
Fibonacci Confluence: Multiple retracement levels converging at $3,250
Advanced Harmonic Analysis
Three Drives Pattern: Completing third drive toward $3,500-3,600
Butterfly Pattern: Extreme extension suggesting $3,150-3,200 correction
Cypher Pattern: Potential reversal zone at $3,600-3,700
Deep Crab Setup: Long-term bullish projection to $4,500-5,000
Bull Trap vs Bear Trap Analysis
Current Setup Assessment:
Bull Trap Probability: 65% - False breakout above $3,450 likely
Bear Trap Potential: 35% - Shallow correction creating buying opportunity
Key Levels: Break above $3,520 negates trap scenario
Volume Confirmation: Required for sustainable breakout above resistance
---
Ichimoku Kinko Hyo Analysis
Current Cloud Structure (Daily Chart)
Price Position: Above Kumo cloud but approaching resistance
Tenkan-sen (9-period): $3,421 (short-term dynamic resistance)
Kijun-sen (26-period): $3,367 (medium-term trend support)
Senkou Span A: $3,394 (leading span A - immediate support)
Senkou Span B: $3,289 (leading span B - key cloud support)
Chikou Span: Approaching resistance at historical price levels
Future Kumo Analysis (26 periods ahead):
- Thinning cloud structure indicating potential volatility increase
- Future resistance zone: $3,500-3,600 (forward-looking cloud top)
- Kumo twist anticipated: Late September 2025
Ichimoku Trading Signals
TK Cross: Tenkan above Kijun but flattening (weakening signal)
Price vs Cloud: Above cloud with momentum slowing
Chikou Span: Potential resistance at $3,450 historical level
Cloud Breakout: Consolidating above cloud with mixed signals
---
Technical Indicators Deep Dive
RSI (Relative Strength Index) Multi-Timeframe
Daily RSI: 58.4 (neutral zone, down from recent highs)
Weekly RSI: 67.8 (approaching overbought but not extreme)
4H RSI: 52.1 (reset from overbought levels)
RSI Divergence: Bearish divergence forming on daily timeframe
RSI Support: 50 level crucial for maintaining bullish momentum
Bollinger Bands Analysis
Current Position: Price at upper band ($3,450 level)
Band Width: Contracting after recent expansion (consolidation)
%B Indicator: 0.89 (near upper extreme but not at 1.0)
Squeeze Formation: Bollinger Band squeeze developing for next move
VWAP Analysis (Volume Weighted Average Price)
Daily VWAP: $3,398 (key support level)
Weekly VWAP: $3,324 (intermediate support zone)
Monthly VWAP: $3,187 (major trend support)
Volume Profile: Highest volume acceptance at $3,250-3,350 zone
Moving Average Structure
10 EMA: $3,412 (immediate dynamic support)
20 EMA: $3,384 (short-term trend support)
50 SMA: $3,298 (intermediate support)
100 SMA: $3,156 (key trend support)
200 SMA: $2,934 (major secular support)
Moving Average Signals:
- Perfect bullish alignment maintained across all timeframes
- Golden Cross pattern firmly established
- Price trading above all major moving averages
---
Support & Resistance Analysis
Primary Resistance Levels
1. R1: $3,480-3,520 (immediate Gann and technical resistance)
2. R2: $3,600-3,650 (major harmonic completion zone)
3. R3: $3,750-3,800 (Elliott Wave 5 target area)
4. R4: $3,900-4,000 (psychological and long-term projection)
5. R5: $4,200-4,500 (Extended Elliott Wave and Gann targets)
Primary Support Levels
1. S1: $3,367 (Kijun-sen and recent swing support)
2. S2: $3,250-3,300 (major accumulation and VWAP zone)
3. S3: $3,150-3,200 (Elliott Wave 4 and harmonic support)
4. S4: $3,000-3,100 (psychological and 1x2 Gann angle)
5. S5: $2,800-2,900 (major secular bull market support)
Volume-Based Support/Resistance
High Volume Node: $3,250-3,350 (institutional accumulation)
Low Volume Gap: $3,450-3,550 (potential rapid movement zone)
Volume Resistance: $3,600+ (historical distribution levels)
POC (Point of Control): $3,285 (maximum volume acceptance)
---
Multi-Timeframe Trading Strategy Framework
Scalping Strategy (5M & 15M Charts)
5-Minute Timeframe Methodology:
Entry Signals: Pullbacks to 20 EMA with RSI <30 in uptrend
Profit Targets: $8-15 per ounce per scalping trade
Stop Loss: $5-8 maximum risk per position
Volume Filter: Above-average volume required for entries
Time Windows: Asian session 1:00-5:00 AM, NY session 8:00-11:00 AM EST
15-Minute Scalping Framework:
Range Trading: Current range $3,420-3,470
Breakout Strategy: Volume confirmation above $3,470 for continuation
Mean Reversion: Fade moves beyond 2.5 standard deviations from VWAP
Risk Management: Maximum 4 positions per session, 1:2 R:R minimum
Intraday Trading Strategies (30M, 1H, 4H)
30-Minute Chart Approach:
Trend Following: Long above EMA cluster ($3,400-3,410)
Pattern Trading: Triangle and flag formations near resistance
Target Methodology: Initial $3,480, extended $3,520-3,550
Risk Parameters: $15-25 stops, 2:1 reward-to-risk minimum
1-Hour Chart Strategy:
Momentum Trading: MACD bullish crossovers with histogram expansion
Support Bounces: Long entries from $3,350-3,400 zone
Resistance Fading: Short opportunities above $3,470 without volume
Session Management: Focus on London AM and NY session overlap
4-Hour Swing Framework:
Cloud Strategy: Long on successful Ichimoku cloud support tests
Elliott Wave: Prepare for Wave 5 completion and subsequent correction
Fibonacci Trading: Use 38.2% and 50% retracements for entries
Hold Duration: 3-10 days for swing positions
Swing Trading Strategy (Daily, Weekly, Monthly)
Daily Chart Methodology:
Breakout Strategy: Long on sustained breaks above $3,520 with volume
Correction Trading: Accumulate on pullbacks to $3,250-3,350
Target Progression: $3,650 → $3,800 → $4,000 sequential targets
Position Management: Scale in on multiple timeframe confirmations
Weekly Chart Analysis:
Primary Trend: Strongly bullish above $3,000 weekly support
Swing Targets: $3,800-4,000 zone for major profit-taking
Risk Management: Weekly closes below $3,150 signal trend change
Monthly Chart Perspective:
Secular Trend: Multi-decade bull market acceleration phase
Long-term Targets: $5,000-6,000 by 2027-2030
Major Support: $2,500-2,800 (unlikely to test in current cycle)
---
Day-by-Day Trading Plan: September 2-6, 2025
Monday, September 2, 2025 (Labor Day - Reduced Liquidity)
Market Conditions: Thin trading expected, potential for gap moves
Technical Setup:
Resistance: $3,470, $3,500, $3,530
Support: $3,400, $3,350, $3,300
Expected Range: $3,380-3,480
Trading Strategy:
Reduced Position Sizes: Holiday conditions warrant caution
Gap Trading: Monitor overnight developments for gap opportunities
Range Strategy: Buy support, sell resistance until breakout
Risk Management: Tighter stops due to thin liquidity
Tuesday, September 3, 2025
Market Outlook: Full participation returns, volatility potential increases
Key Events & Strategy:
Economic Calendar: US manufacturing data and job openings
Technical Focus: $3,450-3,470 resistance cluster test
Fed Watch: Monitor Federal Reserve officials' speeches
Entry Strategy: Long $3,380-3,420 targeting $3,500+
Risk Considerations:
- Dollar strength potential from strong economic data
- Geopolitical developments affecting safe-haven demand
- Interest rate expectations impact on gold
Wednesday, September 4, 2025
Market Outlook: Mid-week momentum with focus on Fed policy signals
Strategic Framework:
Pattern Recognition: Triangle/pennant completion monitoring
Volume Analysis: Institutional participation crucial for breakout
Support Defense: $3,350-3,400 zone strength critical
Breakout Preparation: Position for move above $3,480
Trading Approach:
Momentum Strategy: Follow confirmed breakouts with volume
Contrarian Setup: Fade false breakouts without participation
News Trading: ADP employment data potential market mover
Thursday, September 5, 2025
Market Outlook: Pre-NFP positioning and weekly close dynamics
Key Considerations:
NFP Preparation: Traders positioning ahead of Friday's data
Technical Levels: $3,500-3,550 next major resistance zone
Jobless Claims: Weekly data could influence gold sentiment
Fed Policy: Continued monitoring of rate cut expectations
Execution Strategy:
Trend Continuation: Above $3,450 favors $3,550 target
Profit Scaling: Take profits at $3,500, $3,550, $3,600 levels
Risk Adjustment: Prepare for NFP volatility
Friday, September 6, 2025
Market Outlook: NFP release and weekly close significance
Critical Session Strategy:
NFP Impact: Non-farm payrolls major market catalyst
Weekly Close: Above $3,420 maintains bullish structure
Profit Protection: Secure gains from successful trades
Weekend Risk: Geopolitical and news flow considerations
Trading Framework:
Pre-NFP: Light positioning due to event risk
Post-NFP: React to data with appropriate position sizing
Weekly Levels: Close above $3,450 very bullish, below $3,350 concerning
---
Macroeconomic & Policy Analysis
Federal Reserve Policy Impact
The Federal Reserve's monetary policy stance remains crucial for gold's trajectory. Current fed funds rate at 4.25%-4.50% with markets anticipating rate cuts later in 2025 provides a supportive backdrop for gold. Recent Fed meetings show officials holding rates steady while markets expect 2-3 potential cuts before year-end, representing a shift from earlier expectations.
Interest Rate Environment
Gold has demonstrated remarkable resilience despite restrictive monetary policy, with COMEX gold futures open interest rising 8% following recent Fed meetings. Low gold lease rates at 0.33% indicate weak lending demand, supporting underlying physical demand for the precious metal.
Inflation Dynamics & Currency Debasement
The relationship between Federal Reserve policies and gold prices has intensified, with the precious metal serving as an inflation hedge and currency debasement protection. Rising real yields remain a headwind, but ongoing monetary accommodation expectations support higher gold prices.
Geopolitical Risk Factors
1. Trade Policy Uncertainty: Ongoing tensions affecting global growth
2. Currency Wars: Competitive devaluations supporting gold demand
3. Debt Ceiling Issues: US fiscal concerns driving safe-haven flows
4. Middle East Tensions: Regional conflicts supporting risk premiums
5. China-US Relations: Trade disputes affecting global stability
---
Central Bank Gold Demand & ETF Flows
Central Bank Activity
Net Purchases: Continued central bank accumulation, particularly from emerging markets
Diversification Drive: Move away from dollar-denominated reserves
Strategic Reserves: Gold viewed as portfolio diversification tool
Policy Support: Central bank demand providing price floor
ETF Flow Analysis
GLD Holdings: Monitoring largest gold ETF for institutional sentiment
Retail Demand: Continued interest in gold-backed securities
Flow Patterns: Consistent inflows supporting underlying demand
Market Structure: ETF demand creating physical market tightness
---
Bull Trap vs Bear Trap Assessment
Current Market Structure Analysis
Bull Trap Scenario (65% Probability):
Characteristics: False breakout above $3,470-3,500 resistance
Volume Profile: Declining volume on advance indicating weak breakout
Technical Setup: RSI divergence and overextended conditions
Price Target: Correction to $3,200-3,250 support zone
Time Frame: 2-4 weeks for trap completion
Bear Trap Scenario (35% Probability):
Characteristics: Shallow decline to $3,350-3,300 creating buying opportunity
Volume Confirmation: High volume on support test indicating accumulation
Technical Reversal: Hammer or doji formation at key support levels
Breakout Target: $3,600-3,800 following trap completion
Catalyst Required: Fed dovish pivot or geopolitical escalation
Trap Identification Signals
Bull Trap Confirmation:
- Break above $3,480 on low volume
- Immediate reversal within 24-48 hours
- High volume selling on decline
- RSI failure at resistance level
Bear Trap Confirmation:
- Sharp decline to $3,300-3,350 on moderate volume
- Quick reversal with volume expansion
- Gap up following support test
- Institutional buying evidence
---
Risk Management Comprehensive Framework
Position Sizing Methodology
Scalping Trades: 0.5-1% account risk per trade
Intraday Positions: 1-2% maximum account risk
Swing Positions: 2-3% account risk per established position
Maximum Exposure: 6-8% total gold-related risk allocation
Stop-Loss Implementation
Scalping: $5-10 per ounce maximum
Intraday: $15-30 per ounce based on volatility
Swing Trading: Below key support levels ($3,250 for current longs)
Technical Stops: Elliott Wave and pattern invalidation levels
Profit-Taking Strategy
Scaling Approach: 25% at first target, 50% at second, hold 25%
Trailing Stops: Implement after 2:1 favorable movement
Time-Based Exits: Close before major Fed announcements
Pattern-Based: Honor harmonic and Elliott Wave completion zones
---
Weekly Outlook Probability Matrix
Bullish Scenario (Probability: 45%)
Primary Catalysts:
- Federal Reserve dovish policy signals
- Geopolitical tensions escalation
- Technical breakout above $3,520 with volume
- Weaker US economic data supporting rate cut expectations
Price Objectives:
- Initial: $3,550-3,650
- Extended: $3,750-3,800
- Optimistic: $4,000+
Neutral/Consolidation Scenario (Probability: 35%)
Characteristics:
- Range-bound trading $3,300-3,500
- Mixed economic signals and Fed uncertainty
- Technical indecision at resistance levels
- Declining volatility and volume
Bearish Scenario (Probability: 20%)
Risk Factors:
- Fed hawkish surprise or strong economic data
- Technical breakdown below $3,300 support
- Dollar strength and rising real yields
- Profit-taking from institutional players
Downside Targets:
- Initial: $3,200-3,250
- Extended: $3,100-3,150
- Stress: $3,000-3,050
---
Long-Term Strategic Outlook
Secular Bull Market Analysis
Gold's secular bull market remains intact with multiple supportive factors:
Monetary Debasement: Ongoing currency printing cycles
Debt Sustainability: Growing government debt burdens globally
Demographic Shifts: Aging populations requiring safe assets
Technology Disruption: Digital currencies highlighting gold's role
Multi-Year Price Projections
2025 Year-End: $3,597-3,800 (analytical forecast range)
2026 Target: $4,200-4,500 (Elliott Wave completion)
2027-2030: $5,000-6,000 (secular bull market continuation)
Crisis Scenario: $7,000+ (major monetary system disruption)
---
Conclusion & Strategic Recommendations
Gold (XAUUSD) stands at a critical juncture near $3,448, exhibiting technical characteristics of a mature bull market phase with potential for both continuation and correction. The confluence of multiple analytical methodologies suggests elevated probability for a near-term consolidation or correction before the next major advance toward $4,000+.
Key Success Factors:
1. Federal Reserve Policy Support: Dovish pivot crucial for next leg higher
2. Technical Breakout Confirmation: Sustained move above $3,520 with volume
3. Geopolitical Catalyst: Safe-haven demand supporting higher prices
4. Dollar Weakness: USD decline necessary for gold strength
Critical Monitoring Points:
1. September 18 FOMC Meeting: Next Fed policy decision impact
2. Technical Level Behavior: Response at $3,450-3,520 resistance
3. Volume Patterns: Institutional participation in breakout attempts
4. Global Risk Sentiment: Correlation changes with risk assets
Strategic Recommendation:
Maintain cautiously optimistic stance with tactical flexibility. Current setup favors a Bull Trap scenario with 65% probability, suggesting opportunity to accumulate on pullbacks to $3,250-3,350 zone. Risk management remains paramount given elevated volatility potential and technical setup maturity.
The October time window (12-22) represents a critical juncture for intermediate-term direction, with potential for either final impulse toward $4,000+ or corrective phase toward $3,150-3,200.
---
*This comprehensive analysis is provided for educational and informational purposes only. Gold trading involves substantial risk of loss and may not be suitable for all investors. Past performance does not guarantee future results. Always implement appropriate risk management and consult with qualified financial professionals before making investment decisions.*
---
For individuals seeking to enhance their trading abilities based on the analyses provided, I recommend exploring the mentoring program offered by Shunya Trade. (Website: shunya dot trade)
I would appreciate your feedback on this analysis, as it will serve as a valuable resource for future endeavors.
Sincerely,
Shunya.Trade
Website: shunya dot trade
Disclaimer: This post is intended solely for educational purposes and does not constitute investment advice, financial advice, or trading recommendations. The views expressed herein are derived from technical analysis and are shared for informational purposes only. The stock market inherently carries risks, including the potential for capital loss. Therefore, readers are strongly advised to exercise prudent judgment before making any investment decisions. We assume no liability for any actions taken based on this content. For personalized guidance, it is recommended to consult a certified financial advisor.

Gold Bulls Eye Breakout, But Caution May Be RequiredI'm seeing a lot of bullish calls for a gold breakout this week, and the contrarian within me suspects this could lead to disappointment over the near term. Even though my core bias is for gold to reach new highs eventually. Today I look at market exposure to gold futures from the commitment of traders report alongside key levels on gold's futures chart.
Matt Simpson, Market Analyst at Forex.com and City Index.
