GOLD ANALYSIS 12/18/20251. Fundamental Analysis:
a) Economic:
• USD: After the previous weakening phase, the USD is showing a short-term technical rebound. However, upside momentum remains limited as the market has already priced in most FED expectations.
• U.S. Equities: Moving sideways, with defensive capital flows and a lack of breakout momentum → no strong selling pressure on gold.
• FED: Has entered an easing cycle; the medium–long-term trend continues to support gold. In the short term, the market remains cautious, waiting for new data.
• TRUMP: No new shock policies; political factors are temporarily neutral for gold.
• Gold ETF (SPDR): Yesterday saw a net inflow of 0.86 tons, indicating that large capital is still quietly accumulating rather than exiting gold.
b) Politics:
• Geopolitical tensions have not escalated further, but latent risks remain → gold continues to hold its role as a defensive asset.
c) Market Sentiment:
• Approaching Christmas and New Year, markets are quiet with thin liquidity, increasing the risk of noise and stop-loss hunting.
• Overall sentiment: capital preservation is preferred over aggressive trading; small positions or staying on the sidelines are favored.
2. Technical Analysis:
• The primary trend remains gradually bullish within an ascending price channel.
• Price is holding well above the rising trendline, trading above key MAs, with the higher-low structure intact.
• Supply zone: Around 4350 – 4355; price has reacted multiple times here, making it a strong resistance area.
• Demand zone: Around 4260 – 4263; a previous accumulation area and an important structural low.
• RSI remains in the neutral–high zone, not yet overbought → room for further upside if capital flows in.
⇒ Technical Scenarios:
• A decisive break above the supply zone → opens the possibility of testing 4380 – ATH.
• Failure to break → price may pull back technically to the trendline / demand zone before continuing higher.
RESISTANCE: 4,351 – 4,380 – 4,400
SUPPORT: 4,330 – 4,309 – 4,288
3. Previous Market Session (17/12/25):
• Price gradually moved higher within a narrow range, without any strong breakout.
• Declining volume → confirms the year-end environment and cautious trading behavior.
• No signs of major distribution; bias remains toward high-level accumulation.
• The 4,309 level previously identified held price very well.
4. Today’s Strategy (18/12/25):
🪙 SELL XAUUSD | 4382 – 4380
SL: 4386
TP1: 4374
TP2: 4368
🪙 BUY XAUUSD | 4301 – 4303
SL: 4297
TP1: 4309
TP2: 4315
Gc1!!

Trump's surprise announcement fuels demand for safe havensOANDA:XAUUSD entered a strong and decisive upward trend as two major risks – weakening US economic conditions and escalating geopolitical tensions – converged simultaneously.
In the Asian session on December 18th, spot gold prices remained above $4,330/ounce, following a sharp rise from the previous session. The impetus didn't come from a single factor, but rather a combination of worse-than-expected US labor market signals and a surprisingly tough statement from President Donald Trump regarding Venezuela.
The US non-farm payrolls report released earlier this week presented a mixed picture, but one that was enough to prompt market adjustments to expectations. While 64,000 new jobs were created in November, exceeding forecasts, the unemployment rate surged to 4.6%, its highest level since 2021. This is no longer just technical noise. Unemployment exceeding both market forecasts and the Fed's end-of-year scenarios has raised concerns that the lag in monetary tightening is beginning to erode the labor market.
Against this backdrop, expectations of another Fed easing cycle have returned. Gold, a non-yielding asset, has benefited immediately. The market is still pricing in at least two interest rate cuts in 2026, despite attempts by Fed officials, including Governor Christopher Waller, to cool expectations with the message "no need to rush." This stance offers policy stability, but is not enough to reverse the defensive sentiment that is forming in financial markets.
The real trigger came from geopolitics. Trump's declaration of a "complete blockade" of sanctioned oil tankers entering and leaving Venezuela quickly triggered safe-haven demand. While the extent of its implementation on the ground was unclear, the market perceived it as a policy escalation, bordering on a military-style coercive action. Legal debates immediately erupted in Washington, but for the market, that was secondary: the risk had already been priced in.
Against the backdrop of a slowing US economy, a new turning point in monetary policy, and increasingly unpredictable geopolitics, gold is fulfilling its historical role: absorbing uncertainty. The current rally isn't driven by euphoria, but rather by a systematic defensive reaction. And as long as these variables remain unclear, gold will continue to be a destination for investment whenever confidence in stability is challenged.
Technical Analysis and Suggestions OANDA:XAUUSD
Gold prices are at a crucial turning point in their cycle. After touching and repeatedly testing the historical peak around $4,380 per ounce, the market is showing a clear reality: long-term buying pressure remains, but the short-term upward momentum is slowing down.
On the daily chart, the dominant uptrend remains intact with a structure of higher lows following higher lows, price moving within a medium-term uptrend channel and above key moving averages. However, the repeated failure of the price to definitively close above 4,380 suggests that this area is not only a technical resistance but also a psychological profit-taking zone for large investors.
Using Fibonacci extension from the most recent major uptrend:
• The 1.0 level around $4,380 is the confirmation point for breaking the previous high.
• If gold closes the day clearly above $4,380, the next targets open up at:
o 0.786 around $4,715
o 1.0 extension around $4,940/ounce
These are the areas where the market will shift from technical trading to macroeconomic expectation trading, where interest rate narratives, geopolitics, and confidence in fiat currency play a leading role.
Conversely, the risk of a short-term correction is present. The RSI remains above the neutral zone but has not generated new momentum, reflecting a period of consolidation rather than distribution. If gold fails to break above $4,380 and loses the $4,300-$4,280 support zone, a technical correction scenario could push the price back to:
• $4,245-$4,216 (Fibo 0.236, dynamic support zone)
• Further down to $4,130-$4,100, where the uptrend line and defensive buying converge.
Importantly: this is still considered a correction within an uptrend, not yet a signal of a structural reversal.
At this stage, gold has no shortage of reasons to rise, but the market is demanding greater patience and discipline. Chasing prices at historical highs is a risky strategy; waiting for confirmation or a correction remains a more sensible approach given geopolitical volatility and rapidly changing interest rate expectations.
SELL XAUUSD PRICE 4382 - 4380⚡️
↠↠ Stop Loss 4386
→Take Profit 1 4374
↨
→Take Profit 2 4368
BUY XAUUSD PRICE 4311 - 4313⚡️
↠↠ Stop Loss 4307
→Take Profit 1 4319
↨
→Take Profit 2 4325

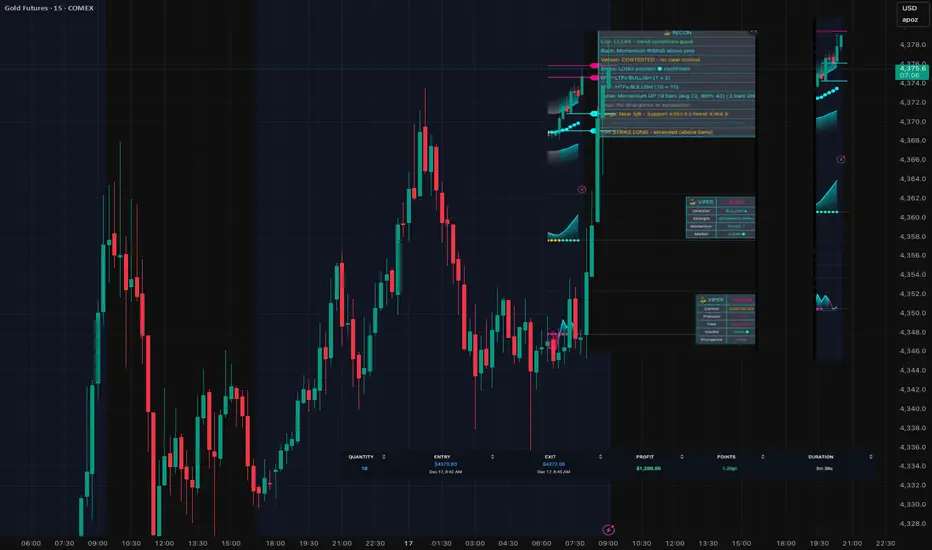
SignalViper Suite — Quick Scalp on Gold FuturesSignalViper Suite — Quick Scalp on Gold Futures (GC)
3-minute trade.
$1,200 profit.
Here's the setup:
RECON showed full alignment:
• Coil: CLEAR — no chop
• Strike: LONG confirmed
• Rush: Momentum RISING
• MTF: All timeframes bullish
• Fangs: Near key S/R levels
The missing piece? Venom was showing CONTESTED — buyers and sellers fighting for control.
I waited.
Next bar, Venom flipped to BUYERS.
That was my trigger. Entry: 4370.80 Exit: 4372.00 Duration: 3 minutes
Result: +1.20 pts on my Apex Trader Fund account. No guessing. No FOMO. Just waited for all 8 indicators to align, then executed. That's what confluence looks like.
Gold Update 17DEC2025: Ending Diagonal Almost Done Market volatility dries up as price approaches the all-time high
Out of the three scenarios posted last time, the first one is playing out
Price is shaping an Ending Diagonal in the final wave up, which should at least retest the record high around $4,400 to complete a full five-wave sequence
Meanwhile, RSI did not build the same bullish momentum and is showing early signs of bearish divergence against price
This confirms that the current move is likely the final wave up and also warns of a possible reversal after price retests the record high
Minor support is located at the previous low around $3,901
Typically, the valley of the larger wave 4 contains the first drop in the event of a reversal
This major support is located near the $3,300 level
Let’s see how price behaves around the all-time high first

GOLD surges after US jobs data, policy uncertaintyOANDA:XAUUSD made a sudden surge during the Asian session on December 17, jumping nearly USD 25 within just a few hours, reaching the 4,327 USD/ounce area before cooling off and consolidating around 4,320 USD/ounce. This was not a “clean” trend-driven rally, but rather a fast market reaction to a series of inconsistent economic signals coming from the US.
This move followed the previous session’s strong volatility, when gold prices reversed multiple times after the Nonfarm Payrolls report. The initial reaction was a sharp rally, consistent with gold’s typical response to weak labor data. However, just minutes later, the market reversed as investors took a closer look at the broader picture: labor conditions were not excessively weak, consumer spending remained resilient, and the Fed had no urgent reason to ease aggressively.
Labor data weak on the surface, firm at the core
The US Bureau of Labor Statistics reported that nonfarm payrolls increased by 64,000 in November, beating expectations, while the unemployment rate rose to 4.6%, the highest level since 2021. This created a “misaligned” data set: jobs are still being added, but the quality of the labor market is beginning to deteriorate.
This very contradiction drove sharp volatility in gold. Initially, the market reacted to the headline: higher unemployment implies the Fed may need to turn more dovish. But once flows calmed, a bigger question emerged: does the Fed really need to ease quickly when consumer spending remains solid?
As a result, expectations for rate cuts in early 2026 remain relatively low, around 25%, indicating that the market is not yet ready to make a strong bet on an aggressive easing cycle.
Monetary policy pulls gold between two opposing forces
Last week, the Fed cut rates by 25 basis points, but the accompanying message remained highly cautious. Interest rate futures currently price in only two modest cuts in 2026, rather than a decisive easing cycle.
In this context, gold — a non-yielding asset — is in a sensitive position:
Benefiting from economic risks, noisy data, and policy uncertainty.
But constrained by the reality that real rates have not fallen deeply enough to build a sustainable upside foundation.
This explains why gold can rally very quickly in the short term, yet is equally prone to sharp corrections shortly afterward.
The broader backdrop: inflation, consumption, and geopolitics
US retail sales data for October were largely flat, showing that consumers are still holding up despite pressure from high prices and the impact of tariffs. This makes it difficult for the Fed to turn more accommodative and is another reason why gold remains stuck in a choppy trading environment.
In the coming days, attention will shift to CPI, jobless claims, and the PCE index. These are not merely economic data points, but key puzzle pieces that will determine whether the low-rate narrative — the long-term foundation for gold — is truly being reinforced.
Personal perspective
This rally is not a confirmation of a new uptrend, but rather a reminder that the gold market is trading in a high-noise environment, where each data release can be interpreted in multiple ways.
Gold is currently reflecting uncertainty in global monetary policy rather than a clear growth story. In such a context, large price swings are not the exception — they are the new normal.
Technical analysis and suggestions OANDA:XAUUSD
The dominant trend for gold remains upward, but it is entering the most sensitive phase of the cycle.
On the daily chart, gold prices maintain a structure of higher highs and higher lows, moving steadily within an upward price channel since Q3 2025. However, the $4,320 – $4,335/ounce range is becoming a short-term distribution zone, where buying pressure is no longer as dominant as during the previous acceleration phase. Prices have approached this area several times but have yet to form a decisive breakout, reflecting the cautious sentiment of large investors.
In terms of momentum, the RSI has moved out of the overbought state but has not yet formed a clear bearish divergence, indicating that the uptrend has not been broken, but is entering a consolidation phase, a technical correction. The current corrections are more of a "cooling" phase than a trend reversal.
Conditions for opening a new uptrend cycle:
The closing price clearly above 4,330 – 4,350 USD, accompanied by increased volume and volatility.
The RSI returns to the region above 65 and remains stable, confirming the return of buying momentum.
When these conditions converge, gold could enter a new sustained uptrend, with a medium-term target extending to the $4,450-$4,600/ounce range, corresponding to the upper boundary of the expanding uptrend channel.
Risk of correction to watch:
Losing the support zone of $4,245 – $4,215 (Fibonacci 0.236 and the nearest consolidation bottom) will trigger stronger profit-taking pressure.
In a negative scenario, gold could retreat further to the $4,050 – $3,970 zone, which could be the convergence of the medium-term moving average and the equilibrium zone of the current uptrend.
Cautious Scenario – Trading on Corrections
If the price clearly fails at $4,330 – $4,350 and short-term weakness signals appear, consider short-term technical selling.
Target: $4,245 → $4,200, with small volume, adhering strictly to discipline as the overall trend remains upward.
SELL XAUUSD PRICE 4392 - 4390⚡️
↠↠ Stop Loss 4396
→Take Profit 1 4384
↨
→Take Profit 2 4378
BUY XAUUSD PRICE 4288 - 4290⚡️
↠↠ Stop Loss 4284
→Take Profit 1 4296
↨
→Take Profit 2 4302

GOLD ANALYSIS 12/17/20251. Fundamental Analysis:
a) Economy:
• USD: Last night, the USD had a technical rebound after US PMI data came in above 50. This caused a short-term USD increase, creating corrective pressure on gold, but it did not reverse the overall trend. Prior to that, weak Nonfarm data, rising unemployment, declining income, and slowing consumption continued to support gold prices.
• US Stock Market: Moving sideways; capital has not exited aggressively → no clear risk-on signal.
• FED: Still in a rate-cutting cycle → medium to long term remains supportive for gold.
• TRUMP: No new statements or policies that could shock the market.
• Gold ETF (SPDR): No significant selling recorded last night → ETF supply is not creating strong pressure on gold.
b) Politics:
• Global geopolitical tensions remain simmering → gold continues to act as a safe-haven asset.
c) Market Sentiment:
• Slight risk-off sentiment after PMI → the market remains cautious, avoiding FOMO.
• Demand remains strong; recently India bought a net USD 10 billion worth of gold, supporting gold at elevated price levels.
• With Christmas and New Year approaching, the market is likely to be quiet with thin liquidity. Reduce position size or stay on the sidelines if needed.
=> Conclusion: News last night only caused a technical correction after the previous rally (driven by earlier news), not strong enough to break gold’s bullish structure. The primary trend remains bullish.
2. Technical Analysis:
M30 Timeframe:
• Price is moving within an ascending channel.
• Demand Zone: 4263 – 4270 acts as a key support area.
• Moving averages continue to provide good support; no structural breakdown.
• Supply Zone: 4350 – 4355 is a strong resistance area where selling previously emerged.
=> Overall Structure: Higher lows – higher highs remain intact.
RESISTANCE: 4330 – 4351 – 4380
SUPPORT: 4288 – 4263 – 4237
3. Previous Session (16/12/25):
• Gradual sideways-to-down movement during the Asian and European sessions.
• Selling pressure weakened as price approached the Demand Zone.
• Strong buying emerged after Nonfarm news, followed by a pullback after PMI data.
• This suggests big players have not exited; the move was mainly a retail shakeout.
4. Today’s Strategy (17/12/25):
🪙 SELL XAUUSD | 4392 – 4390
SL: 4396
TP1: 4384
TP2: 4378
🪙 BUY XAUUSD | 4304 – 4306
SL: 4300
TP1: 4312
TP2: 4318

GOLD falls as signs of peace emerge between Russia and UkraineOANDA:XAUUSD opened the week in a noticeably weaker state. After touching the $4,350/ounce mark, the market quickly reversed course and declined as diplomatic signals related to Russia and Ukraine emerged, eroding the safe-haven role that had supported gold prices for weeks.
This time, the story didn't stem from economic data, but from politics. Progress in peace negotiations with direct participation from the US and Europe, and "leading" statements from President Trump, rapidly changed market sentiment. As geopolitical risks eased, defensive capital flows immediately faltered.
Trump publicly stated that talks with European leaders and Russian President Putin "are going well," and expressed confidence that a peace deal is more possible than ever. At the same time, Ukrainian President Zelensky signaled his willingness to abandon his goal of joining NATO in exchange for security guarantees from the West, a landmark concession in the negotiating logic.
The market reacted very pragmatically. When a prolonged conflict scenario was no longer the only option, the "risk premium" added to the price of gold had to be adjusted. Profit-taking intensified as investors realized that the safe-haven narrative was temporarily interrupted.
On the monetary side, gold also lacks new momentum. Last week, the Federal Reserve cut interest rates by 25 basis points, the third time this year, but at the same time signaled it would act more cautiously. The Fed is entering a "data-waiting" phase, and the market understands that the room for easing is no longer as wide as previously expected.
Now, attention is focused on the US non-farm payrolls and retail sales reports. These figures will determine whether the Fed has sufficient grounds to continue its interest rate cutting cycle next year. With interest rates not expected to fall rapidly, gold, a non-yielding asset, is likely to experience repositioning adjustments.
The current picture suggests that gold is not entering a long-term downtrend, but is losing one of its most important pillars: "market fear." In the short term, the market will continue to trade between monetary policy expectations and geopolitical developments, where every statement from the negotiating table can have an impact no less significant than an economic report.
The core message is clear: gold isn't weakening because it's losing value, but because the world, at least for now, temporarily believes that the biggest risks can be controlled. And in financial markets, that belief, however fragile, is always enough to create volatility.
Technical analysis and suggestions OANDA:XAUUSD
Gold prices are entering a healthy technical correction after failing to break above the resistance zone near the all-time high around 4,330 USD. On the daily timeframe, the uptrend structure remains intact, as higher lows are still being formed and price continues to fluctuate within a medium-term ascending channel.
The current pullback mainly reflects short-term profit-taking pressure as gold approached a psychologically and technically sensitive zone. The 4,245 – 4,216 USD area is acting as a key support, converging with the 0.236 Fibonacci retracement of the latest rally and short-term moving averages. The fact that price is correcting without breaking this zone suggests that large capital is still patiently holding positions.
For a new bullish cycle to form, gold needs to hold firmly above the above-mentioned support zone and achieve a clear daily close above 4,330 USD. At that point, the market would return to a “price discovery” phase, opening room for a move toward new highs.
On the risk side, if the 4,216 USD level is decisively broken, the correction could extend toward 4,130 – 3,970 USD (Fibonacci 0.236–0.382). This would represent a trend rebalancing correction, not sufficient to reverse the medium-term trend unless the higher-low structure is clearly violated.
In terms of indicators, RSI remains above the neutral zone, indicating that the uptrend is still under control. However, short-term momentum is cooling, which aligns with the current consolidation and corrective environment.
Gold is correcting within an uptrend, not reversing. This phase requires patience and discipline—the market rewards positions that align with structure, not emotion.
That concludes the article. Wishing readers a productive and happy working day!
SELL XAUUSD PRICE 4317 - 4315⚡️
↠↠ Stop Loss 4321
→Take Profit 1 4309
↨
→Take Profit 2 4303
BUY XAUUSD PRICE 4245 - 4247⚡️
↠↠ Stop Loss 4241
→Take Profit 1 4253
↨
→Take Profit 2 4259

GOLD ANALYSIS 12/16/20251. Fundamental Analysis:
a) Economic:
• USD: Stable after a pullback → no longer a strong driver pushing gold higher.
• U.S. equities: Moving sideways → capital waiting for news, not yet risk-on.
• FED: Entering a rate-cut cycle → supportive in the medium–long term, but already priced in for the short term.
• TRUMP: No new policies or statements → neutral impact.
• Gold ETFs: SPDR sold 1.43 tons → short-term profit-taking pressure, consistent with a distribution-at-the-top phase → negative for gold. If SPDR continues selling, gold could drop sharply.
b) Politics:
• No new geopolitical shocks → gold lacks a catalyst for a breakout.
c) Market Sentiment:
• Heavy news flow, defensive sentiment ahead of key events.
• Large capital tends to perform technical selling – shaking out positions before choosing a direction.
2. Technical Analysis:
• Price is within a mildly ascending channel, but with lower highs → sign of a weakening trend.
• 4,330 – 4,350: Strong resistance, aligns with MA and upper channel boundary → ideal sell zone.
• 4,300 – 4,306: Current consolidation area, no clear momentum → choppy zone.
• 4,260 – 4,250: Key demand zone; a break below opens the door for a deeper drop.
• RSI: Weak rebound, unable to break above 50–55 → buyers lack initiative.
• MA: Flat, showing no clear trend.
=> Current structure: Sideways with a bearish bias.
RESISTANCE: 4,330 – 4,351 – 4,380
SUPPORT: 4,288 – 4,263 – 4,237
3. Previous Session (15/12/25):
• Gold failed to break resistance and was pushed lower within the channel.
• SPDR selling + stable USD → sideways market, draining buying momentum.
• Main trend: Wide-range sideways – position shakeout.
4. Today’s Strategy (16/12/25):
🪙 SELL XAUUSD | 4317 – 4315
SL: 4321
TP1: 4309
TP2: 4303
🪙 BUY XAUUSD | 4263 – 4265
SL: 4259
TP1: 4261
TP2: 4267

XAUUSD Same sell signal for 3rd time in past 2 months.Gold (XAUUSD) got rejected and turned sideways just before hitting the Higher Highs trend-line of the underlying rising channel. In the past 2 months we've seen this exact same Sell Signal another 2 times. Even the current 4H RSI sequence matches those peaks.
Those previous Sell Signals eventually made the price pull-back below the 4H MA100 (green trend-line). This time the current Support is the Higher Lows trend-line and of course the 1D MA50 (red trend-line) which continues to keep the long-term bullish trend intact.
As a result, we are targeting 4180 at least in the coming days, which is still above the 0.618 Fibonacci retracement level which supported the previous -5.84% Bearish Leg.
---
** Please LIKE 👍, FOLLOW ✅, SHARE 🙌 and COMMENT ✍ if you enjoy this idea! Also share your ideas and charts in the comments section below! This is best way to keep it relevant, support us, keep the content here free and allow the idea to reach as many people as possible. **
---
💸💸💸💸💸💸
👇 👇 👇 👇 👇 👇

"A super week" of employment dataNext week will not be a normal trading week. This is the time when the market is forced to answer a big question: will the Federal Reserve's policy pivot be sustainable, or merely a tactical adjustment in a cycle still fraught with uncertainty?
Following its December interest rate decision, the Fed officially cut rates by 25 basis points as expected. However, the market reaction showed that the key wasn't the number, but the underlying message. The dotplot chart indicated very limited, even cautious, room for further rate cuts in 2026. Nevertheless, the less hawkish statements from Chairman Jerome Powell, coupled with the Fed resuming short-term Treasury bond purchases to stabilize liquidity, produced a clear consequence: the US dollar weakened faster and more deeply than anticipated.
Against this backdrop, the upcoming trading week is seen as a "test of resilience" for the USD, as key employment and inflation data are released simultaneously, and the three major central banks in Europe and Asia also come into the spotlight.
Fed: Not overly dovish, but enough to change market expectations
On the surface, the Fed's decision resembles a "soft hawk": cutting interest rates, but the dotplot for 2026 is quite limited. However, the structure of the dotplot reveals a less-noticed fact: no single viewpoint clearly dominates.
Four members are against cutting interest rates in 2026, four support another cut, and four others lean towards two cuts. Overall, this is not a policy consensus.
More importantly, the Fed has proactively restarted short-term Treasury bond purchases as a reserve management tool. While not explicitly called quantitative easing, this move sends a clear signal: the Fed is willing to sacrifice "formal hawkishness" to ensure real financial stability.
Powell's remarks at the press conference, emphasizing the risks of a weakening labor market and viewing inflationary pressures from tariffs as temporary, reinforced the belief that the Fed would prioritize jobs over continuing to push inflation at all costs. This quickly led the market to reassess the likelihood of interest rate cuts next year, with the dollar becoming the first to face pressure.
This week shapes expectations, leaving no room for complacency.
Next week marks a period where global monetary policy expectations begin to diverge significantly. The Fed has taken a step back, but not quite surrendered. The BoE is at a crossroads of easing. The ECB maintains a balanced stance with controlled confidence. The BOJ, meanwhile, is trying to break free from its own shadow.
Against this backdrop, volatility in the foreign exchange, gold, and risk assets markets in general is likely to increase. This is not a time for emotional trading, but rather a time that demands discipline, selectivity, and the ability to correctly interpret the policy message behind the numbers.
The upcoming data week will not only answer the question of “what happened,” but more importantly, it will reveal who is truly controlling the global monetary policy narrative in 2026.
Technical Analysis and Suggestions OANDA:XAUUSD
The daily chart of gold prices shows a new uptrend being relatively fully confirmed, both in terms of price structure and momentum.
After a sharp correction from the previous peak, gold did not break the long-term uptrend structure, but only retreated to test important dynamic support zones. The price quickly held firm at the 0.236 Fibonacci level around $4,120–$4,130 per ounce, while continuing to move within the medium-term uptrend channel. This indicates that active buying pressure remains in control of the market, and selling pressure is more profit-taking than a trend reversal.
Short- and medium-term moving averages maintain an upward slope, acting as a "price cushion" during corrections. After a cooling-off period, the RSI has returned to equilibrium, leaning toward an uptrend, reflecting that upward momentum is being re-accumulated rather than weakening.
Structurally, the continuous formation of higher lows, accompanied by shallow corrections, is a typical sign of a strong uptrend. If the resistance zone around $4,330/ounce is decisively broken, the market could enter a new phase of extended upward movement.
The next technical targets are identified at:
• $4,380–$4,400/ounce: an extension zone within the ascending price channel and Fibonacci extension.
• In a scenario with stronger momentum, the price could head towards the $4,500/ounce region in the medium term.
The risk of a downward correction lies in the scenario where the price fails to break above $4,330/ounce and reverses to break the support zone of $4,200–$4,180/ounce. In that case, gold could retreat further to the $3,970–$3,850/ounce area (Fibonacci 0.382–0.5). However, as long as the price remains above this zone, the major uptrend is not yet invalidated.
Given the overall upward trend, current corrections should be viewed as opportunities for repositioning, rather than hasty reversal signals.
SELL XAUUSD PRICE 4366 - 4364⚡️
↠↠ Stop Loss 4370
→Take Profit 1 4358
↨
→Take Profit 2 4352
BUY XAUUSD PRICE 4168 - 4270⚡️
↠↠ Stop Loss 4264
→Take Profit 1 4276
↨
→Take Profit 2 4282

Gold has been moving in a strong bullish channel, but it is now Technical View:
Resistance Zone: The price is climbing towards a significant supply area between 4540.00 and 4633.00 (marked in red).
Channel Top: This resistance zone aligns perfectly with the upper boundary of the ascending channel.
Expectation: As price hits this upper structure, there is a high probability of a rejection or a pullback. I am watching for bearish reactions from this level to potentially correct downwards (as shown by the arrows).
Trade with care and manage your risk.
OANDA:XAUUSD FOREXCOM:XAUUSD ICMARKETS:XAUUSD SAXO:XAUUSD TVC:GOLD FOREXCOM:GOLD

GOLD ANALYSIS 12/15/20251. Fundamental Analysis:
a) Economic Factors:
• USD: The USD continues to weaken after the Fed eased monetary policy. This weakness supports gold in the medium term, though short-term technical rebounds in the USD may cause volatility.
• U.S. Equities: U.S. stock markets remain range-bound after the news, not creating significant risk pressure on gold.
• FED: Entering an interest rate–cutting cycle, supportive for gold.
• TRUMP: No new market-shocking statements; policies remain protectionist in nature – medium-term positive for gold.
• Gold ETF (SPDR): SPDR has returned to net buying, confirming that large capital flows remain on the gold side in the medium–long term.
b) Political Factors:
• Global geopolitical tensions remain simmering and have not fully cooled → gold continues to hold its role as a safe-haven asset.
c) Market Sentiment:
• After the ~96-point crash on 12/12, market sentiment shifted toward caution and defense.
• Major players prioritize re-accumulation at lower price zones, avoiding chasing prices.
2. Technical Analysis:
• Major trend: Bullish (higher high – higher low structure remains valid).
• The sharp sell-off was a liquidity sweep, with strong price reaction at Key Support 4263.
• Current price: Sideways accumulation within the range 4288 – 4309.
• Short-term EMAs are flattening → market compression.
• RSI: Recovered from oversold, moving back into neutral territory.
• Main scenarios:
Holding above 4288 → accumulation → continuation higher
Breaking below 4288 → retest of 4263
RESISTANCE: 4,309 – 4,330 – 4,351
SUPPORT: 4,288 – 4,263 – 4,237
3. Previous Session (12/12/25):
• Gold surged strongly after the news → triggered FOMO BUY.
• Followed by a sharp 96-point sell-off, sweeping BUY stop-losses and collecting liquidity.
• Session close: gold did not break the bullish structure, but shifted into sideways accumulation.
=> This is typical behavior of professional markets, not a trend reversal, mainly a market clean-up. Before the crash, RSI was overbought across all timeframes with clear bearish divergence → not surprising, hard to get trapped at the top.
4. Trading Strategy for Today (15/12/25):
🪙 SELL XAUUSD | 4366 – 4364
SL: 4370
TP1: 4358
TP2: 4352
🪙 BUY XAUUSD | 4268 – 4270
SL: 4264
TP1: 4276
TP2: 4282

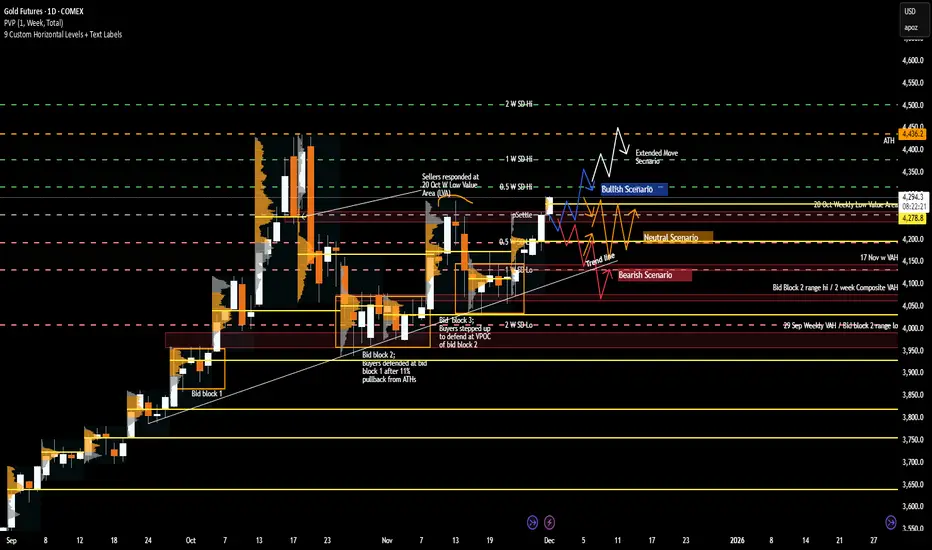
Gold Weekly Playbook: Key Levels, Scenarios & Sentiment Triggers1. Macro Update
Gold continues to trade within a macro environment defined by shifting rate expectations and evolving recession probabilities. With the Fed maintaining a data-dependent stance, the market remains highly sensitive to inflation and employment prints. Cooling inflation supports the case for rate cuts, pulling real yields lower and creating a constructive backdrop for gold.
Conversely, stubborn inflation pushes the narrative toward “higher for longer,” often slowing upside momentum and encouraging more rotational price action. This doesn’t immediately turn GC bearish, but it does cap impulsive continuation as traders reassess forward guidance.
Recession sentiment is the second major driver. Rising recession odds tend to benefit gold as investors rotate into safe-haven assets, even without imminent Fed easing. A persistent soft-landing narrative—stable labor markets, steady consumption—can reduce defensive flows and temper gold’s velocity. Overall, the macro backdrop remains cautiously supportive, but still very catalyst-driven.
2. What Has the Market Done?
Gold has exhibited constructive price action, with the recent week imbalancing up and out of the 17 Nov weekly balance/value area. Importantly, the market closed at the highs of the week, signaling sustained buyer aggression and broad acceptance of higher prices.
Weekly value and Volume point of Control (VPOC) have shifted upward, reinforcing a meaningful change in participant behavior: buyers are willing to transact at progressively higher prices, and sellers have not shown the ability to force price back into prior balance. This upward migration of value marks a firm shift in short-term sentiment.
The market is also now at an important structural zone at 4251.3—the 13 Oct weekly VPOC and the 20 Oct weekly Low value area (LVA). How the market reacts at this level—rejecting, stalling, or accepting—will be a telling indicator of whether buyers maintain control or whether sellers can slow the advance.
3. What to Expect in the Coming Week
The key level to watch this week:
4254.9 - Previous week/month’s settlement price
This level acts as a major pivot for directional conviction. Holding above settlement supports the case for continuation; a sustained move below it increases the likelihood of rotation or deeper testing.
Bullish Scenario
If the market holds and accepts above 4254.9, upside continuation becomes likely.
Target 1: 4378.6 (Weekly 1 Standard Deviation (SD) High) – expect responsive sellers.
If market accepts above 4378.6:
Target 2: 4436.2 (ATH region) – extended bullish objective.
Bearish Scenario
If the market fails to hold above 4254.9, expect sellers to target 4195.3 (previous week’s VPOC).
Additional downside triggers:
If buyers cannot reclaim 4261.3 (previous week’s high), pressure may push price through prior value toward 4136.5.
If buyers then fail to reclaim back above 4195.3:
Next target: 4131.2 (Weekly 1 SD Low / 17 Nov VPOC / Bid Block 3 midpoint).
Continued seller control may extend the move toward 4070/80, aligned with the 2-week composite VAH and upper boundary of Bid Block 2.
Neutral Scenario
If neither buyers nor sellers show conviction, expect two-way consolidation around previous week’s settlement, 4254.9, between 4316.7 and 4193.1 (10 Nov weekly high / 20 Oct LVA / weekly 0.5 SD high).
This remains the most probable balance zone unless a macro catalyst drives breakout behavior.
This week’s structure is clean: one major pivot and clearly defined pathways for both sides. Whether GC breaks out or slips back into rotation will hinge on how price behaves around 4254.9.
What’s your outlook for Gold this week? Drop a comment and give this post a boost so more traders in the community can join the discussion!
Disclaimer: This is for educational purposes only and not financial advice. Always trade your own plan with proper risk management.
GOLD: Bullish! Buy The Dip!In this Weekly Market Forecast, we will analyze the Gold (XAUUSD) for the week of Dec. 15 - 19th.
Gold doesn't have the USD to weigh it down, thanks to the interest rate cut by the Fed. Things are looking up!
Be mindful of a short term pullback my be in the offing.... and there in lies the opportunity to long this market to a new ATH.
Enjoy!
May profits be upon you.
Leave any questions or comments in the comment section.
I appreciate any feedback from my viewers!
Like and/or subscribe if you want more accurate analysis.
Thank you so much!
Disclaimer:
I do not provide personal investment advice and I am not a qualified licensed investment advisor.
All information found here, including any ideas, opinions, views, predictions, forecasts, commentaries, suggestions, expressed or implied herein, are for informational, entertainment or educational purposes only and should not be construed as personal investment advice. While the information provided is believed to be accurate, it may include errors or inaccuracies.
I will not and cannot be held liable for any actions you take as a result of anything you read here.
Conduct your own due diligence, or consult a licensed financial advisor or broker before making any and all investment decisions. Any investments, trades, speculations, or decisions made on the basis of any information found on this channel, expressed or implied herein, are committed at your own risk, financial or otherwise.

Will GOLD create a new ALL TIME HIGH before the year is over?COMEX:GC1!
Becoming Profitable in the Auction, is a choice only chosen by the 'PROFITABLE'...
As of December 14, 2025, the GC1 gold futures contract has risen by approximately 63.9% to 65.6% so far this year. This has been a 'RECORD-BREAKING YEAR' in the metals markets for GOLD. Truly this year is going down in the history books to come. First we hit $3K then $4K and now were here around $4.3K per troy ounce. AMAZING!!! Now this is the KEY question, will the BULL MARKET CONTINUE? Late October we had a strong correction to the downside for about -11.2% and since then we have gained back around +10.2% back headed for Octobers ATH. The ATH price has yet to be broken sitting at $4,435 per troy ounce. Will buyers push and break this HIGH before the year is over, or will sellers hold them off and push lower in the auction? Lmk in the comments...
Continued Success,
TreyHighPwr

GOLD (XAUUSD): bullish-Neutral! Prepare To Buy!In this Weekly Market Forecast, we will analyze the Gold (XAUUSD) for the week of Dec. 8 - 15th.
Gold closed last week indecisive. It has been moving sideways inside a bullish FVG, that continues to act as support.
Prepare for a short term pullback.... and buy it.
Mindful that FOMC is Wednesday, and the USD is weakened with the expectation of a .25 rate cut.
Enjoy!
May profits be upon you.
Leave any questions or comments in the comment section.
I appreciate any feedback from my viewers!
Like and/or subscribe if you want more accurate analysis.
Thank you so much!
Disclaimer:
I do not provide personal investment advice and I am not a qualified licensed investment advisor.
All information found here, including any ideas, opinions, views, predictions, forecasts, commentaries, suggestions, expressed or implied herein, are for informational, entertainment or educational purposes only and should not be construed as personal investment advice. While the information provided is believed to be accurate, it may include errors or inaccuracies.
I will not and cannot be held liable for any actions you take as a result of anything you read here.
Conduct your own due diligence, or consult a licensed financial advisor or broker before making any and all investment decisions. Any investments, trades, speculations, or decisions made on the basis of any information found on this channel, expressed or implied herein, are committed at your own risk, financial or otherwise.

GOLD ANALYSIS 12/09/20251. Fundamental Analysis:
a) Economy:
USD:
The USD is moving in a narrow range without strong breakout momentum. Investors expect the Fed to cut rates in upcoming quarters, which weakens the USD’s ability to pressure gold downward. However, when SPDR sells, the supportive effect of a weaker USD on gold diminishes significantly.
U.S. Stocks:
U.S. equities remain in a risk-on state, rising on expectations of tax policy changes and speculative capital rotating back into stocks. This creates short-term downward pressure on gold and opens room for deeper corrective waves.
FED:
The Fed maintains a “data-dependent” stance but leans toward rate cuts if inflation continues to ease. This supports gold in the mid-term, though in the short term, it’s not strong enough to prevent price declines when ETFs are selling.
TRUMP Administration:
Trump’s administration prioritizes tax cuts and support for businesses → bullish for equities.
Conversely, this pressures gold unless geopolitical risks emerge.
Trade-war-style tensions with China still form a background long-term risk that can support gold.
Gold ETF – SPDR:
SPDR has sold lightly for two consecutive sessions, weakening institutional demand.
→ This is an important signal that makes gold more vulnerable and increases the probability of scenario 02 on the chart.
b) Geopolitics:
Tensions in the Red Sea, the Middle East, and Ukraine remain unresolved. While not causing major market shocks, these risks maintain a latent risk-off environment where gold can spike sharply on any negative headline.
c) Market Sentiment:
Market sentiment is currently neutral-to-bearish, making gold more likely to follow a corrective pattern. Traders are waiting for clearer signals from economic data and geopolitics.
2. Technical Analysis:
15-minute timeframe:
Price is hugging the ascending trendline, but selling pressure is dominant.
RSI is in a short-term neutral zone → potential for a minor pullback.
Market structure leans toward breaking support at 4,174 – 4,163 if selling continues.
Two main scenarios:
01 – Technical pullback then continuation down toward 4,193 and a rebound if this level holds.
02 – Deep decline into major accumulation zone (if risk-on strengthens):
• A break below 4,174 opens the path to:
4,147
4,120
→ This is the strongest BUY zone of the day.
RESISTANCE: 4,219 – 4,239 – 4,263
SUPPORT: 4,174 – 4,163 – 4,120
3. Yesterday’s Market (8/12/25):
Gold moved in a narrow sideways range as expected.
No strong bullish momentum due to lack of catalysts.
SPDR’s light selling allowed gold to maintain its upward structure.
Low volume → price action prone to noise and false breaks.
4. Trading Strategy for Today (8/12/25):
🪙 SELL XAUUSD | 4221 – 4219
SL: 4225
TP1: 4213
TP2: 4207
🪙 BUY XAUUSD | 4160 – 4162
SL: 4156
TP1: 4168
TP2: 4174

GOLD MARKET ANALYSIS AND COMMENTARY - [Dec 08 - Dec 12]At the beginning of this week, international OANDA:XAUUSD prices fell from 4,264 USD/oz to 4,164 USD/oz, then recovered to 4,259 USD/oz, before declining again and closing the week at 4,198 USD/oz.
International gold prices continue to rise, hovering around 4,200 USD/oz as U.S. inflation remains relatively stable and data shows the country’s labor market is clearly slowing, reigniting expectations of interest rate cuts ahead of the upcoming Federal Reserve meeting. According to CME’s FedWatch tool, the market is once again pricing in nearly a 90% probability that the Fed will continue cutting interest rates at next week’s meeting.
According to many experts, an interest rate cut by the Fed at the upcoming meeting may not significantly affect gold prices next week, as this has already been priced into gold during recent trading sessions. However, if the Fed signals more rate cuts in 2026 compared to the guidance given at its September meeting, it could provide a stronger boost for gold prices.
Besides pressure from lower interest rates, the U.S. is also facing a large budget deficit and massive public debt, meaning it will have to inject a considerable amount of money into the economy. This not only carries the risk of driving inflation higher but also poses potential instability for the U.S. economy in particular and the global economy in general.
Overall, the future trajectory of gold prices will depend on whether the Fed continues to ease monetary policy, or whether macroeconomic conditions—such as weaker growth or rising geopolitical risks—emerge. To reach a new all-time high, gold prices will require a combination of more aggressive Fed rate cuts, continued weakening of the U.S. dollar, stronger safe-haven demand, and especially more robust gold buying from central banks.
In addition to the Fed’s monetary policy meeting, the Reserve Bank of Australia, the Bank of Canada, and the Swiss National Bank will also announce their interest rate decisions. The market expects all three central banks to keep interest rates unchanged.
📌Technically, gold is showing signs of sideways movement with a narrowing range on the H4 chart, the resistance level is established around the 4,264 mark, breaking through this level will create momentum for gold prices to find the 4,380 mark. In case gold prices trade below the 4,200 mark, next week the price may only fluctuate in the range of 4,100-4,265 USD/oz.
SELL XAUUSD PRICE 4222 - 4220⚡️
↠↠ Stop Loss 4226
BUY XAUUSD PRICE 4168 - 4170⚡️
↠↠ Stop Loss 4164

Gold Bulls Are Making Hard Work of New HighsI remain sceptical of gold’s latest bounce and continue to look for signs of a swing high. A less-dovish — or relatively hawkish — Fed cut this week could be the catalyst for a stronger US dollar and lower gold. Either way, it’s hard to imagine gold breaking back above its record high without a meaningful dip first.
Matt Simpson, Market Analyst at City Index.

XAUUSD 4H MA50 break signals lower prices.Gold (XAUUSD) has been trading within a Channel Up in the past 1.5 month. Within this pattern, every time the 4H MA50 (blue trend-line) broke downwards, the price tested the Higher Lows trend-line.
As a result, we expect Gold to reach 4115 next, which will be an interesting cluster as marginally below will be the Support Zone o the 4H MA200 (orange trend-line) and more importantly the 1D MA50 (red trend-line). That will most likely decide the long-term trend.
---
** Please LIKE 👍, FOLLOW ✅, SHARE 🙌 and COMMENT ✍ if you enjoy this idea! Also share your ideas and charts in the comments section below! This is best way to keep it relevant, support us, keep the content here free and allow the idea to reach as many people as possible. **
---
💸💸💸💸💸💸
👇 👇 👇 👇 👇 👇

GOLD ANALYSIS 12/08/20251. Fundamental Analysis:
a) Economy:
- USD:
• The USD continues to weaken due to more dovish comments from the Fed and growing expectations of early rate cuts in 2026.
• U.S. Treasury yields are falling, putting additional pressure on the USD and supporting gold.
- U.S. Stock Market:
• U.S. equities saw a slight correction after a strong rally, mainly due to end-week profit-taking.
• However, the overall trend remains risk-on, preventing gold from breaking out but also limiting the downside.
- Federal Reserve:
• Expectations of 2–3 rate cuts in 2026 are increasing.
• Recent weaker labor data → strengthens the view that the Fed will shift toward easing, supporting gold in the mid-term.
- Trump Administration:
• The Trump administration prioritizes tax cuts and growth stimulus → could temporarily strengthen the USD → short-term negative for gold but positive in the long-term.
• At the same time, unpredictable policies increase geopolitical risks → benefiting gold.
- Gold ETF – SPDR:
• On December 5, SPDR sold 0.33 tons as a test; the probability of continued selling is high → watch out for unexpected drops.
• This is a very important bearish factor, especially while the market is waiting for major news.
b) Politics:
• Tensions in the Middle East continue to escalate step by step → providing support for gold.
• Russia–NATO tensions persist; Ukraine is preparing for winter warfare → adding safe-haven demand.
c) Market Sentiment:
• Slightly risk-on sentiment dominates, but defensive gold buying remains steady.
• Capital is waiting for attractive price zones to buy, after the drop and technical rebound on December 5.
2. Technical Analysis:
- On the 15m timeframe:
• Price is retesting the ascending trendline support + demand zone at 4193.
• RSI is oversold and forming mild bullish divergence, signaling weakening selling pressure.
• Structural expectation: gold may dip one last time before bouncing strongly, fitting a retest-trend pattern.
- Main scenario:
→ Form a bottom around 4193 → move sideways → break 4219 → rise toward 4239–4263 in the next session.
Early buy setups expected tomorrow morning, December 8.
RESISTANCE: 4,219 – 4,239 – 4,263
SUPPORT: 4,193 – 4,174 – 4,163
3. Market Review (Dec 5, 2025):
• Gold dropped sharply by 70 dollars and remained flat at the bottom — something not seen recently.
• RSI oversold but no confirmed reversal signal yet.
• This could be the final move of the downtrend, preparing for accumulation and an upward cycle.
4. Strategy for Today (Dec 8, 2025):
🪙 SELL XAUUSD | 4234 – 4232
SL: 4238
TP1: 4226
TP2: 4220
🪙 BUY XAUUSD | 4168 – 4170
SL: 4164
TP1: 4176
TP2: 4182

GOLD ANALYSIS 12/05/20251. Fundamental Analysis
a) Economy
• USD:
The USD is weakening as the market expects the Fed to maintain its dovish, rate-cut stance in December.
• U.S. Stocks:
U.S. equities are rising on expectations of rate cuts in late 2025, but the rally lacks sustainability due to weak liquidity.
U.S. bond yields are slightly declining → easing pressure on gold.
This creates a mild risk-on environment, but not enough to push gold down strongly.
• Fed:
The Fed remains dovish, with a high probability of rate cuts in Q1/2026 → supportive for gold.
Recent Fed members’ comments lean toward “monitoring but not tightening,” further reducing pressure on precious metals.
• Trump Administration:
The Trump administration is focusing on domestic production support and corporate tax cuts.
However, tensions stirred by Trump in Venezuela and the Middle East provide geopolitical risk that supports gold.
• Gold ETF (SPDR):
SPDR bought an additional 4 tons yesterday → highest reserves in the past 2 months.
This is a strong bullish signal, indicating large capital inflows returning to the gold market.
b) Politics
The Middle East remains tense.
Venezuela – U.S. – China are experiencing conflicting strategic interests.
Escalating tensions push the market toward safe-haven assets → supportive for gold.
c) Market Sentiment
Mild risk-off: defensive flows are increasing, especially as USD weakens and SPDR buys more gold.
Investors are waiting for tomorrow’s Nonfarm Payroll data → gold likely to remain in a tight sideways range like recent sessions.
2. Technical Analysis
• Overall trend:
Gold is compressing within a short-term triangular consolidation pattern.
Short-term MAs are converging → market preparing for a strong breakout.
• Scenarios:
Scenario 1 – Bullish (Primary expectation):
Break above 4239 → 4263
→ Target: 4320
→ If 4320 breaks → price may reach a new all-time high.
Scenario 2 – Bearish deeper correction:
If price breaks 4174 → it may drop to 4120, aligning with the long-term rising trendline.
Scenario 3 – Sideways (likely before Nonfarm):
Price continues moving within the consolidation triangle
→ corresponds to weak liquidity this week.
RESISTANCE: 4239 – 4263 – 4320
SUPPORT: 4174 – 4163 – 4120
3. Yesterday’s Market (Dec 4, 2025)
Gold dipped slightly then rebounded thanks to ETF buying and a weaker USD.
Narrow trading range → consistent with a “waiting for major news” environment.
No strong selling pressure, suggesting buyers are still in control.
4. Trading Strategy Today (Dec 5, 2025)
🪙 SELL XAUUSD | 4264 – 4262
SL: 4268
TP1: 4256
TP2: 4250
🪙 BUY XAUUSD | 4182 – 4184
SL: 4178
TP1: 4190
TP2: 4196

GOLD ANALYSIS 12/04/20251. Fundamental Analysis:
a) Economy:
• USD:
The USD is recovering slightly after a strong decline earlier this week, mainly due to profit-taking flows from gold and bonds. However, the overall trend of the USD remains weak because the market believes the Fed will keep interest rates low and maintain the rate-cutting cycle to support economic growth.
• U.S. Stock Market:
U.S. equities are rising modestly thanks to expectations of a rebound in Q4 corporate earnings and capital rotating back into the tech sector. This reduces safe-haven demand, but the bullish momentum is not strong enough to exert significant downward pressure on gold.
• FED:
The Fed continues to signal a dovish stance, prioritizing economic stability over inflation control. The market is pricing in the possibility of two rate cuts in 2026, providing strong support for gold.
• TRUMP:
The Trump administration is pushing aggressive stimulus packages and trade-protection policies. Uncertainty surrounding tax strategies and pressure on China–Mexico is creating a mild risk-off sentiment, supporting gold.
• Gold ETF (SPDR):
SPDR continued to sell 1.71 tons yesterday → a slightly negative signal, indicating institutional outflows from gold as prices approached all-time highs → mildly bearish for gold.
b) Geopolitics:
• Ongoing instability in the Middle East and Venezuela, with small conflicts occurring frequently.
• U.S.–China tensions persist over technology and trade.
These factors maintain a cautious market tone and form a supportive foundation for gold to rebound.
c) Market Sentiment:
The market is in a mildly risk-on state, but not stable. Funds still move into gold as a defensive asset whenever the USD or equities show signs of profit-taking.
→ Gold continues to trade within a range, but with a bullish bias.
Asian markets are entering the year-end physical-gold buying season → supportive for gold.
2. Technical Analysis:
Trend:
• Price is holding above the rising trendline.
• MA20 – MA50 are about to cross upward → signal of short-term recovery.
• RSI is rebounding from the 30 zone → selling pressure has weakened.
Pattern:
• The U.S. session bottom has formed → price is retesting the trendline and building a new bullish structure.
• Scenario: a pullback to the trendline followed by a bounce.
RESISTANCE: 4,229 – 4,241 – 4,264
SUPPORT: 4,206 – 4,194 – 4,186
3. Yesterday’s Market (03/12/25):
• Gold moved sideways gently within a 45-dollar range.
→ The bearish structure was rejected and left a long wick → a signal that buyers have returned.
4. Trading Strategy for Today (4/12/25):
🪙 SELL XAUUSD | 4232 – 4230
SL: 4236
TP1: 4224
TP2: 4218
🪙 BUY XAUUSD | 4171 – 4173
SL: 4167
TP1: 4179
TP2: 4185
