GXC and GDX beaten downThese two ETFs are of some interest as they have been beaten down rather hard of late. More downside risk prevail, but just markign out the potential buy zones to look out for over the next few weeks.
Let us see how this pans out...
GDX

GDX breakdownWhen Gold and equities are not doing well, and the USD is spiking, little is left for the Gold Miners to rally on.
Looks like it is going to take out the last low...
HODL!

Silver analysis Elliot wave count short term Traders,
I expect prices to push lower below $22 in the next few days. We are currently working wave 4 (Triangle pattern) I will enter short once price breaks below BD line, I expect some volatility on silver and Gold as well
Please like and share your analysis
good luck

Vox Royalty Q2 ResultsTORONTO, CANADA – August 16, 2021 – Vox Royalty Corp. (TSXV: VOX) (OTCQX: VOXCF) (“Vox” or the “Company”) is pleased to announce its operating and financial results for the second quarter ended June 30, 2021. All amounts are in U.S. dollars unless otherwise indicated.
Kyle Floyd, Chief Executive Officer stated: “The second quarter of 2021 saw record royalty revenues, record net incomes and unprecedented organic growth for Vox. Management’s confidence in the underlying performance of the Vox royalty portfolio was demonstrated in our doubling of 2021 annual revenue guidance to C$4M – C$5M. This quarter saw exceptional organic growth in our portfolio, further strengthened by first gold pour from our Segilola royalty asset on July 30. We are also excited to grow our strategic partnership with Electric Royalties Ltd. (TSXV: ELEC), following the completion of our initial graphite royalty transaction. Vox shareholders can look forward to a catalyst-rich second half of 2021, with construction activity at multiple royalty assets, the release of multiple engineering studies and over 80,000m partner-funded drilling expected."
Second Quarter 2021 Highlights
• Record revenue of $1,314,030 reported for the quarter, with inaugural revenues received from the Janet Ivy royalty;
• Record net income of $2,057,694 for the quarter;
• Increased production stage royalty asset count from one asset at May 2020 listing to five assets by end of the quarter;
• Strong balance sheet position at period end, including cash on hand of $5,308,977, working capital of $8,684,985 and total assets of $30,161,290;
• Executed binding documents for a strategic partnership with Electric Royalties Limited (TSX-V: ELEC) and divested two non-core graphite royalties;
• Completed four royalty transactions to acquire an additional seven royalties, including the rancher royalty at Gold Standard Ventures (TSX-V: GSV) South Railroad project, reaching a total critical mass of over 50 royalties and streams;
• Subsequent to June 30, 2021:
o Announced record revenue in Q2 2021 and increased 2021 revenue guidance by +100% on July 27, 2021;
o Increased producing royalty count to 5 assets following first gold pour at the Segilola Gold Mine, as reported by Thor Explorations Ltd on July 30, 2021; and
o Commenced trading on OTCQX on August 10, 2021

STRIKEPOINT GOLD INC. Swing Trade PositionSUMMARY
Technical Analysis: I am long the stock because I see price action has completed a corrective ABC pattern on the daily Chart. From here price action could develop a bullish counter trend.
Fundamentals: The company has commenced drilling at their High-grade Willoughby property. The Company is cashed up and IF! they hit bigly then share price pushes higher.
I do not share in your gains nor in your losses. Do your own due diligence. Trade safe, be well.
Visit their webpage and look through their corporate presentation - www.strikepointgold.com

ALT BEARISH COUNT GDXGDX chart is setup to move to a min of 36 .10 no matter bullish or bearish counts

GOLD BOTTOMED MOVING TO NET LONG 100%I have now moved to a 100% long gold and gdx on open today cycles bottomed and bearish sediment at a level to which has been profitable 93 % of the time so moving to long calls in gdx and gld

GDX Failed attempt to rally - more downside riskExplained in the charts.
GDX is in trouble after a failed rally.
More downside. Caveat Emptor.


GDX H16: SWING: Accumulation / BUY DIPS 35% gains (SL/TP)(NEW)Why get subbed to me on Tradingview?
-TOP author on TradingView
-2000+ ideas published
-15+ years experience in markets
-Professional chart break downs
-Supply/Demand Zones
-TD9 counts / combo review
-Key S/R levels
-No junk on my charts
-Frequent updates
-Covering FX/crypto/US stocks
-before/after analysis
-24/7 uptime so constant updates
🎁Please hit the like button and
🎁Leave a comment to support our team!
GDX H16: SWING: Accumulation / BUY DIPS 35% gains (SL/TP)(NEW)
IMPORTANT NOTE: speculative setup. do your own
due dill. use STOP LOSS. don't overleverage.
🔸 Summary and potential trade setup
::: GDX 16hour/candle chart review
::: TP BULLS is 35% gains soon
::: XANCD setup in progress
::: speculative setup / do your own due dill
::: BUY/HOLD SETUP
::: chart looks strong right now
::: strong bottom confirmed with 3 tests
::: expecting more gains after DIP
::: BULLS should focus on buying DIPS
::: September strong month SILVER / GOLD
::: recommended strategy: BUY DIPS
::: near 33/35 best reload BULLS
::: TP BULLS is 35%+ gains
::: if there's a mild dip just buy it
::: BUY/HOLD - swing trade settup
::: SWING trade setup do not expect
::: fast/miracle overnights gains here
::: good luck traders
🔸 Supply/Demand Zones
::: N/A
::: N/A
🔸 Other noteworthy technicals/fundies
::: TD9 /Combo update: N/A
::: Sentiment short-term: pullback/DIPS
::: Sentiment outlook mid-term: BULLS/REVERSAL
RISK DISCLAIMER:
Trading Crypto, Futures , Forex, CFDs and Stocks involves a risk of loss.
Please consider carefully if such trading is appropriate for you.
Past performance is not indicative of future results.
Always limit your leverage and use tight stop loss.

Buyers are stepping in on first Gold pour for Thor and VoxFirst gold pours at the Segilola Gold Mine in West Africa by Thor Exploration.
July 30th operators completed the first gold pour. Thor is transitioning into the operating phase of the project, which means they are moving towards full-scale steady state commercial productions in September.
They are targeting 80-85,000 oz per annum, which will equate to around 45k/oz by the end of this year, and then they are looking to ramp up towards 100k/oz next year.
This royalty means good news for Vox as they receive cash flow into the portfolio alongside the other 3 production stage royalties.
The revenue generated from this mine for Vox should be 5x the initial investment over the next 3 years which was C$900k. The potential C$4.5 from Segilola has given Vox confidence to up their revenue forecasts for this year towards
C$5 million revenues which is double their previous announcement at the end of Q1. There will obviously be a lot more news coming in the next 3 years so it will be interesting to see how the other production stage assets fair and which new ones up the revenues and by how much.
Vox Royalty is protected from the challenges that occur taking a mine into production as they have no exposure to CapEx. That is not to say the mine should it fail to find the necessary materials, machinery and other COVID related disruptions, would not hinder the revenues being projected. The good news is the mine's operators are doing a sterling job so far and have an amazing track record.

Gold to GDX RatioGLD/GDX Ratio predicts bottoming pattern in the Gold mining stocks. Should be followed by an upmove soon.

Are we at a bottom for miners?Miners may finally be at or near a medium term bottom. They were up nicely today while gold was down. Also the technical are good. They are at the primary trendline, and there is a bullish RSI divergence. There is major support around 31, but not sure it will get down there.

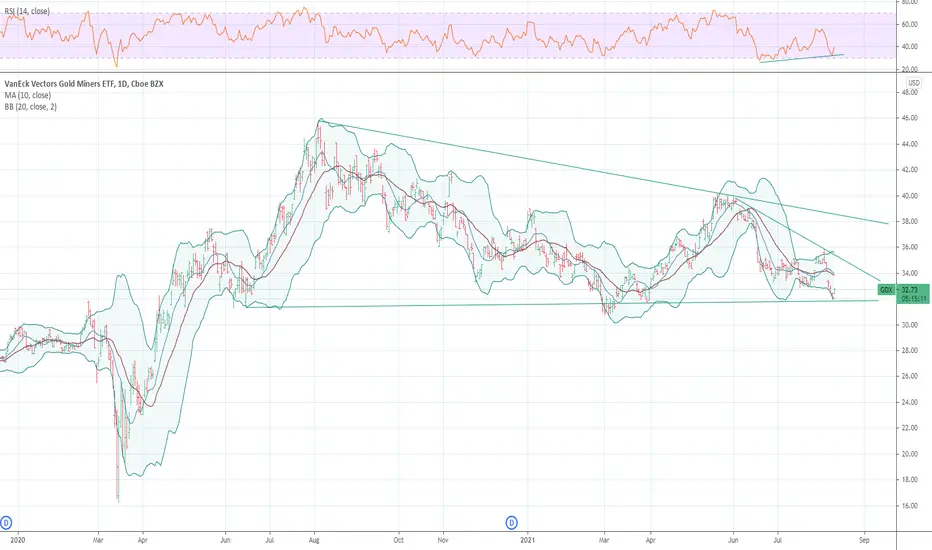
GDX - the beginning of the endThe GDX Gold Miners is one of my personal favourite, and I have had been following it closely over the last couple of years. Since August 2020, where 95% of position was cleared, there was hardly any sustainable long term rally, albeit the March to June 2021 rally that I actually missed. Since then, it pulled back, and is about to revisit the last major lows. This is the beginning of the end... as in, the bearishness is ending. Now, this could take months to pan out and perhaps about 5% downside risk to go.
The daily chart had prices at a lower range having gapped down early in the week. Unlike equities, the recovery was mild, if at all, with Friday gapping down instead. In the form of a megaphone, the range is now going to widen, but am expecting more downside to the target of about 31.50-32.00.
Technicals support the weakness, albeit not extremely weak... just not strong. Looking for a higher low, with MACD bullish divergence in the month to come. Would not be surprised if it breaks down of the megaphone and then breaks back in again to be super bullish.
Until then... I am sitting on my hands.

GDX gold miner ETF7.18.21 GDX : This market can be a tradable market. You can look at the daily and weekly charts and see this. There is a more important reason to talk about this market. There are things a trader can do that can actually sabotage the ability to be profitable because the trader is so risk adverse, that trader will add indicators and filters that result in avoidance of taking trades because of an overwhelming fear of losing trades. This decision could even be conscious or unconscious, and even unintentional, but the end result will create a lot more work, and fewer trades as well as losing trades. The impact of taking trades that have a high probability of be stopped out and not producing acceptable targets can result in strategies that will slow down the trading, but they never really address a meaningful understanding of market dynamics that actually help you find a good trade with a reasonable stop and a decent target. If you really fear the market, you will find ways to slow down your trading. The problem is that this will not help you find a high Quality trade. I believe that certain strategies show that the trader is trying to avoid losing trades, and stress, but may also indicate that he may not have an effective awareness of price dynamics, or structure, and other factors that would be helpful in finding quality trades. However, you can certainly work hard, and have good intentions, but never really figure out how to find the trades that are more reliable, and therefore give you more confidence because they will find your trade location, and result in a decent target in a manner that will give you a higher probability for success. It is important to avoid losing trades, and it is important in finding trades that give you a good profit for the risk you are taking. Choosing bad tools can ruin you as a trader.

GDXpossible trend change here if this can be confirmed as higher low.
wouldnt touch options yet (unless ATM leaps w SL), but commons look good here.
time and patience needed in miners.

$1800 for Gold could be major support$1800 for the gold bugs seems to be a Goldilocks number. Recent support has been tested several times but a break out from the recent downtrend at first looked like a false breakout. If we were to take that swing high on this latest bullish move, the consensus target of $2000 should be easily met, even $2100 is doable.
For the likes of a royalty company the fluctuations in the metals is less relevant but a higher precious metal market does bring outside interest back into these assets, so the likes of Vox Royalty will be benefiting from the current appreciation in the yellow metal. They both have shown a swing low buy the dip from mid-June, so some correlation currently on show.


GDXJ Arc indicates low risk entry with 250% upside The fun side of the arc in the junior miners is currently playing out. At the moment, we reside at the edge of the arc, which presents a very low risk high reward entry. Completion of the arc would indicate a gain of around 250% + overshoot, in an 18 months timeframe.

GOLD Pullback Resume Off?Gold saw a sharp sell-off last week due to comments made by Powell of interest hikes that may come sooner than expected. Since early June, gold is now down almost 8% in just this month. Nevertheless, price is holding some key technical levels. I still remain bullish on gold given the current environment of high inflation. The key levels to look out for are 1750 and 1675.

GDX Gold Miners Hard DropHave not been posting nor updating publicly... but private circle saw the recent run up, and my suspicion that it would not hold. Circles were target points that were "surprisingly" met. (I dont know how to post the snapshots here, but anyways...)
Then this last week saw that GDX cut right through a target level earlier than expected.
A new support target is set, but I still suspect that there is more to come.
Gap Downs are hard, and on very high volume.
This down move is exacerbated with a spiking USD, falling Gold prices and Equities at risk.
Not yet ripe. Wait for it.

Gold - Rising Wedge Short (S3)Trade for Gold (S3):
- Rising Wedge Breakdown with Exhaustion Gap and Re-Test of Wedge.
- Fell into descending ML Channel with confirmation.
- 2N Frequency SL yields:
2150+ Ticks PT
3.4 R/R
GLHF
- DPT
