GDX - support zone3/1/20. GDX 4 hour charts
I issued a warning on 2/23/20 of Risk v Reward. At the Friday low, GDX was down a bit more than 20% and NUGT was down a bit more than 50%. I FEEL for all those people who jumped in at the last leg and getting burned but that's how it usually out. Identifying Risk vs Reward and Resistance zone vs Support zone is important.
GDX

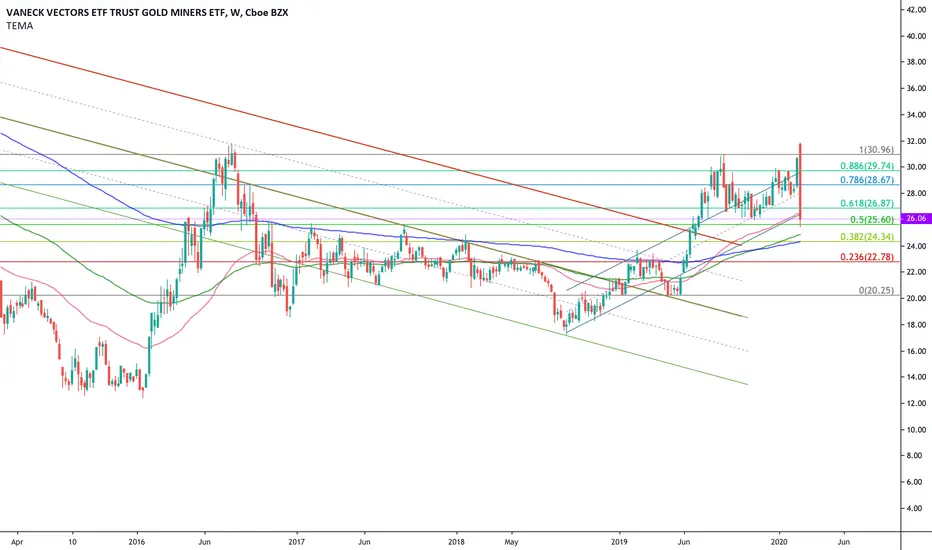
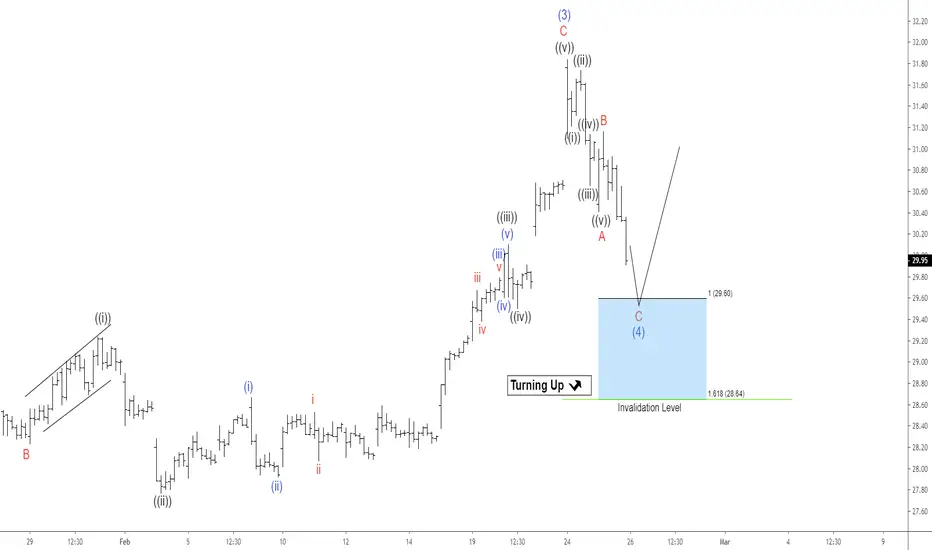
Elliott Wave View : GDX Looking to Extend HigherShort term Elliott wave view in GDX ETF suggests the rally from January 14, 2020 low in wave (3) has ended at 31.98 high. The cycle unfolded as a 5 waves impulse Elliott Wave structure. Up from January 14 low, wave ((i)) ended at 28.67 and pullback in wave ((ii)) ended at 27.92. The ETF resumed higher in wave ((iii)) which ended at 30.10. After that, wave ((iv)) pullback ended at 29.50 and the final leg wave ((v)) of C ended at 31.98.
Currently, the ETF is correcting that cycle in wave (4). The correction is unfolding as a zig-zag. Wave A of (4) has ended at 30.41 and subdivides in lesser degree 5 waves. Wave ((i)) of A ended at 31.10 and wave ((ii)) ended at 31.74. The ETF then continued lower in wave ((iii)), which ended at 30.66. Then, the bounce in wave ((iv)) ended at 31.14. The push lower in wave ((v)) ended at 30.41. From there, the ETF then bounced in wave B, which ended at 31.16. Potential area to end wave C of (4)) is 100% – 161.8% Fibonacci extension from February 24 high which comes at 28.64 – 29.60 area. From this area, GDX can then extend higher or at least bounce in 3 waves.
Two target price ranges in $NUGT based on $GDX resistance levelsOverhead resistance for GDX is to be found at $35.50 and $39
Assuming that GDX reaches these levels over the next 2 to 4 weeks $NUGT could reach $53.50 and $64.80 respectively.
GDX will open above $31 to $31.79 resistance which puts $NUGT at $42.0 to $42.70
Daily RSI will indicate a hold long.

THE WEEK AHEAD: SQ EARNINGS; SMH, XOP, GDX, GDXJEARNINGS:
SQ (77/59) announces Wednesday after market close and has the volatility metrics I'm looking for out an earnings-related volatility contraction play -- implied in the 70th percentile or greater over the past 52-weeks and 30-day at or greater than 50%.
Pictured here is an SQ April 17th 72.5/100 short strangle camped out around the 20 delta paying 3.55 on a buying power effect of 8.37 (42.4%) and delta/theta metrics of .66/7.78. For those high on defined, consider the 65/70/95/100, paying 1.58 (46.2% credit received as a function of buying power effect).
EXCHANGE-TRADED FUNDS ORDERED BY RANK/30-DAY IMPLIED AND SHOWING THE EXPIRY IN WHICH THE AT-THE-MONEY SHORT STRADDLE IS PAYING >10% OF STOCK PRICE:
SMH (73/30), May
XLE (63/23), July
USO (51/37), April
XBI (48/30), June
XOP (45/37), May
FXI (40/23), August
GDX (40/29), May
GDXJ (38/33), May
EWZ (26/27), June
I didn't get an opportunity to do a ton last week beyond take off a few setups in profit, so this is probably an opportunity to build up theta pile in stuff that I don't have plays in currently and to add to stuff via delta under hedge that has experienced an up tick in volatility over the past several days.
BROAD-MARKET ORDERED BY RANK/30-DAY IMPLIED AND SHOWING THE EXPIRY IN WHICH THE AT-THE-MONEY SHORT STRADDLE IS PAYING >10% OF STOCK PRICE:
QQQ (59/23), September
SPY (43/17), November
IWM (42/19), September
EEM (37/19), September
In spite of the expansion of volatility over the last several days, broad market isn't paying fabulously in shorter duration, so if you're going to play, look to start out small, add small over time, and take profit somewhat aggressively.
FUTURES:
/GC (70/15)
/CL (51/36)
/NG (47/39)
/ZS (43/19)
/ES (42/17)
/SI (33/89)
/ZW (24/24)
/ZC (23/13)
VIX/VIX DERIVATIVES:
VIX finished the week at 17.08 with the March, April, and May /VX futures contracts trading at 17.05, 17.33, and 17.09 respectively. It's tough to divine what /VX futures traders' thought processes are here, but it looks like they may be focused on the exogenous event of the year -- the expiry around the general elections, where there is a huge term structure "hump" from September (currently trading at 17.75) to October (20.55), with the remainder of the preceding structure being fairly flat in the interim. There is a mere .70 differential between the March contract price and the September one which I regard as unusually flat, which doesn't make for good term structure trades. Naturally, at some point, the term structure may adjust to a more "standard look," but in the mean time, look to add short to VIX derivatives (VXX, UVXY) on pops to VIX > 20% via short call vertical or long put vertical with a break even at or above where the underlying is currently trading and shooting for one-third the width in credit (if a credit spread; don't pay more than 2/3rds the width if a debit spread).

Gold Miners in a dual pattern breakout - Rally Alert!Just building up, the GDX Gold Miners, which were lagging Gold prices for a while, is now on the verge of a breakout... from a tilted Cup & Handle Pattern, as well as a Triangle.
MACD and OBV are bullishly supportive, and momentum is strong.
A breakout sets an upside target of 32.50.
Enjoy the ride!

Gold miners - laggards in a rallyGold is rallying very hard, and the GDX Gold miners ETF is lagging behind. It is only a matter of time before it catches up, and is already beginning that catch up journey. This morning, it is up 1.5% and launching off, after a higher low bounce off a support region (grey box). Technicals are supportive, as is correlation to Gold prices. The MACD crossed up after consolidation. By next week, it should be breaking out over the trendline, and upside is >15% to target.

#gold consolidates in $1630s miners lag min 10% $GDX $NUGT $DUSTIt is uncharacteristic for the miners to lag in this way, usually, it goes the other way around.
The explanation is simply that the S&P is near all-time highs and has signaled repeatedly to short the gold mining companies and ETFs.
GDX resistance in the $31 region is not likely to hold this time. Gold miners are seeing all-time record profits due to gold reaching new all-time highs in every currency but the US dollar ( XAUUSD ) and Swiss Franc ( XAUCHF .) Most mining costs are incurred in other currencies where gold has been hitting all-time highs repeatedly for many months.
Shorting of the miners are will be bad for business as these levels are pierced.

Gold Rally UnderwayIf you look at the previous gold rally from 2001 to 2011 you'll see a similar pattern of the 50DMA crossing below the 100DMA and then a few days/weeks later rising above it again and rallying to new highs. I believe this is what we're seeing right now. Gold is going to touch $1700 in the next rally, or get VERY close before correcting. Let's see how it plays out...

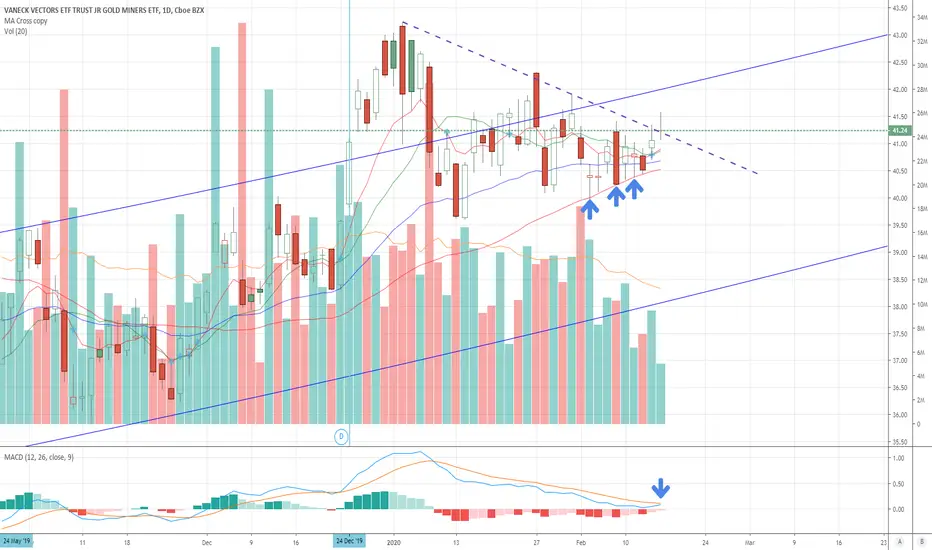
GDXJ long ideaTo me I am finally getting a buy signal on miners. GDXJ has been supported by the 50 sma and is getting a move higher. The upper trend line was crossed, BUT we didn't close above it yet. I do see a cross of the 8sma and 13ema which is a buy signal. I had a buy signal on AXU yesterday. Pretty close to lift off.
Royal Gold - another miner to buy at supportNASDAQ:RGLD is one of the leading stocks in gold mining industry. It started major rally earlier than majority of other miners last spring. And was one of the first stocks to caution that pullback is likely in AMEX:GDX in January 2020.
Right now it sits right near major support level, and in bullish scenario this is constructive level from which new leg higher should start.

Gold coiling for move higher#Gold still looks strong to me. Price remains in early stages of 5th wave higher. Rising channel from the Aug '18 low remains in tact. Key levels I'm watching are 1540 to downside, which would test rising support & 1590 to upside. Break should kickstart next leg higher $GLD $GDX

GOLD - Daily chart forming a symmetrical triangle. GOLD - Daily chart forming a symmetrical triangle. In itself is 50/50 neutral regarding breakout direction. However, in the context of a secular bull market, likely to be a upward breakout, as the prior wedges, flags, triangles prior..

Gold daily in AUD- Rising wedge.According to Bulkowski- 60% probability of downward breakout, 40% of upward breakout.
As for downward breakout for a falling wedge, one of the worst performers, with 72% probability prices will retest breakout point (throwback).
As for upward breakouts for falling wedges, far more likely to be fruitful with far better performance, according to Bulkowski.

GDX to 24Maybe lower, but the gap is the target. If it closes back over the trendline it's a long for sure!
good luck

GDX - Looking to buy at $23Hello, I won't make comments for this chart I will link GDXJ that I did, assumptions are the same/similar

The GDX is about to break out!The GDX ETF is about to break out. Initial target is the high 40 as this is the next resistance level. This also coincides with the 50% fibonacci retracement level. I would expect some consolidation following this target being met, eventually heading higher.

IAMGOLD -time for a bottom?Miners have potential to be one of top players this year, and today I am looking at chart of NYSE:IAG . Stock reached perfect targets within wave 2 corrrection based on fibo levels, and price also created bullish engulfing candle yesterday . At the same time, price may also be forming bottom within right shoulder in inverted H&S. Looks promising for low risk entry buy

OPENING: GDX MAY 15TH 26/33 SHORT STRANGLE... for a 1.01 credit.
Notes: Re-upping a gold miners play in the first expiry in which the at-the-money short straddle pays greater than 10% of the value of the underlying.

Gold Breaks out of Cup and Handle#Gold gap up above horizontal resistance, nice cup and handle formation. Well defined RR on an entry here, can set a tight stop just below the gap. $GC_F $GLD $GDX $GDXJ

GDX – Turned Bullish on Daily - $32 Price TargetChart Details
Price on Daily keeping yellow support. Best entry would be close to yellow support (on pullback).
Bullish price action – higher highs and higher lows daily.
Gaps to fill up to $37.
Conservative price target of $32 to fill first gap.
RSI channel is our guide to enter or exit until channel guides are violated.
Opinion
I had three hedges for market downturn in play, instead of taking specific bearish plays on SPY for example.
GDX, SCO, and SPXS have all been good hedges when purchased at correct time (market ATH's with weekly RSI over 80-85)
With coronavirus, oil conflicts, Iran, market overpriced, negative interest....yada yada...there are a number of bubbles or events ready to pop.
About Me
www.moneypatterns.com
Options Strategies, Video Technical Analysis, Instant Alerts, Specific Options Order Entry Details, Daily Updates, Equities & Crypto, Weekly Breakdowns, Charting Service, & More in Members Area!
Thank you for liking, commenting, throwing up a chart, following, or viewing.
I am not a financial advisor. My comments and reviews are based on what I do with my personal accounts and on www.moneypatterns.com

QQQ: day trade review & next week plantoday's trade is not good, but still can make money. Next week, will do QQQ PUT and IWM CALL.
QQQ
XOP
GDX

THE WEEK AHEAD: NFLX EARNINGS; XME, GDXJ/GDX, XBI; VIXEARNINGS:
NFLX (46/41) (Tuesday After Market Close).
The metrics aren't ideal here, with the rank below 70%, the 30-day below 50% and the at-the-money short straddle paying less than 10% of the value of the underlying in the February cycle, but this is the best of the bunch announcing next week in terms of both liquidity and implied volatility.
Pictured here is a February cycle 305/385 delta neutral short strangle paying 7.00 with delta/theta metrics of .84/27.72. Alternatively, go defined risk, shooting to collect one-third the width of the wings with a 305/310/380/385 iron condor paying 1.88 with delta/theta of .70/3.48.
I will consider going out farther In time to March to get paid, but the trade-off is that any volatility crush gets muted if you do that. That being said, you do get wider break evens for a similarly delta'd short strangle, so get more room to be wrong. For instance, the similarly delta'd March setup is the 295/395 paying 8.13 at the mid price with delta/theta metrics of -.91/18.54, with break evens of 286.87/403.13 versus the shorter duration's 298/392.
EXCHANGE-TRADED FUNDS:
... ordered by rank and showing the month in which the at-the-money short straddle pays greater than 10% of the value of the underlying. I've culled out funds that aren't paying that in 180 days' duration or less, since no one likes to wait that long for their candy.
XME (30/21), June
GDXJ (17/28), May
XBI (12/24), June
GDX (11/25), April
USO (11/29), April
XLE (6/16), July
SMH (4/21), May
EWZ (3/24), June
XOP (2/28), April*
I've already got GDX, EWZ, XBI, and XOP on, so may look at getting into some XME, even though there is some overlap with miner holdings, and/or redipping my stick into some SMH, since that pays in a shorter duration.
BROAD MARKET:
Nothing is paying in <180 day duration .... .
FUTURES (EXCLUDING TREASURIES AND CURRENCIES):
/NG (39/42)
/GC (29/11)
/ZC (29/24)
/SI (28/18)
/CL (23/28)
/ES (10/12)
/ZW (8/23)
Natty is juiced with last week's sell-off, with some understandable trade-related friskiness in the ag complex. Oil's still paying, but only in durations of April or longer.
VIX/VIX DERIVATIVES:
VIX finished the week levitating a dime above the 12 handle with only the April, May, and June /VX contracts paying greater than 16 (16.05, 16.33, and 16.75, respectively). My general preference for term structure trades is to short only in expiries where the correspondent /VX future is trading above 16 and ordinarily in <90 day duration (e.g., the VIX April 15th 16/18, 87 days 'til expiry, .55 at the mid price with a break even of 16.55 versus the the /VX April contract of 16.05), so would probably only pull the trigger on an April setup.
For UVXY and VXX, my short volatility go-to's, I'm patiently waiting for a pop to add and/or to roll what I've got into strength, of which we've had very little. VXX was down 5.67% for the week; UVXY, 8.37%.
* -- There isn't an April expiry as of the writing of this post, but January fell off last week, so one will likely be opened and populate this week.
