Target for $NUGT at different $gold spot prices $GDX $NUGT $JNUGThe ascending triangle in the gold price displayed here:
Has produced the consolidation wedge displayed in the green triangle pattern above in $NUGT.
A return to the recent highs will likely send $NUGT back into the $36 to $38 range.
Gold is, momentarily, no longer inversely correlated with the stock market. Negative real interest rates globally and the inverse correlation with USD is now the primary driving force in the price of gold.
Lower interest rates and (not QE ) QE are repricing the US dollar against major world currencies and gold:
GDX

GDX - Ready to pop with BTC , while SPY fallsGDX, SPY, and VIXY all tell similar story.
Things are topped out. Gold, Bitcoin, and shorting SPY will be the best (if not the only) options for alpha in the upcoming market.
If you are long SPY or any equities, be careful chasing that last 10% because a 20%+ drop is below you.
Long - GDX, MARA, VIXY, BTCUSD, GBTC.

#Gold Volatility Signalling Further Declines?This is an excerpt from the Parallax Report, originally published the week of October 15. For more information, please visit @themacrostrat.
"Unlike the usual relationship between volatility and equities, gold and gold volatility trade in tandem; and gold volatility (GVX) continues to grind lower since gold failed to gain momentum above $1,550 which is trending neatly within a descending channel.
If we breakdown gold volatility further, when the standard deviation spikes above 1 with the 30-day ROC trending lower, we see lower gold prices. The ROC is maintaining negative territory while the volatility sigma continues to slide lower."
Nar-term TACVOL range is 1520/1474.

GDX - Long Opportunity with low risk- There seems to be some support on 26.16
- Two target prices, if it manage to break 27.33 the next would be 28.44
- A good 3.1RR for this trade

natural dollar cycles$xauusd $xagusd $gdx $dust $nugt $gdxj $jnug $jdst $dxy $silver $gold
I'm looking for the dollar to continue these natural cycles and form a low towards end of 2020 watch for a possible spike before the low. Gold, silver will most likely sell off again and offer another very good opportunity.. perhaps we'll see a huge rally in precious metals through 2020. Buckle up.

JDST long ideaSure looks like a break out to me. Pick up some JDST as gold and miners drop into the next ICL.


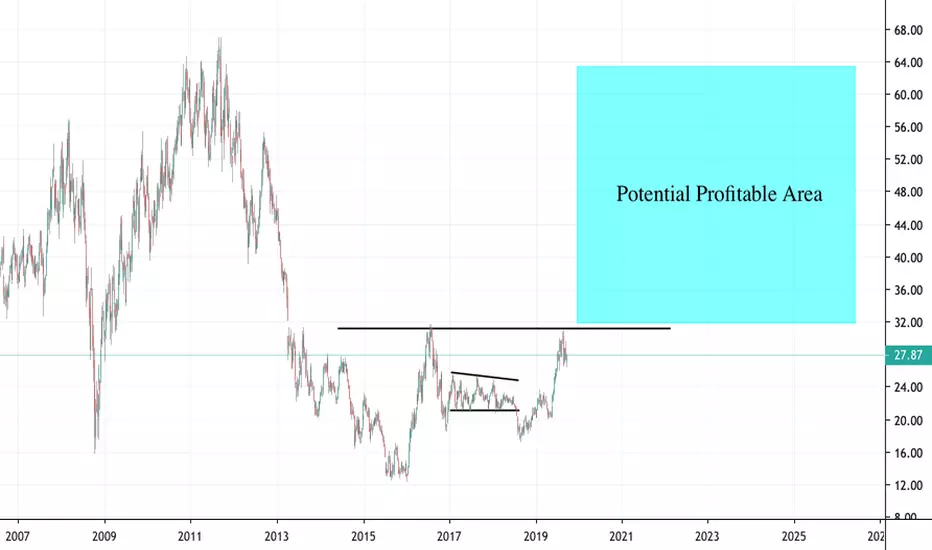
GDX, VanEck Vectors Gold Miners ETF - Potential Risk RewardAMEX:GDX
If the value of gold continues to increase, automatically the companies linked to the extraction of this metal would derive profit from it and therefore we wait for a breakout of this resistance to allocate eventually a part of the portfolio on this ETF.
As we also notice from the point of view of the potential resistances that could be found on the path towards the achievement of profit would be very few, and therefore the Risk Reward is very interesting.
finance.yahoo.com
FCX and the looming recession?pure play copper not exactly best idea for global recession positioning.. but, who knows how this thing is going to go down. Copper is so important, it cant be left behind for long? Maybe it can? But accumulation at least shows some promise.. Should be fun next few months! Please let me know your thoughts.. FCX performance lately is scary. Big money know some details the little guys arent privy to just yet?


#GOLD where is Support? Preparing to Buy the Dip! #XAUUSD$GOLD #GOLD Will it touch Lower Support? Preparing to Buy the Dip.
The price of Gold is Trading since a Month in a big range between 1480 and 1550 and looking at the H12 Chart it seems that we are close to make a move out of it and retest lower support levels which are coming in at the vicinity of 1450.
H12 Stochastic is still pointing down heading into bearish Control zone.
H12 RSI has decreased the middle of the Range while Price stayed quite stable in a narrow range.
As Gold has been a winner over the past months the trend is still not broken to the upside.
So we stay with the Trend and Manage our risk in this direction.
If we break 1480 to the downside we will probably bounce of first support 1460-1440 giving you a good opportunity to “buy the dip” at least for a short-period trade.
The probability of Gold falling through support is highly unlikely so I give it more chance to bounce of Supports.
Especially Looking at the H12 RSI it will give us some insight into Market strength. If it Reaches the 0.786 Fib Level while price touching support you might want to take into consideration to make this trade.
First and little Support 1460-1440 (0.236 Fib)
Next Support (major) 1400-1370 (0.382 - 0.5 Fib)
Have your stops in place and trade Safe!
===========================
You can copy and follow my Trades on eToro
www.etoro.com
===========================
$GLD $GDX $GDXJ #GLD #GDX #GDXJ $NEM $GOLD. $HOC.L $2899.KH $BOL.ST $XAUUSD #XAUUSD #XAU #TRADINGGOLD #GOLDPRICE #TECHNICALANALYSIS

GOLD update for week ending 27 September 2019Weekly Data Summary Suggests:
Current Weekly Trend is Bullish
The anticipated upcoming trade range is between 1467.74 - 1525.82
If GOLD is capable of maintaining the current strength as of today, there is a projected weekly target price of 1491.52
The prices are moving with the Trending Moving Average at a standard pace with a moderate market
The RSI that monitors bullish strength has a current weekly reading of: Bullish
The RSI that monitors bearish strength has a current weekly reading of: Neutral Bull
The strength demonstrated over the last 5 weeks is currently: Bullish
Price Consolidation has formed between: 1480 - 1557.1
Current chart score suggests a Bullish Market is present.
Daily Data Summary Suggests:
Current Daily Trend is Bearish
The anticipated upcoming trade range is between 1481.85 - 1511.71
If GOLD is capable of maintaining the current strength as of today, there is a projected daily target price of 1481.14
Price movement has returned to the Trending Moving Average this suggests either a stall while averages catch up to the prices or a turn in the prices in the opposite direction
The RSI that monitors bullish strength has a current daily reading of: Neutral Bear
The RSI that monitors bearish strength has a current daily reading of: Neutral Bear
The strength demonstrated over the last 5 days is currently: Bearish
Price Consolidation has formed between: 1472.41 - 1555.33
Current chart score suggests a Bearish Market is present.
Comments:
Mixed sentiment between weekly and daily charts. Daily chart maybe bearish at this moment, however it may be prepared to turn again and continue back up. This is based on the divergence on the indicators between the stronger trend (week) and weaker trend (day).
** If data does not significantly change between trade dates, a daily update may be skipped. Monthly and Weekly updates will always be provided. **

GOLD update for 25 September 2019Daily Data Summary Suggests:
Current Daily Trend is Bearish
The anticipated upcoming trade range is between 1488.48 - 1519.17
If GOLD is capable of maintaining the current strength as of today, there is a projected daily target price of
Price movement has returned to the Trending Moving Average this suggests either a stall while averages catch up to the prices or a turn in the prices in the opposite direction
The RSI that monitors bullish strength has a current daily reading of: Bullish
The RSI that monitors bearish strength has a current daily reading of: Neutral Bull
The strength demonstrated over the last 5 days is currently: Bearish
Price Consolidation has formed between: 1472.41 - 1555.33
Current chart score suggests a Bearish Market is present.
** If data does not significantly change between trade dates, a daily update may be skipped. Monthly and Weekly updates will always be provided. **

GOLD update for 24 September 2019Daily Data Summary Suggests:
Current Daily Trend is Bull
The anticipated upcoming trade range is between 1517.16 - 1546.85
The prices are moving with the Trending Moving Average at a standard pace with a moderate market
The RSI that monitors bullish strength has a current daily reading of: Bullish
The RSI that monitors bearish strength has a current daily reading of: Neutral Bull
The strength demonstrated over the last 5 days is currently: Bullish
Price Consolidation has formed between: 1472.41 - 1555.33
The price relationship to the moving averages currently suggest Long positions.
Current chart score suggests a Bullish Market is present.
** If data does not significantly change between trade dates, a daily update may be skipped. Monthly and Weekly updates will always be provided. **

GOLD Update for 23 September 2019
Daily for 23 September 2019
In Bull territory.
Price Projection:
HMA: Bull
Bull RSI: Bullish
Bear RSI: Neutral Bull
BSI: Bullish
5 RSI: 5 day relative strength appears Bullish
Consolidation: In Consolidation between 1472.41 - 1555.33
Price-Trend: .71x ATR
Comments: Prices have been turning from consolidation low for the past few trade days.
Indicators have been (re)turning to bullish one by one over the last week. Price closing above 8MA is a good bull indicator for possible re-entry.
Staying neutral until last indicator changes.
** Weekly updates will always be provided, if not updated daily, it generally means the underlying primary signals have not changed since last reported. **


GOLD Update for week ending 20 September 2019Week update for week ending 20 September 2019
In Bull territory.
Projected range for upcoming week 1544.92 - 1496.15
Price Projection:
HMA: Bull
Bull RSI: Bullish
Bear RSI: Bullish
BSI: Neutral Bull
5 RSI: 5 day relative strength appears Bullish
Consolidation: In Consolidation between 1480 - 1555.33
Price-Trend: 2.13x ATR
Daily for 20 September 2019
In Bull territory.
Price Projection: 1534.03
HMA: Neutral Bear
Bull RSI: Neutral Bull
Bear RSI: Neutral Bull
BSI: Bullish
5 RSI: 5 day relative strength appears Bullish
Consolidation: In Consolidation between 1472.41 - 1555.33
Price-Trend: .51x ATR
** Weekly updates will always be provided, if not updated daily, it generally means the underlying primary signals have not changed since last reported. **

GOLD Update for 19 September 2019
Daily for 19 September 2019
In Bear territory.
Price Projection: 1435.29
HMA: Bear
Bull RSI: Neutral Bear
Bear RSI: Neutral Bear
BSI: Bearish
5 RSI: Negative
Consolidation: In Consolidation between 1472.41 - 1555.33
Price-Trend: .24x ATR
** Weekly updates will always be provided, if not updated daily, it generally means the underlying primary signals have not changed since last reported. **

GOLD Update for 18 September 2019
Daily for 18 September 2019
In Bear territory.
Price Projection: 1475.54
HMA: Bear
Bull RSI: Neutral Bear
Bear RSI: Neutral Bear
BSI: Bearish
5 RSI: Negative
Consolidation: In Consolidation between 1472.41 - 1555.33
Price-Trend: .50x ATR
Comments: Engulfing negative bar on the 18th. Price target is the lower of the consolidation range.
** Weekly updates will always be provided, if not updated daily, it generally means the underlying primary signals have not changed since last reported. **

GOLD Update for week ending 13 September 2019Week update for week ending 13 September 2019
In Bull territory.
Projected range for upcoming week 1516.35 - 1468.22
Price Projection: 1460.89
HMA: Bull
Bull RSI: Bullish
Bear RSI: Bullish
BSI: Neutral Bull
5 RSI: Positive
Consolidation: In Consolidation between 1480 - 1555.33
Price-Trend: 1.64x ATR
Daily for 13 September 2019
In Bear territory.
Price Projection: 1475.54
HMA: Bear
Bull RSI: Neutral Bear
Bear RSI: Neutral Bear
BSI: Bearish
5 RSI: Negative
Consolidation: In Consolidation between 1472.41 - 1555.33
Price-Trend: .84x ATR
** Weekly updates will always be provided, if not updated daily, it generally means the underlying primary signals have not changed since last reported. **

GOLD Update for 12 September 2019
Daily for 12 September 2019
In Bear territory.
Price Projection: 1475.54
HMA: Strong Bear
Bull RSI: Neutral Bull
Bear RSI: Neutral Bull
BSI: Bullish
5 RSI: Negative
Consolidation: In Consolidation between 1472.41 - 1555.33
Price-Trend: .44x ATR
** Weekly updates will always be provided, if not updated daily, it generally means the underlying primary signals have not changed since last reported. **


GOLD FORECAST SEPTEMBER 11-16: EXPLOSIVE RALLY TO $1600 Expecting an inverted head and shoulders reversal pattern to ignite a chain reaction bullish trend all the way up to an initial target of $1600. See chart for details.
Good time play the miners IMO.
JNUG NUGT AMEX:GDX AMEX:GDXJ AMEX:GLD TVC:GOLD OANDA:XAUUSD OANDA:XAUEUR
Good luck!
