More upside on Gold and Gold ETF While Gold fell yesterday due to interest hike fears and China's economy.
I believe the Gold still has more upside.
Currently, looking at gold miners ETF. Believe that it might fall to support level ($26 area) and bounce back higher.
Aiming for around the $ 30 area..
However, should it break $26, I will exit my trade.
GDX

How high and how low can Gold go in this cycle?In my honest opinion Gold will head much much higher in the next decade, and the double top at 2070 is bound to break. In the short term it also looks fairly bullish as it has reclaimed several key support levels, along with the 200-400 DMAs and the diagonal trendline. Getting up to 1900-1920 over the next few days or weeks definitely seems possible.
However in the medium term it isn't clear whether it is ready to resume higher. To me it looks more likely that Gold will get to 1600 and maybe even 1300 before getting to 3000. The quadruple bottom at 1670 looks vulnerable, as so does the triple bottom at 1450, while the 1300-1350 looks like a massive magnet. The market never retested that breakout and it could certainty revisit it before going higher.
But how could gold go lower if inflation remains high? Well inflation has been high for a while now, and yet Gold is still sitting below its 2011 ATHs. Central bank balance sheets have exploded, and yet gold remains quiet. In my opinion this has to do with several things, that could range from manipulation up to a strong dollar. Central banks are cornered and not many governments are profitable enough to add gold to their balance sheets. Some will potentially be forced to sell in order to support their currencies. As energy and food go higher, bonds yields will go higher, and therefore more opportunities will arise outside of gold. Being long oil is probably a better inflation hedge than being long gold. At the same time higher inflation forces people to sell stuff in order to cover their extra costs, and that includes gold. People bought gold as insurance for a period of high inflation, and now they need to exercise that option. Finally, as bond yields go up, if the dollar also goes up, then this could seriously harm gold. If the USD appreciates too fast along with interest rates going higher, then gold could collapse along with most other assets in the case of a liquidity squeeze.
In conclusion, I don't believe inflation is fully under control, I don't think we are done with QE and low rates by Central banks, however I do think that gold isn't ready for prime time yet. Gold is in a weird spot both fundamentally and technically, so I'd need to see a more bullish price action in order to be convinced that 3000 will come before 1300.

Elliott Wave View: Gold Miners (GDX) Starts a New Bullish CycleShort term Elliott Wave View in Gold Miners ETF (GDX) suggests it has started a new bullish cycle from 10.13.2022 low. The rally from there is unfolding as a 5 waves impulse Elliott Wave structure. Up from there, wave 1 ended at 25.4 and dips in wave 2 ended at 22.58. The ETF extends higher again in wave 3 towards 28.49 as the 45 minutes chart below shows. Internal of wave 3 unfolded as another 5 waves in lesser degree. Up from wave 2, wave ((i)) ended at 27.02 and pullback in wave ((ii)) ended at 26.05.
ETF extended higher in wave ((iii)) towards 28.48, and dips in wave ((iv)) ended at 27.88 as a triangle. The last leg higher wave ((v)) ended at 28.83 which completed wave 3. Pullback in wave 4 ended at 26.76 with subdivision as a zigzag. Down from wave 3, wave ((a)) ended at 27.57 and rally in wave ((b)) ended at 28.09. Wave ((c)) lower ended at 26.76 which completed wave 4. GDX has rallied higher again in wave 5. Up from wave 4, wave ((i)) ended at 28.40 and dips in wave ((ii)) ended at 28. Expect the ETF to extend a few more highs before ending wave 5 of (1). Afterwards, it should pullback in wave (2) to correct cycle from 10.13.2022 low in 3, 7, or 11 swing before the rally resumes.

3M Inverted Chart Is Saying Something? MinersWhat does the 3 month timeframe INVERTED chart tell us about miners?

DXY second attempt to break failed The dollar had another spike above 113.5 and got strongly rejected, this shows weakness and is likely to attempt another leg don’t to 110 support leading a rally next week for #stocks, #commodities and #crypto if the correction happens.
DXY needs ground to rally again, I can’t see breaking resistance until it set another higher low and it still has room to make tray happen. *Key level is 110.3

GDX - Going Down Xtrenuously (pun intended)The gold miners ETF, GDX, just points to a very very rough time.
With the interest rates escalating rapidly, the USD rising swiftly, the equity markets weakening, and gold prices crumbling... it is a perfect storm for GDX thrashing.
The weekly chart had a tombstone doji the previous week as it failed the Hull EHMA, and the past week confirmed the trend reversal down. The weekly technical indicators are weak and bearish looking so not much to go on here.
The daily chart shows a recent breakdown from a failed 55EMA test. and on Friday, ended with a bearish marubozu, closing near the weekly low. The technical indicators are significantly suggestive... the MACD had actually wasted a long bullish divergence and failed to mount a very decent rally. This failure would have a doubling opposing effect, and the daily MACD has actually crossed down into the bear territory.
Taken together, projections set a downside target of 17, about the end of November 2022.
A very tough time for GDX (unless you are short)

GDX: Rise and Shine! ☀️GDX seems to have woken up and is showing its high spirits by climbing upwards. We now consider wave ii in magenta to be finished, and thus expect the ETF to continue its way above the resistance at $28.83. Once there, GDX should gain even more upwards momentum to rise above the next mark at $40.13 as well. We should still keep in mind our alternative scenario, though, as there remains a 40% chance that GDX could lose its steam and drop below the support at $16.18. in that case, we anticipate further descent.


The Gold Odyssey - Gold-ing Down over the next yearsI must attribute this post to my brother who texted me earlier this week asking for my opinion of where Gold is going. I did respond with a "Down" but I felt that I should also validate it properly. And lo and behold, I noticed a major pattern formation, that would break the previous trend/pattern.
Gold appears to be on a VERY CRITICAL LAST DAY of the month.
It needs to close well above 1685 to save it from the pattern break(down). Previously, since 2019, I started this series of The Gold Odyssey documenting Gold's bullish journey, andI think it is about time that Gold changes trend from Bullish to Bearish.
The monthly Gold futures chart is shown here with two very similar pattern breaks. Well, in about 8 hours, we will know if there is a pattern break, and a new bearish pattern truly emerges...
In 2011-2013, a major Gold top formed, and in this formation a couple of characteristics formed:
1. a monthly lower high was formed;
2. a breakdown below the 55 Hull EHMA;
3. a breakdown out of the triangle formation; and
4. MACD cross down into bearish territory
In 2020, Gold made a historical high, and since then, Gold did these few things:
1. a monthly lower high was formed; ✅
2. a breakdown below the 55 Hull EHMA; ✅
3. a breakdown out of the triangle formation; and (candle NOT YET closed, on last few hours now)
4. MACD cross down into bearish territory ✅
The patterns are uncanny and a dead ringer for further downside, projected in a similar fashion to 1275 around later 2024.
Conceptually, longer term patterns are more difficult to form (or break).
Notwithstanding, the Gold monthly chart appears to be suggesting that the relatively trusty Cup and Handle pattern ( about 90% success ) is broken, and a bearish phase is developing with the monthly lower low and (potentially, at this time of writing) a break down out of the triangle.
In summary, the long term technical set up here is suggesting that Gold will be bearish to 1275 over the next two years. Today, it is just the beginning.
Food for thought here, especially for those who had loaded up in Gold over the last couple of years... will revisit once the month, and quarter, is done.

Gold to Resume Falling as Prices Challenge Pennant SupportGold looks ready to make another leg lower as prices challenge pennant support. A drop near the psychologically-important 1,600 level is in the cards.

The Anatomy of a Gold Bull Market"Reversion to the mean is the iron rule of financial markets."
-John C. Bogle
The gold price has some serious catching up to do, and will likely start the next leg higher as soon as the Fed is forced to pause its rate hikes. Gold miners will outperform in this scenario...

The Anatomy of a Gold Bull MarketGold is set to outperform equities as soon as the Fed pauses rate hikes in the coming months. Now is the time to back up the truck on physical gold and the miners and enjoy a multi-year run...

XAUAUD - Reversal within a larger Ascending broadening wedge. XAUAUD - Bullish reversal within a larger Ascending broadening wedge.

XAUUSD - Ascending broadening Wedge GOLD is hitting long term support now. Contained within a ascending broadening wedge.

GDXU leveraged gold miner ETF LONG SETUPAMEX:GDXU
As illustrated on the one-hour chart GDXU has reversed a downtrend as indicated
by the EMA crossover and so on. Support and Resistance lines are shown.
Price is well below the SMA200 and thus undervalued as compared with historical data.
I see this as an upside 30 % long setup with reasonable risk. Once the trade
progresses perhaps 10-12% in price rise, the stop loss can be moved up to
break even. This can be approached with intermediate-term call options
as well. Targets and stop loss are marked out.

First Majestic Silver AG - Rare OpportunityFirst Majestic silver along with the rest of the mining stocks have been pummeled the last few weeks.. or months..er I mean years. It is my strong opinion that a rare opportunity has opened up in many of these stocks - historical.
These monthly candles really help depict the birds eye view necessary to spot the larger patterns and trend. AG has been forming a large wedge for many years and broke out a few years ago.. Price is now on the launchpad. It might be a slow rocket getting off the ground but it has a tremendous amount of fuel.

GDX gold miner ETF setting up LONGAMEX:GDX
Based on the 4H chart as well as the price action of spot gold
using an EMA ribbon cross-over as well as the volume profile,
I have set up a long trade with two upside targets of about
10 and 20 % upside respectively with a stop loss of about
4% which would be adjusted as soon as the price rises above
$ 27 to move the stop loss to the entry price making for
a breakeven free trade after that. Overall, spot gold
is sitting on support with a bullish RSI divergent pattern.
I also see GDX as a candidate for the intermediate term
call options out of the money about 15% above the current
price being between the two targets.

Newmont breaking out of the box and going lowerThe Bollinger Bands contracting inside the Keltner channel predicts an explosive move ahead that will last at least 8 days. Combine that with Newmont's Price Action creating a box which looks like it's breaking through. I would not be surprised if there was a retrace to the top of the box later today if action is aggressive, or Monday morning - then it's Sayonara Sucka.
I've already detailed all the reasons why in my gold/dxy threads why miners will experience more pain ahead. I'm selling OTM calls and buying ITM puts with the credit here. If it goes up, it's a squash - if it goes down, excellent revenue to average in at a lower price until miners turn around.

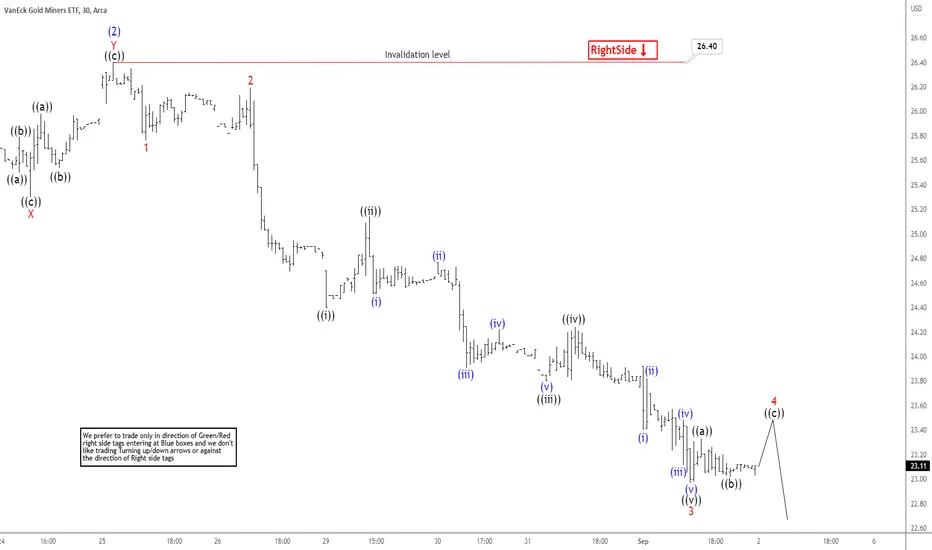
Elliott Wave View: Gold Miners ETF (GDX) Has Reached Inflection Short Term Elliott Wave View in GDX suggests rally to 26.40 ended wave (2). Wave (3) lower is in progress to complete a cycle from August 25th, 2022 high. Internal subdivision of wave (2) unfolded as a double three Elliott Wave structure. Up from wave (1), wave ((a)) ended at 25.23 and pullback in wave ((b)) ended at 25.44. ETF extended higher in wave ((c)) of W towards 26.22. Connector wave X completed as a zigzag correction at 25.30. GDX then resumed the rally in wave ((a)) ended at 25.98 and pullback in wave ((b)) finished at 25.53. Final leg higher wave ((c)) ended at 26.40 which ended wave Y of (2)
GDX turned lower in wave (3). Down from wave (2), wave 1 ended at 25.75 and bounce in wave 2 ended at 26.18. The ETF extended lower in wave 3 towards 22.96. Internal subdivision in wave 3 unfolded as an impulse. Wave ((i)) ended at 24.40 and bounce in wave ((ii)) ended at 25.14. The instrument extended lower in wave ((iii)) of 3 towards 23.80. Then a shallow rally completed wave ((iv)) at 24.24 and last leg lower ended at22.96 completing wave ((v)) of 3. Near term, we are developing a corrective wave 4 and afterwards, it should continue lower to end wave 5 of ((3)). As far as pivot at 26.40 high stays intact, expect any rally to fail for further downside.
GDX vs. BTC still holding uptrendI first published this chart in December last year with the view of owning gold & gold miners over Bitcoin. Whether you took a spread on Gold spot or gold miners(GDX) vs. BTCUSD, either one would have doubled your money this year. It has been a great trade indeed but interesting to note how strong this uptrend has been since the end of last year and there looks like no stopping this gravy train at the moment. In the absence of a technical break, I am still happy to own gold vs. bitcoin for now.

GDX suffering a low periodGDX, the gold miners ETF which once had a lot of potential is now in the doldrums. Having hit 41 in April 2022, it had almost halved within 4 months. Recently, an attempt to consolidate and rebound is seeing a lot of challenges. First, the Gold prices are in a bear trend, secondly, rising interest rates hurt the miners, third, the weak equities market also affect the gold miners.
The GDX weekly chart has in the past couple of weeks attempted a rebound, but the past week pretty much wiped all gains out. This move mellowed the technical indicators and it is less than ideal to be a tad bullish at all.
The daily chart obviously has technically bearish indicators crossing down with momentum.
Overall, very likely to take out the last low.
Nothing much except the obvious... bearish

The Gold Odyssey - a different story emergesPreviously, since Donald Trump started the US-China trade war, Gold has been on a clear trend forming a Cup & Handle pattern in the weekly chart. This was covered in earlier posts with decent accuracy, until recently. It appears that the Gold volatility is significantly heightened, to the extent that the the Handle may have been broken.
The weekly Gold chart shows many recent support failures, especially since April 2022. The past week appears to have failed breaking above the weekly 55EMA, and clocked a long bearish marubozu-like bearish candle that closed below the support range. Although the technical indicators are still looking somewhat less bearish, the weeks to come look bad for Gold really.
The daily chart shows similar patterns of breakdown, with a resistance failure, from a lower high that came from a Bearish Engulfing pattern. This followed through for the week where the 55EMA was again broken down. Technical indicators appear bearish too, especially with the MACD crossing under zero.
Gold is not going to do well for a while, so listen to what the charts are saying... very clear bearish message.
Look for 1700.

GDX: GDX-citing 🍿We hope you’ve all got your popcorn ready because it’s getting more and more exciting here! GDX has reacted to the upper edge of the magenta-colored zone between $19.52 and $27.49 and has slowed down its upwards movement. Although the ETF could directly continue the ascent, we still give it some more room and time to finish wave in magenta a bit deeper in the magenta-colored zone. As soon as wave in magenta is completed, though, GDX should take off, rise above the resistance at $28.83 and head for the next one at $40.13. However, there is a 30% chance that GDX could break through the bottom of the magenta-colored zone and drop below the support at $16.18, which would then activate further descent.
