GDX a long term GOLD MINEGDX has been pretty beaten up over the past year and we are at record Index lows for GDX. 10Y Bonds have fallen which is great for Gold. I'm expecting our FED to slow down tightening policy headed into the New Year. Even if we do not see Gold run GDX can still climb due to such a historical low valuation on GDX.
GDX

Gold & Silver Reaching A Launchpad with Currencies (like 2003)Many traders believe the current setup in Gold/Silver is similar to 2018 or 2015. But the reality is this is more similar to 1999~2003 with a strong US Dollar and weakening global currencies.
As long as Gold/Silver continue to strengthen while the US Dollar stays strong, foreign currencies will weaken and wreak havoc on foreign markets.
Eventually, the risk levels will increase in foreign markets which will send FEAR skyrocketing. That will move capital into Gold/Silver and break the channel/trends that are currently in place.
I believe we are very close (possibly 2 to 4+ months away) from that breaking point.
Watch global Emerging Markets and foreign governments for signs of collapse. These will be the early warning signs that Gold/Silver are "T-minus 10".
Once the US Dollar peaks/turns, we'll be at "T-minus 3".
At that point, everything will be ALL SYSTEMS GO for Gold & Silver.
Pay attention. This is a huge setup for precious metals.

Gold might be on the way towards $3500I believe so. That's why the recent dip in gold price and miners is to shake out the weak hands. I think gold is heading for 100% run.

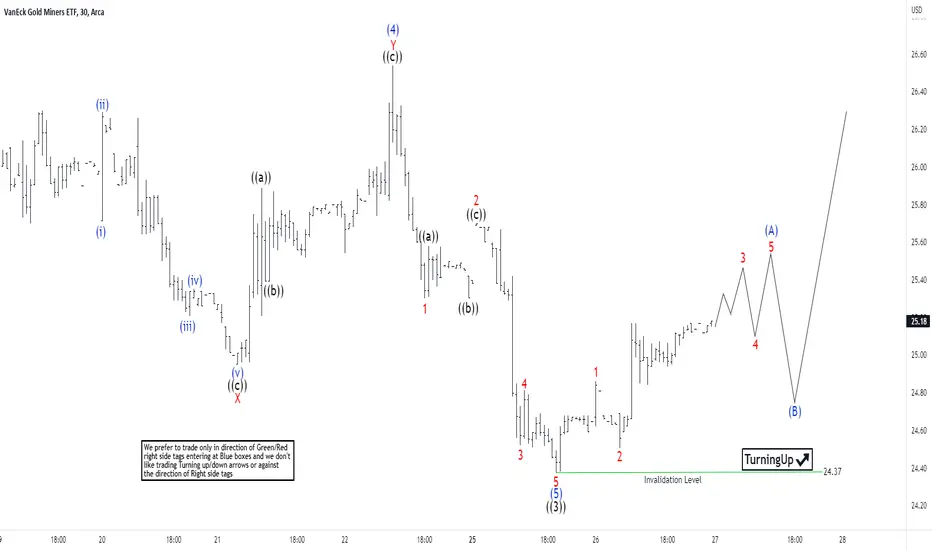
Elliott Wave View: GDX in Support ZoneShort Term Elliott Wave view in GDX suggests cycle from 4/18/2022 high is in progress as a 5 waves impulse Elliott Wave structure. Down from 4/18/2022 high, wave ((1)) ended at 29.66, and rally in wave ((2)) ended at 33.52. Wave ((3)) lower subdivides into another 5 waves in lesser degree. Down from wave ((2)), wave (1) ended at 30.36 and rally in wave (2) ended at 32.80. Index then resumes lower in wave (3) towards 24.92, rally in wave (4) ended at 26.54, and final leg lower wave (5) ended at 24.38 which completed wave ((3)) in higher degree.
Wave ((4)) pullback is now in progress as a zigzag Elliott Wave structure. Up from 7/26/2022 low, wave 1 ended at 24.86 and dips in wave 2 ended at 24.50. Expect a few more highs to end wave 3, then it should pullback in wave 4, before the last push higher in wave 5 to complete wave (A). Afterwards, the Index should pullback in wave (B) before the rally resumes again. Near term, as far as pivot at 24.37 low stays intact, expect dips to find support in 3, 7, 11 swing for further upside.
GDX - where X marks the spotStructural support around 22-24 area. Should get a nice bounce back to 30ish

#GDX vs SPYGold miners testing an important level of horizontal support vs. the SPY (relative chart). If it fails to hold 0.062, we could get further underperformance from gold miners relative to SPY. On the contrary a hold of this support and we could see gold miners start to outperform the general market. For that to happen it would be important to see a reversal form off this support (not happened yet).

GDX Potential Position Trading OpportunityIn this update we review the recent price action in GDX and identify the next high probability trading opportunity and price objectives tot arget

Possible top coming soon for $DXY?I can't say that I've called a top using trendlines atop of a bullish trend, but I've seen a few others do it. With the rise in the dollar bringing mass bearishness to rest of the investment complex, a pause could bring some welcome relief. Anyway, I thought the timing might be relevant as important lower levels approach in $CL, $UX, and some metals, as well being overdue for a meaningful bounce in the equities. I will use the $109.xx marker in DXY to signal a buying point for small positions in UUUU, UEX, NXE, USO, GDX, SILJ, SPY, IWM, AAPL, AMD, et al

GDX GOLD MINER may bottom@24 or 21 zone to retest channel.GDX seems to be doing a BIG UPCHANNEL started from the 2016 low & retested at the 2018 low. If this lower channel is to be retested, GDX may bottom at the 24 green zone. This is the most probable since this is also the 2016 VWAP & the FIB 0.618 retracement from 2016 low.
However, if you look at the VOLUME PROFILE, then GDX may fall more to the 21 zone to create a divergence, ending wave 1 of wave III.
BULLISH longterm: Gold & gold miners will be a good hedge during rising inflation or recession. Every portfolio should have this insurance policy & some other defensives like XLV health, XLP staples & XLU utilities. TLT bonds will also rise during recession while US10Y rates go down in a deflationary environment. GDX may be just in the early stages of the longest wave III rally & has a long way to go.
GDXJ Junior miners fell a lot more so I think percentage wise it will have to rise more just like today. Miners tend to be the leading indicator for GOLD. Gold may fall more to the 1670 to 1760 zone. Gold recovering 1800 will be very bullish while GDX reclaiming 30.37 wave 1 top & previous neckline pivot will also be bullish.
Not trading advice.

GDX big fractal low is in?looking athte GDX fractal, to see if the 3 impuls lower lows and how it plays out

GDX: GDXcellent!GDX has proceeded to follow our primary scenario and has reached the support line at $28.83 by now. Next, it should drop below this mark and into the magenta zone between $27.49 and $19.52 to finish wave ii in magenta. Afterwards, the ETF should focus upwards, rise back above $28.83 and even further above the resistance at $40.13. However, there is a 30% chance that GDX could fail to turn within the magenta zone and could fall below the support line at $16.18 instead, thus continuing the descent.

GDX weakness and bullish failurePrevious analysis appeared bullish, but the price movements in the last two weeks since failed.
The weekly chart instead of following through with the bullish indications, reversed into a weekly gap down and further down for the next week. Weekly technicals are weak and suggest some bearishness.
A clear failure for the GDX ETF to break above the weekly 55EMA.
The daily chart shows how the weekly gap down developed, starting with a gap down that broke down of the gap range. This range was tested and failed for more downside in the following week. finding support at 29.
The technical indicators are bearish indicative, and downside target is currently 27.60.
Bearish breakdown in the works!

Parabolic Setup on the Mining JuniorsThis is a very asymmetric trade setup with nearly blue skies to 100 if it can catch some momentum in the coming sessions.
We also have a nice little fractal that shows us the path upward, should we break 49.
I would not front-run this one and would wait for 50+ daily close before a serious entry. With this level of confirmation in pocket, I'll be taking a rather aggressive stance.
Its a clear magnet-move to 100 - if for no other reason than it being one of the only decent plays available.
=PigMagnet
AMEX:GDXJ
TVC:GOLD
TVC:SILVER
MCX:GOLD1!
MCX:SILVER1!
ASX:GOLD
AMEX:GDX
NYSE:GOLD

Bitcoin Volatility Incoming Up Only or Down BadGrayscale vs SEC is coming up next month
That will be a catalyst to break the coin out of this capitulation range

Gold relative to the Dow Jones has broken out.The rotation out of stocks into gold has begun.
Get yours before there's none left.

Gold Miners ETF, GDX bullish potentialThe weekly chart closed the week nice candle that had a long bottom tail, albeit a red candle, but bullish indication here.
The daily chart had GDX gap down on Friday's opening, then rally hard to close a bullish engulfing, spanning across a resistance zone. This can form the higher low point later next week.
Indicators are not yet bullish, but candlesticks are suggesting the end of the massive retracement with bullish signs and patterns.

GDX bounce but not out of the woods yetGDX found an interim bottom and bounced as expected, but it is not clear that it is bullish, as yet. the recet deep retracement put it out of the -3SD and it bounced back. But apprears to stall for a bit.
Daily technical indicators are not very bullish and this suggests a bit more baking time needed.
Weelly Gap area is the support, a a breakout of the downtrend line is necessary in the week to come.
Watch for it...

The Gold Odyssey - retracement done AS previously described, Gold was in a deep retracement, and it appears that this week, the retracement is done.
Weekly chart shows a reversal candlestick pattern over the past three weeks, finding the week's close at a resistance level. Look for a breakout in the coming weeks, as Gold closed above the weekly 55EMA this past week.
Do note that previous mapping of the handle (Cup & Handle formation) it shifted forward; and 2080 high is expected to be broken around November 2022.
The daily chart show a higher low, and technicals are turning bullish. The retracement was nicely above 1800, and has a potential 20% upside to 2080. Possible for consolidation to near 1800-1820, and would be looking for clarity in the coming weeks.
Meanwhile, would be good for the USD to ease off a little. hehe.
Stay safe and well...

Gold - "No reason to get excited" the thief, he kindly spokeTesting trendline, expecting rejection here. Target around 1600

Gold is about fix the current monetary system IMOThis is speaking from history and of course nobody knows what exactly is going to happen. I like gold and gold miners at these levels as they are the most undervalue assets right now.

GDX Interim Bottom?Just as Gold and equities plummeted over the last 4 weeks, GDX was in no way spared, losing at least 25% from 4 weeks ago. An absolutely deep retracement following Gold prices.
Daily candlestick pattern suggest a brief consolidation at current levels, 30-31.
Do not yet see a bottoming pattern... not yet.

GDX at multiple support levels - Buy for long termThis is weekly GDX chart, testing multiple support levels - Channel lows, 200 SMA and long term support trend line. It's a good buy now for a quick bounce and also for long term. Given inflation is going to be hot for few more years, gold and gold miners will shine.

Gold Update: 5 MayGold rallied together with the markets yesterday, but we cannot be sure yet if this reversal holds. In this video I show a trade idea that has profit potential in two scenarios: A bearish Elliott wave 5 with a lower low, and a continuing rally higher.
