Oil prices rebounded as focus on US-IranOil prices rebounded as markets focused on US-Iran nuclear negotiations, which have dragged on for months without a breakthrough. It raises concerns about the US's escalating tensions to gain bargaining power.
However, the persistent oversupply is forecast to persist due to production expanding beyond the increase in demand this year. But 60 USD/barrel is the anchor for US producers to maintain a certain profit, which urges the US to take action to keep oil prices around this level.
Technically,
WTI is still in an uptrend, with higher lows along the trendline and key support near 61.5–62 that continues to attract buyers on dips, and prices are trading above both extension EMAs (21, 78).
The 65–66.2 zone is a critical resistance area; a strong close above it would open room toward the upper 60s, while rejection and a break below the trendline and 61.5 would warn of a deeper correction.
By Van Ha Trinh - Financial Market Strategist at Exness.
Geopolitical-risk

WTI on the Edge | Calm Before the Geopolitical StormHey everyone, hope you’re doing great and trading smart 👋📊
Wishing you green charts and disciplined decisions 🌱
🛢️ Symbol Overview | WTI Crude Oil
WTI Crude Oil is one of the most important commodities in global markets. Its price is heavily influenced by global supply and demand, OPEC decisions, U.S. economic data, and especially geopolitical tensions. In the current environment, oil is not just a tradable asset — it’s also a barometer of global risk.
📉📈 Technical Analysis
Based on the 4H timeframe, price has completed a clear bullish move and has now entered a ranging (consolidation) phase.
The marked levels on the chart show that the market is currently indecisive, moving between key support and resistance zones and waiting for a strong catalyst to define the next direction.
🔻 Bearish Scenario
If price fails to break and hold above the range high / daily resistance, and we see rejection candles or weak price action, a move back toward the lower boundary of the range becomes likely.
Key points for this scenario:
Strong reaction at resistance
Loss of range support could open the door for deeper correction
⚠️ Confirmation via candle structure is essential — not just a simple price touch.
🔺 Bullish Scenario
The bullish scenario is equally valid ✅
If price breaks above the range high / daily resistance with a strong candle close, we can expect:
A confirmed range breakout
Start of a new bullish leg
Activation of higher upside targets
📌 Trade Idea:
Given the ongoing geopolitical tensions in the Middle East 🌍🔥, a confirmed breakout followed by stabilization above resistance could offer opportunities for longer-term trades (Swing / Position). In such conditions, oil often reacts sharply to news and supply-risk narratives.
📰 News & Geopolitics
Middle East tensions, supply disruption risks, sanctions, or headlines related to strategic routes can ignite sudden volatility in oil prices.
Right now, this market is:
Emotion-driven 😰
News-sensitive 🗞️
Highly volatile ⚡
Stay alert.
⏳ Key Reminder
Patience is everything ⏳
The market always offers opportunities, but capital is not unlimited.
Risk management 💰 and waiting for confirmation matter more than catching the first move.
⚠️ Disclaimer
This analysis reflects personal opinion only and is not financial advice or a trading signal.
Always do your own analysis and manage risk responsibly.
📊 What’s your view?
❓ Do you think oil will break out or continue ranging?
🔘 Bullish
🔘 Bearish
🔘 Range continues
Drop your thoughts in the comments 👇📝
🏷️ Tags
#WTI
#CrudeOil
#OilAnalysis
#TechnicalAnalysis
#Commodities
#TradingView
#RangeMarket
#PriceAction
#RiskManagement
#Geopolitics

Is Salesforce Now a Defense Contractor?Salesforce has reached a defining inflection point that fundamentally transforms its corporate identity. The company, historically known as a commercial software provider, has secured a massive $5.64 billion contract with the U.S. Army extending through 2035. For the first time, the tech giant is positioning itself as a "defense prime contractor" and embracing the Trump administration's provocative rebranding of the Department of Defense as the "Department of War." This move not only stabilizes the company's revenue stream with a long-term, firm-fixed-price agreement but also places it at the center of U.S.-China geopolitical competition and brings it closer to the traditional defense industrial base.
The market has responded with enthusiasm - analysts have raised price targets above $320 per share, and investors view the contract as a bond-like guarantee of stable cash flow. The company's stock surged to the $257 range in early 2026, reflecting Wall Street's revaluation of Salesforce as critical national infrastructure rather than as a volatile SaaS business. However, the pivot carries significant risks. It jeopardizes Salesforce's operations in China, where it has operated for years through local partnerships, and raises serious questions about data sovereignty in Europe, particularly given the U.S. CLOUD Act. With 20% of revenues coming from Europe, Salesforce is entering direct conflict with the digital sovereignty demands of leaders like Macron and Scholz.
The technological dimension is equally compelling: Salesforce is aggressively investing in Agentforce, its autonomous AI agent platform, competing directly with Palantir for dominance in the government software market. The technology promises radical automation of military logistics and personnel management, leveraging Salesforce's enormous advantage in commercial customer data across millions of users. CEO Marc Benioff has emphasized their pricing advantage, undercutting competitors by amortizing R&D costs across their massive commercial base. Yet questions remain: can this pivot deliver long-term returns, or will the company find itself caught in trade wars, sanctions, and regulatory restrictions that undermine future profitability? The transformation from SaaS giant to defense contractor represents either a brilliant strategic repositioning or a dangerous entanglement with geopolitical risk.

Silver have more room to surgeSilver briefly surged to a new record high, exceeding 116 USD/ounce, before consolidating around 110 USD/ounce, propelled by escalating geopolitical tensions initiated by the US. Markets anticipate a "polycrisis" as the new paradigm, disrupting the post-World War II global order. Consequently, investors are diversifying away from Gold into other precious metals, such as Silver and Palladium.
The Gold/Silver ratio collapsed from a peak of 110 to 46, trending toward the 2011 low of 32. Persistent geopolitical risks could drive prices to the 160–200 USD/ounce range. Silver maintains a high correlation with Gold but exhibits a higher standard deviation, which may amplify price gains—particularly as supply deficits loom due to surging demand from the energy transition and AI infrastructure.
Technically, XAGUSD retreated to test the EMA21 before rebounding above both expanding EMAs, signaling a continued uptrend.
If price surpasses the recent swing high, XAGUSD could target the 227.2% Fibonacci extension at 131.
Conversely, failure to sustain levels above the EMA21 may trigger a retest of the lower trendline boundary.
By Van Ha Trinh - Financial Market Strategist at Exness

Is NVIDIA’s AI Boom Hitting a Wall?NVIDIA is the engine behind the global AI boom. From data centers to gaming and high-performance computing, its chips power the most advanced technology on the planet. Over the last two years, NVDA became the market’s biggest winner. Now, it has suddenly slowed down, and investors are asking why.
The stock is down about 12 percent from its all-time high of 212 dollars and closed at 186.23 dollars on January 27, 2026. Even after the pullback, NVIDIA is valued at an eye-watering 4.53 trillion dollars and trades at a P/E ratio of 46. That valuation assumes near-perfect execution, and the market is no longer willing to blindly chase it. After one of the strongest rallies in tech history, NVDA has spent months moving sideways. On the chart, the price is trapped inside a symmetrical triangle, a classic sign of indecision. It is not breaking higher, and it is not breaking lower. Everyone is waiting for something to give.
The biggest reason for this pause is geopolitical, not technical. NVIDIA appeared to secure a massive win with reported orders for more than two million H200 chips from Chinese tech companies, potentially worth around 54 billion dollars. At roughly 27,000 dollars per chip, this deal could have pushed the stock into a new valuation zone. But reality hit fast. Chinese customs blocked H200 shipments just days after the U.S. approved exports under a 25 percent tariff. According to industry sources, the message from Beijing was severe enough to feel like a temporary ban. NVIDIA’s suppliers have already slowed production, and that massive opportunity could disappear almost overnight.
Even if China eventually allows the chips, the math is no longer attractive. A 25 percent tariff means NVIDIA would lose a large chunk of revenue to the U.S. government. Higher prices also make Chinese buyers less enthusiastic, especially as Beijing pushes companies toward domestic alternatives from players like Huawei. This situation risks accelerating China’s long-term shift away from U.S. technology, threatening a market worth tens of billions of dollars every year.
Despite these risks, Wall Street remains optimistic. Analysts still rate NVDA a Strong Buy, with an average price target near 259 dollars, implying roughly 36 percent upside. Some firms, including Evercore ISI, see far higher levels if execution stays flawless. Confidence was also reinforced after CEO Jensen Huang called AI the largest infrastructure buildout in human history and backed that view with a 2 billion dollar investment in CoreWeave to expand AI data centers.
The outlook is clear but tense. NVIDIA is not broken. It is dominant, expensive, and stuck between massive opportunity and serious geopolitical risk. The long consolidation suggests the next move could be powerful. Whether it breaks higher or resets lower will depend less on charts and more on politics, pricing, and how much perfection the market is still willing to pay for.

Can Mobileye Turn a 19M-Unit Win Into Market Dominance?Mobileye Global Inc. has secured a transformative 19-million-unit pipeline through two major deals: 9 million EyeQ6H chips for a top-10 US automaker's next-generation ADAS and a previous Volkswagen commitment. This achievement comes during a challenging period marked by a 50% stock decline in 2025, yet it signals a fundamental shift in the company's business model. The transition from selling basic safety chips at $40–$50 per unit to offering a comprehensive "Surround ADAS" platform at $150–$200 per vehicle represents a tripling of revenue potential, establishing Mobileye as a software-centric platform provider rather than merely a component supplier.
The technical foundation of this strategy rests on the EyeQ6H chip, a 7nm processor capable of handling data from 11 sensors, while deliberately excluding the more expensive LiDAR technology. This cost-conscious design enables hands-free highway driving up to 130 km/h for mass-market vehicles, consolidating multiple functions into a single ECU and simplifying automaker production. The company's proprietary Road Experience Management (REM™) technology, which crowdsources data from millions of vehicles to create high-definition maps, provides a substantial intellectual property moat against competitors like Tesla and Nvidia. Over-the-air update capabilities ensure the platform remains current throughout a vehicle's lifecycle.
However, Mobileye faces significant headwinds that temper investor enthusiasm. With 3,000 of 4,300 employees based in Israel, geopolitical uncertainty affects valuation and operations, prompting a recent 5% workforce reduction of 200 employees. Competition from Chinese rivals like Huawei and Xpeng, who are developing in-house solutions, represents an existential threat to market share. The company characterizes 2025 as a "transition year" plagued by inventory challenges, but the massive order pipeline and improved revenue model position 2026 as potentially pivotal. Success hinges on flawless execution of product launches and the ability to maintain technological leadership while navigating both geopolitical tensions and intensifying competition in the autonomous driving space.

Can Japan's Steel Giant Win the Green War?Nippon Steel Corporation stands at a critical crossroads, executing a radical transformation from domestic Japanese producer to global materials powerhouse. The company targets 100 million tons of global crude steel capacity under its "2030 Medium- to Long-term Management Plan," seeking 1 trillion yen in annual underlying business profit. However, this ambition collides with formidable obstacles: the politically contested $14.1 billion U.S. Steel acquisition faces bipartisan opposition despite Japan's allied status, while the strategic withdrawal from China, including dissolving a 20-year joint venture with Baosteel, signals a decisive "de-risking" pivot toward Western security frameworks.
The company's future hinges on its aggressive Indian expansion through the AM/NS India joint venture, which plans to triple capacity to 25-26 million tons by 2030, capturing the subcontinent's infrastructure boom and favorable demographics. Simultaneously, NSC is weaponizing its intellectual property dominance in electrical steel critical for EV motors through unprecedented patent litigation, even suing major customer Toyota to protect proprietary technology. This technological moat, exemplified by brands like "HILITECORE" and "NSafe-AUTOLite," positions NSC as an indispensable supplier in the global automotive lightweighting and electrification revolution.
Yet existential threats loom large. The "NSCarbolex" decarbonization strategy requires massive capital expenditures of 868 billion yen for electric arc furnaces alone, while bridging to unproven hydrogen direct reduction technology by 2050. Europe's Carbon Border Adjustment Mechanism threatens to tax NSC's exports into oblivion, forcing accelerated retirement of coal-based assets. The March 2025 cyberattack on subsidiary NSSOL exposed digital vulnerabilities as operational technology converges with IT systems. The NSC faces a strategic trilemma: balancing growth in protected markets, ensuring security through supply chain decoupling, and making sustainability investments that threaten near-term solvency. Success demands flawless execution across geopolitical, technological, and financial dimensions, simultaneously a precarious bet on reshaping the global steel order.

Can One Company Own the Ocean Floor?Kraken Robotics has emerged as a dominant force in subsea intelligence, riding three converging megatrends: the weaponization of seabed infrastructure, the global energy transition to offshore wind, and the technological obsolescence of legacy sonar systems. The company's Synthetic Aperture Sonar (SAS) technology delivers range-independent 3cm resolution, 15 times superior to conventional systems. At the same time, its pressure-tolerant SeaPower batteries solve the endurance bottleneck that has plagued autonomous underwater vehicles for decades. This technological moat, protected by 31 granted patents across 19 families, has transformed Kraken from a niche sensor manufacturer into a vertically integrated subsea intelligence platform.
The financial metamorphosis validates this strategic positioning. Q3 2025 revenue surged 60% Year-Over-Year to $31.3 million, with gross margins expanding to 59% and adjusted EBITDA growing 92% to $8.0 million. The balance sheet fortress of $126.6 million in cash, up 750% from the prior year, provides the capital to pursue a dual strategy: organic growth through NATO's Critical Undersea Infrastructure initiative and strategic acquisitions, such as the $17 million purchase of 3D at Depth, which added subsea LiDAR capabilities. The market's 1,000% re-rating since 2023 reflects not speculative excess but a fundamental recognition that Kraken controls critical infrastructure for the emerging blue economy.
Geopolitical tensions have accelerated demand, with the Nord Stream sabotage serving as an inflection point for defense procurement. NATO's Baltic Sentry mission and the alliance-wide focus on protecting 97% of internet traffic carried by undersea cables create sustained tailwinds. Kraken's technology participated in seven naval teams at REPMUS 2025, demonstrating platform-agnostic interoperability that positions it as the universal standard. Combined with exposure to the offshore wind supercycle (250 GW by 2030) and potential deep-sea mining operations valued at $177 trillion in resources, Kraken has positioned itself as the indispensable "picks and shovels" provider for multiple secular growth vectors simultaneously.

The Dual Catalyst: Why Silver's \$50 Breakout is SustainableSilver (XAG/USD) recently broke the crucial $50 per ounce level, signaling a fundamental shift in its market dynamics. While the price edges lower in the short term, primarily due to a strengthened US Dollar (USD), its long-term trajectory is decisively bullish. This surge is not merely speculative. It is driven by an unprecedented convergence of geopolitical risks, critical industrial demand, and shifting macroeconomic policy. Analyzing these catalysts across multiple domains confirms silver's evolving role from a precious metal to a critical industrial asset.
Macroeconomics and Geopolitics
Silver's price strength reflects global systemic risk and monetary policy uncertainty. Current market expectations strongly favor a Federal Reserve (Fed) rate cut by December, with a nearly 68% probability priced in by the CME FedWatch Tool. Lower interest rates reduce the opportunity cost of holding non-yielding silver, making it relatively more attractive than bonds or cash. This dovish outlook provides a powerful structural floor for the price.
From a geopolitical perspective, ongoing global tensions and elevated political risks, like recent US government funding debates, accelerate safe-haven demand. Investors seek hard assets to hedge systemic risks. While gold often leads as the primary safe haven, silver's lower cost and dual-use nature attract broader retail and institutional flows, pushing it higher. A strong, sustained rally will require the price to hold above $50 and overcome the next major resistance near the historical high of $54.50.
Technology, Science, and Patents
Industrial demand now constitutes over 50% of silver’s total annual consumption, fundamentally redefining its market. Its unmatched electrical and thermal conductivity makes it indispensable in high-growth sectors.
* Renewable Energy: Silver is critical for photovoltaics (PV), specifically in solar cells, which form the conductive paste that harvests electrons. The global push for green energy and solar capacity expansion creates structural, persistent demand that consistently tightens the market.
* High-Tech and EVs: Electric Vehicles ( EVs) require significantly more silver (25–50 grams per unit) than traditional vehicles for inverters, battery management systems, and high-voltage contacts. The expansion of 5G technology, advanced computing, and the Internet of Things (IoT) further relies on silver-based components for seamless connectivity and efficiency.
Geostrategy and Supply Chain Risk
Silver is now recognized as a critical mineral by several major economies. This reclassification acknowledges its essential role in national security, advanced manufacturing, and the energy transition. This status highlights a geopolitical vulnerability: silver's supply chain is increasingly seen as a strategic concern.
The market currently runs a persistent supply deficit, depleting above-ground stockpiles to critically low levels. Mining silver often occurs as a byproduct of copper, lead, and zinc, meaning its supply cannot easily scale up based on price alone. Trade conflicts or export controls imposed by major producing nations could severely disrupt supply, immediately spiking the price due to its non-substitutable role in key high-tech applications.
Cyber and Economics: The Future Nexus
Silver’s unique properties extend into emerging fields like cybersecurity* and advanced computing. Research integrates silver nanoparticles and quantum materials into sophisticated systems. These materials enhance data processing efficiency and bolster the security of financial supply chains. Furthermore, flexible electronics using silver nanowires* will drive the next generation of wearable and flexible displays, creating entirely new demand vectors.
The long-term economic case for a $100 silver price remains dependent on this confluence of factors. Sustained high industrial consumption, a breakdown in global supply chains, and a continued environment of monetary debasement must align. Silver has truly become a dual-catalyst metal, positioned to thrive as both a financial safe haven and a fundamental building block of the twenty-first-century green and digital economy.

Is Germany's Economic Success Just an Illusion?Germany's benchmark DAX 40 index surged 30% over the past year, creating an impression of robust economic health. However, this performance masks a troubling reality: the index represents globally diversified multinationals whose revenues originate largely outside Germany's struggling domestic market. Behind the DAX's resilience lies fundamental decay. GDP fell 0.3% in Q2 2025, industrial output reached its lowest level since May 2020, and manufacturing declined 4.8% year-over-year. The energy-intensive sector suffered even steeper contraction at 7.5%, revealing that high input costs have become a structural, long-term threat rather than a temporary challenge.
The automotive sector exemplifies Germany's deeper crisis. Once-dominant manufacturers are losing ground in the electric vehicle transition, with their European market share in China plummeting from 24% in 2020 to just 15% in 2024. Despite leading global R&D spending at €58.4 billion in 2023, German automakers remain trapped at Level 2+ autonomy while competitors pursue full self-driving solutions. This technological lag stems from stringent regulations, complex approval processes, and critical dependencies on Chinese rare earth materials, which could trigger €45-75 billion in losses and jeopardize 1.2 million jobs.
Germany's structural rigidities compound these challenges. Federal fragmentation across 16 states paralyzes digitalization efforts, with the country ranking below the EU average in digital infrastructure despite ambitious sovereignty initiatives. The nation serves as Europe's fiscal anchor, contributing €18 billion net to the EU budget in 2024, yet this burden constrains domestic investment capacity. Meanwhile, demographic pressures persist, though immigration has stabilized the workforce; highly skilled migrants disproportionately consider leaving, threatening to transform a demographic solution into brain drain. Without radical reform to streamline bureaucracy, pivot R&D toward disruptive technologies, and retain top talent, the disconnect between the DAX and Germany's foundational economy will only widen.

Can Defense Giants Print Money During Global Chaos?General Dynamics delivered exceptional Q3 2025 results with revenue reaching $12.9 billion (up 10.6% year-over-year) and diluted EPS soaring to $3.88 (up 15.8%). The company's dual-engine growth strategy continues to drive performance: its defense segments capitalize on mandatory global rearmament driven by escalating geopolitical tensions, while Gulfstream Aerospace leverages resilient demand from high-net-worth individuals. The Aerospace segment alone grew revenue by 30.3% with operating margin expanding 100 basis points, delivering record jet deliveries as supply chains normalized. Operating margin reached 10.3% overall, with operating cash flow hitting $2.1 billion—an extraordinary 199% of net earnings.
The defense portfolio secures decades of revenue visibility through strategic programs, most notably the $130 billion Columbia-class submarine program, which represents the U.S. Navy's top acquisition priority. General Dynamics European Land Systems has secured a €3 billion contract from Germany for next-generation reconnaissance vehicles, capitalizing on record European defense spending that reached €343 billion in 2024 and is projected to reach €381 billion in 2025. The Technology division strengthened its position with $2.75 billion in recent IT modernization contracts, deploying AI, machine learning, and advanced cybersecurity capabilities for critical military infrastructure. The company's 3,340-patent portfolio, with over 45% still active, reinforces its competitive moat in nuclear propulsion, autonomous systems, and signals intelligence.
However, significant operational headwinds persist in the Naval segment. The Columbia-class program faces a 12-to 16-month delay, with the first delivery now anticipated between late 2028 and early 2029, driven by supply chain fragility and specialized workforce shortages. Late delivery of major components forces complex out-of-sequence construction work, while the defense industrial base struggles with critical skill gaps in nuclear-certified welders and specialized engineers. Management emphasizes that the upcoming year will be pivotal for driving productivity improvements and margin recovery in Naval operations.
Despite near-term challenges, General Dynamics' balanced portfolio positions it for sustained outperformance. The combination of non-discretionary defense spending, technological superiority in strategic systems, and robust free cash flow generation provides resilience against volatility. Success in stabilizing the submarine industrial base will determine long-term margin trajectory, but the company's strategic depth and cash generation capability support continued alpha generation in an increasingly uncertain global environment.

Trading Crude Oil and the Geopolitical Impact on PricesIntroduction
Crude oil is one of the most strategically significant commodities in the global economy. It fuels transportation, powers industries, and serves as a critical input for countless products ranging from plastics to fertilizers. Because of its universal importance, crude oil trading is not just a financial endeavor—it is a reflection of global political stability, economic growth, and international relations. The price of crude oil is highly sensitive to geopolitical events, including wars, sanctions, alliances, and policy changes. Understanding how geopolitical dynamics affect oil trading and pricing is vital for traders, investors, and policymakers.
1. The Fundamentals of Crude Oil Trading
Crude oil trading involves the buying and selling of oil in various markets, primarily through futures contracts on exchanges such as the New York Mercantile Exchange (NYMEX), Intercontinental Exchange (ICE), and Dubai Mercantile Exchange (DME). These contracts allow traders to speculate on the future price of oil, hedge against risks, or facilitate physical delivery. Two main benchmark grades dominate the market: West Texas Intermediate (WTI) and Brent Crude.
WTI Crude Oil is primarily sourced from the U.S. and traded in dollars per barrel.
Brent Crude Oil is produced in the North Sea and serves as the global benchmark for pricing.
Oil prices are influenced by multiple factors, including supply and demand fundamentals, global economic growth, production levels, inventory data, transportation costs, and geopolitical events. Among these, geopolitical tensions often have the most immediate and dramatic impact.
2. Geopolitics as a Determinant of Oil Prices
The global oil market is uniquely vulnerable to geopolitical developments because a significant portion of reserves and production is concentrated in politically sensitive regions such as the Middle East, North Africa, and Russia. Around 60% of proven oil reserves lie in OPEC (Organization of Petroleum Exporting Countries) member nations, many of which have experienced conflict, sanctions, or regime instability.
Geopolitical risk refers to the potential disruption in oil supply or transportation routes due to international conflicts, political upheaval, or policy decisions. When such risks escalate, traders often bid up oil prices in anticipation of supply shortages—even before any actual disruption occurs.
3. Historical Perspective: Major Geopolitical Events and Oil Prices
a. The 1973 Arab Oil Embargo
One of the earliest and most significant examples of geopolitically driven oil price shocks occurred in 1973 when Arab OPEC members imposed an oil embargo against the United States and other nations supporting Israel during the Yom Kippur War. Oil prices quadrupled within months, leading to inflation, recession, and a global energy crisis. The embargo demonstrated the power of oil as a political weapon and the vulnerability of consumer nations.
b. The Iranian Revolution (1979)
The overthrow of the Shah of Iran and the subsequent decline in Iranian oil production reduced global supply by nearly 5%. This shortage, coupled with the Iran-Iraq War (1980–1988), sent prices soaring again. The resulting volatility highlighted how political instability in a single oil-producing nation could ripple through the entire global economy.
c. The Gulf War (1990–1991)
Iraq’s invasion of Kuwait disrupted nearly 5 million barrels per day of oil production. The U.S.-led coalition’s response and the ensuing war created massive uncertainty in the Middle East, briefly pushing oil prices above $40 per barrel—a significant level for that time.
d. The Iraq War (2003)
The U.S. invasion of Iraq reignited geopolitical fears about supply disruptions. Although global production eventually stabilized, the war contributed to sustained higher oil prices in the early 2000s, further compounded by rapid industrialization in China and India.
e. The Arab Spring (2010–2011)
The wave of protests across the Middle East and North Africa led to regime changes and unrest in key producers such as Libya and Egypt. The civil war in Libya, in particular, cut oil output by over one million barrels per day, causing Brent crude prices to exceed $120 per barrel.
f. Russia-Ukraine Conflict (2014 and 2022)
Russia’s annexation of Crimea in 2014 and its full-scale invasion of Ukraine in 2022 significantly disrupted global energy markets. As one of the world’s largest oil and gas exporters, Russia faced Western sanctions that restricted exports, insurance, and financing. In early 2022, Brent crude spiked above $130 per barrel, reflecting fears of prolonged supply shortages and energy insecurity across Europe.
4. Channels Through Which Geopolitics Impacts Oil Prices
Geopolitical events influence oil prices through several interconnected channels:
a. Supply Disruptions
Conflicts or sanctions can directly reduce oil supply by damaging infrastructure, limiting production, or restricting exports. For example, sanctions on Iran in 2012 and again in 2018 led to significant declines in its oil exports, tightening global supply.
b. Transportation and Shipping Risks
Chokepoints such as the Strait of Hormuz, Suez Canal, and Bab el-Mandeb Strait are vital for global oil transportation. Any military conflict or threat in these areas immediately raises concerns about shipping disruptions, leading to higher prices. Nearly 20% of global oil passes through the Strait of Hormuz daily.
c. Speculative Reactions
Traders and hedge funds respond quickly to geopolitical news, often amplifying price movements. Futures markets price in expected risks, causing volatility even when actual supply remains unaffected.
d. Strategic Reserves and Policy Responses
Nations often release oil from strategic reserves or negotiate production increases through OPEC to stabilize markets. For example, the U.S. and IEA (International Energy Agency) coordinated strategic reserve releases in 2022 to offset supply disruptions caused by the Russia-Ukraine conflict.
e. Currency Movements
Since oil is traded in U.S. dollars, geopolitical tensions that weaken the dollar or create global uncertainty can influence oil prices. A weaker dollar often makes oil cheaper for non-U.S. buyers, boosting demand and raising prices.
5. OPEC and Geopolitical Strategy
The Organization of Petroleum Exporting Countries (OPEC), formed in 1960, and its extended alliance OPEC+, which includes Russia, play a pivotal role in determining oil supply and prices. The organization uses coordinated production quotas to manage global prices, often aligning decisions with geopolitical interests.
For instance:
In 2020, during the COVID-19 pandemic, OPEC+ cut production by nearly 10 million barrels per day to support collapsing prices.
In 2023, Saudi Arabia and Russia announced voluntary cuts to maintain price stability amid slowing demand and Western sanctions.
OPEC’s policies are inherently geopolitical, balancing the economic needs of producers with the political relationships among member states and major consumer nations.
6. Energy Transition and the New Geopolitics of Oil
The growing global emphasis on renewable energy and decarbonization is reshaping the geopolitical landscape of oil trading. As nations transition to cleaner energy, oil-producing countries face the challenge of maintaining revenue while managing political stability.
However, this transition also introduces new geopolitical dependencies—for example, on lithium, cobalt, and rare earth metals used in electric vehicle batteries. While demand for oil may gradually plateau, geopolitical risks remain as nations compete over new energy supply chains.
Additionally, U.S. shale production has transformed the country from a net importer to a major exporter, reducing its vulnerability to Middle Eastern geopolitics but also introducing new market dynamics. Shale producers can ramp up or scale down production relatively quickly, acting as a “shock absorber” to global price swings.
7. The Role of Technology and Market Transparency
Technological advancements in trading—especially algorithmic and data-driven models—have increased market liquidity but also heightened sensitivity to news. Real-time tracking of geopolitical developments via satellites, social media, and analytics platforms allows traders to react instantly.
For example, satellite data showing tanker movements or refinery fires can trigger immediate price adjustments. The intersection of AI, big data, and geopolitics now defines modern oil trading strategies, with traders assessing both quantitative signals and qualitative geopolitical intelligence.
8. Managing Geopolitical Risk in Oil Trading
Professional oil traders and corporations employ various strategies to manage geopolitical risks:
Diversification: Sourcing oil from multiple regions to minimize reliance on unstable producers.
Hedging: Using futures, options, and swaps to lock in prices and reduce exposure to volatility.
Scenario Analysis: Running stress tests based on potential geopolitical outcomes (e.g., war, sanctions, embargoes).
Political Risk Insurance: Protecting investments against losses due to government actions or conflict.
Strategic Reserves: Governments maintain emergency stockpiles to stabilize supply during crises.
In addition, diplomatic engagement and international cooperation—such as IEA coordination or U.N.-mediated negotiations—can help mitigate disruptions and maintain market balance.
9. The Future Outlook: Geopolitics and the Oil Market
As of the mid-2020s, the global oil market faces a new era of geopolitical uncertainty. Key issues shaping the future include:
The U.S.-China rivalry, which may influence energy trade routes and technological access.
Middle Eastern realignments, including normalization of relations between former rivals and shifting alliances.
Climate policy conflicts, as nations balance carbon reduction commitments with economic growth needs.
Sanctions regimes on Russia, Iran, and Venezuela, which continue to restrict global supply flexibility.
The digitalization of trading, which increases speed and transparency but also amplifies volatility.
Although long-term demand growth may slow due to renewable energy adoption, oil will remain a central geopolitical and economic asset for decades. The world’s dependence on energy ensures that geopolitics will continue to shape price trends, investment decisions, and market psychology.
Conclusion
Crude oil trading is not merely a reflection of supply and demand; it is a barometer of global stability and geopolitical tension. From the 1973 oil embargo to the ongoing Russia-Ukraine conflict, political decisions have repeatedly proven capable of reshaping energy markets. For traders and policymakers alike, understanding the geopolitical dimensions of oil is crucial for navigating price volatility and maintaining economic resilience.
As the energy transition accelerates, the nature of geopolitical risk will evolve—but it will not disappear. The intersection of oil, politics, and global economics will continue to define international relations and financial markets, ensuring that crude oil remains one of the world’s most geopolitically sensitive and closely watched commodities.

Could One Alaskan Mine Reshape Global Power?Nova Minerals Limited has emerged as a strategically critical asset in the escalating U.S.-China resource competition, with its stock surging over 100% to reach a 52-week high. The catalyst is a $43.4 million U.S. Department of War funding award under the Defense Production Act to develop domestic military-grade antimony production in Alaska. Antimony, a Tier 1 critical mineral essential for defense munitions, armor, and advanced electronics, is currently imported by the U.S. in its entirety, with China and Russia controlling the global market. This acute dependency, coupled with China's recent export restrictions on rare earths and antimony, has elevated Nova from mining explorer to national security priority.
The company's dual-asset strategy offers investors exposure to both sovereign-critical antimony and high-grade gold reserves at its Estelle Project. With gold prices exceeding $4,000 per ounce amid geopolitical uncertainty, Nova's fast-payback RPM gold deposit (projected sub-one-year payback) provides crucial cash flow to self-fund the capital-intensive antimony development. The company has secured government backing for a fully integrated Alaskan supply chain from mine to military-grade refinery, bypassing foreign-controlled processing nodes. This vertical integration directly addresses supply chain vulnerabilities that policymakers now treat as wartime-level threats, evidenced by the Department of Defense's renaming to the Department of War.
Nova's operational advantage stems from implementing advanced X-Ray Transmission ore sorting technology, achieving a 4.33x grade upgrade while rejecting 88.7% of waste material. This innovation reduces capital requirements by 20-40% for water and energy, cuts tailings volume up to 60%, and strengthens environmental compliance critical for navigating Alaska's regulatory framework. The company has already secured land use permits for its Port MacKenzie refinery and is on track for initial production by 2027-2028. However, long-term scalability depends on the proposed $450 million West Susitna Access Road, with environmental approval expected in Winter 2025.
Despite receiving equivalent Department of War validation as peers like Perpetua Resources (market cap ~$2.4 billion) and MP Materials, Nova's current enterprise value of $222 million suggests significant undervaluation. The company has been invited to brief the Australian Government ahead of the October 20 Albanese-Trump summit, where critical minerals supply chain security tops the agenda. This diplomatic elevation, combined with JPMorgan's $1.5 trillion Security and Resiliency Initiative, which targets critical minerals, positions Nova as a cornerstone investment in Western supply chain independence. Success hinges on disciplined execution of technical milestones and securing major strategic partnerships to fund the estimated A$200-300 million full-scale development.

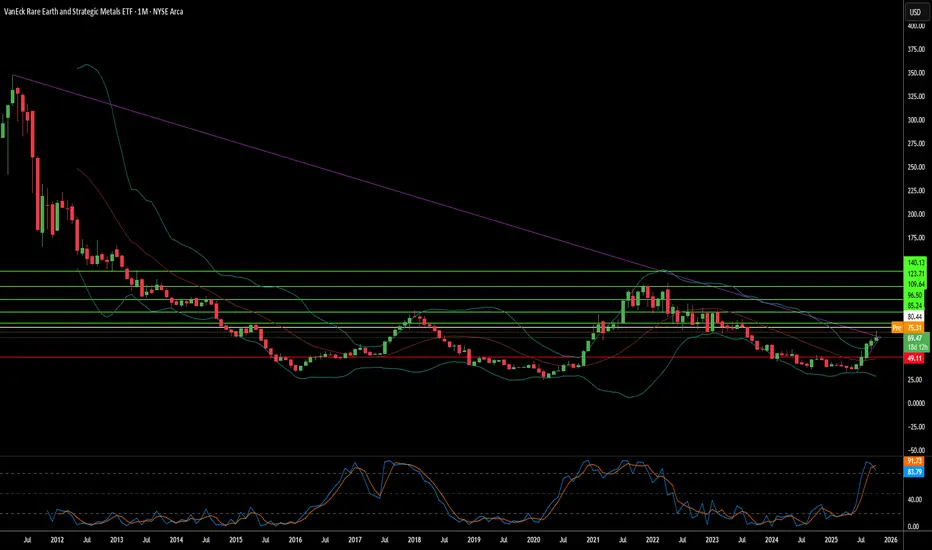
Can China Weaponize the Elements We Need Most?China's dominance over rare earth element (REE) processing has transformed these strategic materials into a geopolitical weapon. While China controls approximately 69% of global mining, its true leverage lies in processing, where it commands over 90% of Global capacity and 92% of permanent magnet manufacturing. Beijing's 2025 export controls exploit this chokehold, requiring licenses for REE technologies used even outside China, effectively extending regulatory control over global supply chains. This "long-arm jurisdiction" threatens critical industries from semiconductor manufacturing to defense systems, with immediate impacts on companies like ASML facing shipment delays and US chipmakers scrambling to audit their supply chains.
The strategic vulnerability runs deep through Western industrial capacity. A single F-35 fighter jet requires over 900 pounds of REEs, while Virginia-class submarines need 9,200 pounds. The discovery of Chinese-made components in US defense systems illustrates the security risk. Simultaneously, the electric vehicle revolution guarantees exponential demand growth. EV motor demand alone is projected to reach 43 kilotons in 2025, driven by the prevalence of permanent magnet synchronous motors that lock the global economy into persistent REE dependency.
Western responses through the EU Critical Raw Materials Act and US strategic financing establish ambitious diversification targets, yet industry analysis reveals a harsh reality: concentration risk will persist through 2035. The EU aims for 40% domestic processing by 2030, but projections show the top three suppliers will maintain their stranglehold, effectively returning to 2020 concentration levels. This gap between political ambition and physical execution stems from formidable barriers environmental permitting challenges, massive capital requirements, and China's strategic shift from exporting raw materials to manufacturing high-value downstream products that capture maximum economic value.
For investors, the VanEck Rare Earth/Strategic Metals ETF (REMX) operates as a direct proxy for geopolitical risk rather than traditional commodity exposure. Neodymium oxide prices, which plummeted from $209.30 per kilogram in January 2023 to $113.20 in January 2024, are projected to surge to $150.10 by October 2025 volatility driven not by physical scarcity but by regulatory announcements and supply chain weaponization. The investment thesis hinges on three pillars: China's processing monopoly converted into political leverage, exponential green technology demand establishing a robust price floor, and Western industrial policy guaranteeing long-term financing for diversification. Success will favor companies establishing verifiable, resilient supply chains in downstream processing and magnet manufacturing outside China, though the high costs of secure supply, including mandatory cybersecurity auditing and environmental compliance, ensure elevated prices for the foreseeable future.
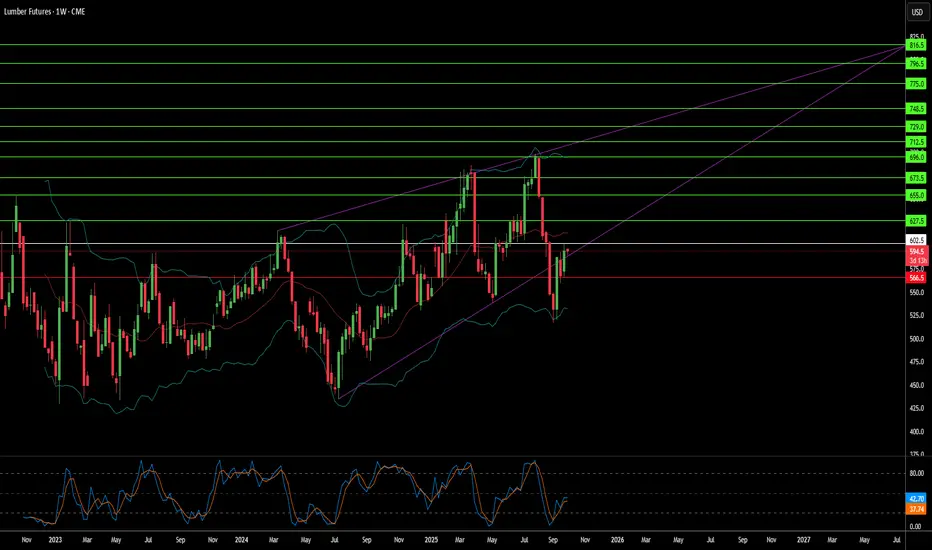
Why Did Cheap Lumber Become a National Security Issue?Lumber prices have entered a structurally elevated regime, driven by the convergence of trade policy, industrial capacity constraints, and emerging technological demand. The U.S. administration's imposition of Section 232 tariffs - 10% on softwood lumber and up to 25% on wood products like cabinets - reframes timber as critical infrastructure essential for defense systems, power grids, and transportation networks. This national security designation provides legal durability, preventing a quick reversal through trade negotiations and establishing a permanent price floor. Meanwhile, Canadian producers facing combined duties exceeding 35% are pivoting exports toward Asian and European markets, permanently reducing North American supply by over 3.2 billion board feet annually that domestic mills cannot quickly replace.
The domestic industry faces compounding structural deficits that prevent rapid capacity expansion. U.S. sawmill utilization languishes at 64.4% despite demand, constrained not by timber availability but by severe labor shortages—the average logging contractor age exceeds 57, with one-third planning retirement within five years. This workforce crisis forces expensive automation investments while climate-driven wildfires introduce recurring supply shocks. Simultaneously, cybersecurity vulnerabilities in digitized mill operations pose quantifiable risks, with manufacturing ransomware attacks causing an estimated $17 billion in downtime since 2018. These operational constraints compound tariff costs, with new home prices increasing $7,500 to $22,000 before builder markups and financing costs amplify the final impact by nearly 15%.
Technological innovation is fundamentally reshaping demand patterns beyond traditional housing cycles. Cross-laminated timber (CLT) markets are growing at 13-15% annually as mass timber products displace steel and concrete in commercial construction, while wood-based nanomaterials enter high-tech applications from transparent glass substitutes to biodegradable electronics. This creates resilient demand for premium-grade wood fiber across diversified industrial sectors. Combined with precision forestry technologies - drones, LiDAR, and advanced logistics software—these innovations both support higher price points and require substantial capital investment that further elevates the cost baseline.
The financialization of lumber through CME futures markets amplifies these fundamental pressures, with prices reaching $1,711 per thousand board feet in 2021 and attracting speculative capital that magnifies volatility. Investors must recognize this convergence of geopolitical mandates, chronic supply deficits, cyber-physical risks, and technology-driven demand shifts as establishing a permanently elevated price regime. The era of cheap lumber has definitively come to an end, replaced by a high-cost, high-volatility environment that requires sophisticated supply chain resilience and financial hedging strategies.
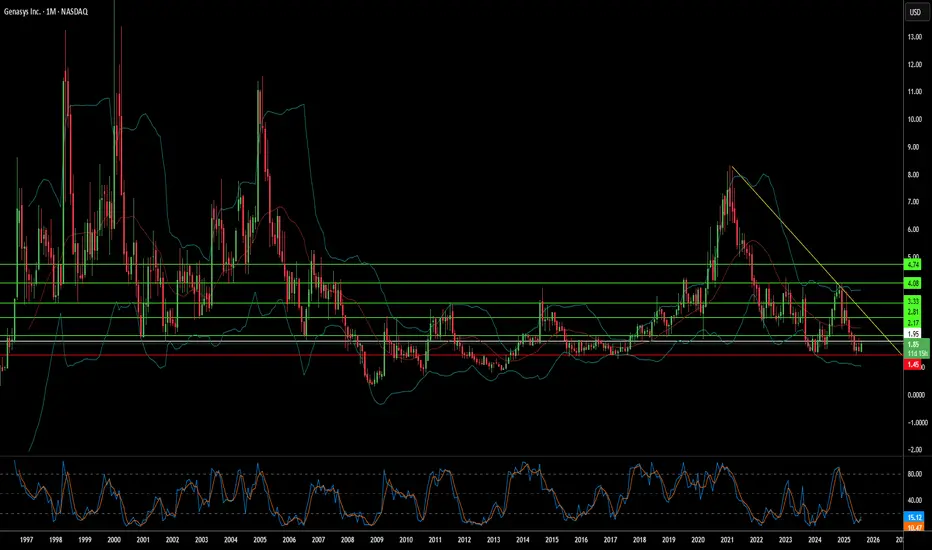
Can Sound Waves Become Tomorrow's Shield Against Global Chaos?Genasys Inc. (NASDAQ: GNSS) operates at the convergence of escalating global instability and technological innovation, positioning itself as a critical player in the protective communications sector. The company's sophisticated portfolio combines its proprietary Long Range Acoustic Device (LRAD) systems with the cloud-first Genasys Protect software platform, serving over 155 million individuals across more than 100 countries. With law enforcement agencies in over 500 U.S. cities utilizing LRAD systems for applications ranging from SWAT operations to crowd control, Genasys has established itself as the global standard in acoustic hailing devices, delivering messages 20-30 decibels louder and with superior intelligibility compared to traditional systems.
The company's growth trajectory aligns with powerful macroeconomic forces driving unprecedented demand for protective communications. Global defense spending surged to $2.718 trillion in 2024—a 9.4% increase representing the steepest rise since 1988—while the critical infrastructure protection market is projected to grow from $148.64 billion in 2024 to $213.94 billion by 2032. Genasys's integrated solutions directly address this expanding market through non-kinetic de-escalation capabilities and cyber-physical threat mitigation, recently securing $1 million in LRAD orders for the Middle East and Africa as geopolitical tensions intensify.
Genasys's competitive advantage rests on a robust foundation of 17 registered patents, particularly in acoustic hailing technology, creating significant barriers to entry while enabling premium pricing. The company's $4.2 million annual R&D investment ensures continued innovation, while strategic partnerships like its collaboration with FloodMapp demonstrate the platform's evolution toward predictive threat mitigation rather than merely reactive response. Despite current profitability challenges—with Q3 2025 net losses of $6.5 million—the company maintains a substantial project backlog exceeding $16 million, plus the transformative $40 million Puerto Rico Early Warning System project expected to generate $15-20 million in fiscal 2025 revenue.
The investment thesis centers on Genasys's unique positioning to capitalize on the global shift toward sophisticated, non-lethal security solutions amid rising geopolitical instability. With percentage-of-completion accounting currently suppressing gross margins to 26.3% but promising significant margin expansion as major projects near completion, the company represents a compelling opportunity for investors seeking exposure to defense, public safety, and critical infrastructure growth markets. The convergence of technological superiority, strategic market positioning, and substantial revenue visibility through confirmed backlog suggests significant long-term potential despite near-term financial complexities.
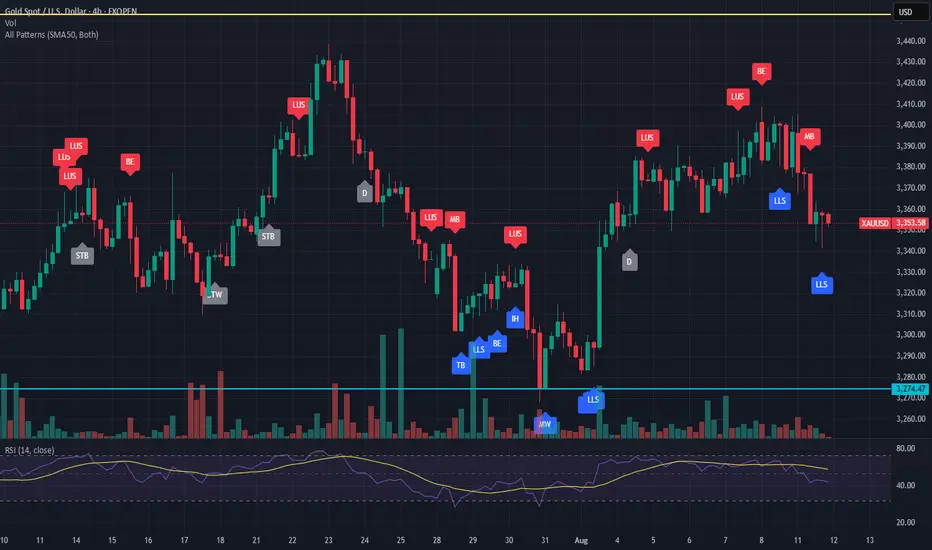
U.S. Slaps 39% Tariff on Swiss Gold BarsU.S. Slaps 39% Tariff on Swiss Gold Bars, Shaking the Global Bullion Market
By Hirad Aryanejad – Macroeconomic & Gold Markets Analyst
---
The United States has moved to impose a 39% tariff on imports of one-kilogram and 100-ounce gold bars from Switzerland — a shock decision that could ripple across the global bullion market.
In a letter dated July 31, 2025, the U.S. Customs and Border Protection (CBP) reclassified these widely traded bullion products — critical to the Comex futures market — as “semi-manufactured”, making them subject to duties.
Previously, they were classified as “unwrought, nonmonetary gold” , exempting them from earlier tariff rounds.
---
A Blow to the World’s Largest Refining Hub
The decision follows former President Donald Trump’s broader tariff package on all Swiss goods, announced after rejecting Switzerland’s proposal for a 10% tariff in exchange for \$150 billion in U.S.-bound investment.
Switzerland — the world’s largest gold refining hub — exported roughly $61.5 billion in gold to the U.S. over the 12 months ending June 2025. The new tariff could add nearly $24 billion in duties.
Christoph Wild, President of the Swiss Association of Manufacturers and Traders of Precious Metals, called the ruling “another blow” to Swiss-U.S. gold trade, warning that exports may become “economically unviable”.
---
Market Reaction: Record Gold Prices
The ruling triggered an immediate market shock. Gold futures in New York surged past $3,500 per troy ounce, hitting a record $3,534 on August 8, before pulling back slightly.
Analysts say the rally was driven by both the tariff announcement and gold’s safe-haven appeal amid escalating trade tensions and geopolitical uncertainty.
Some traders described the CBP’s decision as “shocking” and possibly mistaken, predicting legal challenges ahead. The lack of clarity has already caused certain shipments to freeze in transit.
---
The Critical Role of Switzerland in Bullion Logistics
Global bullion trade depends on a triangular supply chain:
Raw gold refined in Switzerland Cast into kilo bars for the U.S. market or 400-ounce bars for London Delivered to satisfy Comex contracts and central bank reserves
This logistical network is now under threat. UBS strategist Joni Teves has questioned whether U.S. gold futures trading can remain viable if tariffs on deliverable products persist.
The Swiss Precious Metals Association noted that the CBP’s clarification applies to all 1kg and 100oz gold bars imported into the U.S. not only those from Switzerland — raising the stakes for global trade flows.
---
Negotiations and Uncertainty Ahead
Switzerland continues to negotiate with Washington to reduce the tariff burden, but uncertainty remains.
The White House is reportedly preparing a clarification on the bullion tariffs that could determine whether the market stabilizes or faces prolonged disruption.
Until then, gold industry players — from major banks to refining houses — are bracing for further volatility, both in pricing and physical supply chains.
---
Keywords: gold market news, Swiss gold bars, U.S. gold tariffs, Comex gold futures, bullion trade, Switzerland gold exports, precious metals refining, gold price surge, macroeconomic analysis.
Risk and Probability in Trading — Why Risk Assessment MattersRisk and Probability in Trading — Why Risk Assessment Matters More Than Chasing the “Holy Grail”
In trading, most participants and analysts are focused on finding the so-called “Holy Grail” — the perfect entry point where the price moves in the desired direction and yields profit. However, few actually assess the risks involved, as if success is possible without factoring them in. Market reviews are often filled with levels, forecasts, and price directions, but rarely include probability estimates or potential losses.
In my view, the real Holy Grail isn't a guaranteed profitable entry, but a scenario where the market offers a position with minimal risk relative to historical context. To identify such setups, we need a risk scale based on historical data — how favorable the current risk-to-reward ratio is compared to the past.
It’s also crucial to understand that no one can predict price direction with certainty. The key to opening a position is not hope, but evaluating all possible scenarios — upward, downward, or sideways — and knowing the outcome in each case. Risk management is more than just placing a stop-loss; it’s a structured approach that should be central to any trading strategy.
What Are Minimal Risks?
“Minimal risk” is a relative concept — it only makes sense when measured against a defined scale. Building such a scale requires historical statistics: what were the maximum and minimum losses and profits for similar positions in the past?
Profit-to-Loss Ratio
The idea behind the search for the “Holy Grail” is to find moments when the market offers the best possible profit-to-risk ratio. For example, if the current ratio is 10, and historically it has ranged from 0 (low risk) to 100 (high risk), then 10 may be a good entry point. If the ratio approaches 80–90, it signals that the position is extremely risky.
Why Are Probability and Risk Assessment Important?
Market reviews often talk about resistance levels, volatility, and price direction — but rarely address the risks of different scenarios. No expert can predict market movements with certainty — if they could, they’d be billionaires. Opening positions without accounting for risks and scenario probabilities is extremely dangerous.
How to Factor in Risks When Entering a Position
The key question is: what will the profit-to-loss ratio be after entering a position, depending on whether the price goes up, down, or stays flat? It’s important to understand the consequences of each case and make decisions based on risk assessment.
Risk Management Must Account for the Inability to React Instantly
Conventional tools like stop-losses and limit orders often fail to protect capital effectively during sudden price spikes. These tools are particularly vulnerable when market makers or high-frequency algorithms trigger stop levels en masse.
This highlights the need for more resilient risk management instruments — ones that can respond to volatility instantly and automatically. Options are one such tool, capable of limiting losses regardless of market dynamics.
Without robust risk management, long-term profitability becomes statistically unlikely. Sooner or later, the market will present a scenario that can wipe out your capital — unless you’re properly protected.
Important note: this is not an endorsement of options or any specific broker. It’s simply a conclusion based on the logic of building effective capital protection. If a broker only provides access to linear instruments (futures, spot, stocks) without the ability to hedge, it will inevitably lead to capital erosion — even for systematic traders.
And if this article gets more than 100 rockets, I’ll continue sharing specific examples of low-risk trading assessments.

Crude Oil Prices Rocketing amid geopolitical risks
NYMEX:CL1! NYMEX:MCL1! NYMEX:BZ1!
Macro:
Geopolitical tensions remain high and markets are now likely to price in our scenario discussing ongoing air and missile war, given one-off intervention from the US thus far. According to Reuters, the U.S. now assesses that Iranian retaliation could occur within the next two days.What happens next is anybody’s guess but as traders, it is important to navigate these uncertainties with scenario planning and/or reduce risk to account for increased volatility.
We also get Services and Manufacturing PMI data today and PCE Price Index on Friday. Chair Powell is set to testify on Tuesday 9am CT.
Key levels:
Jan 2025 High: 76.57
2025 High: 78.40
2025 CVAH(Composite Value Area High): 75.68
Key LIS zone: 73.50-73.15
We anticipate the following scenarios in crude oil:
Scenario 1:
Prices remain elevated as tensions remain high, despite limited retaliation, however, the situation overall now escalated beyond return to diplomacy.
Scenario 2:
Any push towards de-escalation, unlikely in our analysis, but given the headline risk, crude prices may remain volatile and come off the highs.
Given our key LIS (Line in Sand) zone above, we favor longs above this and shorts below this zone.

S&P 500 Daily Chart Analysis For Week of June 20, 2025Technical Analysis and Outlook:
The S&P 500 Index has primarily exhibited downward trends during this week’s abbreviated trading session, narrowly failing to reach the targeted Mean Support level of 5940, as outlined in the previous Daily Chart Analysis. Currently, the index exhibits a bearish trend, suggesting a potential direction toward the Mean Support level of 5940, with an additional critical support level identified at 5888.
Contrariwise, there exists a substantial likelihood that following the accomplishment of hitting the Mean Support of 5940, the index may experience recovery and ascend toward the Mean Resistance level of 6046. This upward movement could facilitate a resilient rally, ultimately topping in the completion of the Outer Index Rally at 6073, thereby enabling the index to address the Key Resistance level situated at 6150.

EUR/USD Daily Chart Analysis For Week of June 20, 2025Technical Analysis and Outlook:
During this week's trading session, the Eurodollar has encountered a significant decline, dipping below the Mean Support level of 1.149; however, it exhibited a modest recovery on Friday. Recent analyses indicate that the Euro is likely to decrease further to the Mean Support level of 1.148, with the potential for extending its bearish trend to reach 1.140. Nevertheless, there remains a possibility that the current recovery will persist, which could result in price movements targeting the Key Resistance level at 1.158 and potentially leading to a retest of the Outer Currency Rally's 1.163 mark.

Bitcoin(BTC/USD) Daily Chart Analysis For Week of June 20, 2025Technical Analysis and Outlook:
In the recent trading session, Bitcoin exhibited an upward trend; however, it subsequently experienced a significant decline from the established Mean Resistance level at 110300. On Friday, Bitcoin exhibited notable price action, characterized by a pump-and-dump scenario. At this juncture, Bitcoin is retracing downwards as it seeks to approach the Mean Support level at 101500 and the ultimate Inner Coin Dip at 96500. It is essential to acknowledge the potential for an upward rally from the Mean Support levels of $101500 and/or the Inner Coin Dip at $96500. Such a rally could culminate in a retest of the Mean Resistance level at $107000.

Rising Geopolitical Tension (Iran Conflict) Signals Market RiskMoving Partially to Cash (VEA, QQQ, TQQQ, SPY, TECL, SOXL)
The global market is entering a high-risk environment. Geopolitical escalation, particularly the growing threat of direct US involvement in a military conflict with Iran, is pushing global uncertainty to new highs. Tensions in the Middle East, rising oil and gold volatility, and increased friction between major world powers all point toward a potential market breakdown. On the chart, VEA ETF is showing signs of topping out within a rising wedge pattern. Meanwhile, institutional funds are starting to reduce exposure to high-risk assets. I'm taking partial profits and shifting to cash across VEA, QQQ, TQQQ, SPY, SOXL, and TECL to preserve gains. Buy-back zones are set around 53.00, 48.00, and 44.00. In an environment of global escalation and rapid risk-off sentiment, active portfolio defense is more important than passive hope.
