GOLD IS IN TROUBLE BIG DECLINE SETUP Gold has rallied back to .786 I see High risk of being long gold now We could see a huge drop based on formations and model I have taken long PUTS in GLD
GLD_USD

CAD/JPY – H4 Analysis ...CAD/JPY – H4 Analysis (As per My chart)
Market Structure
Overall trend was bullish, price respected the ascending trendline + Ichimoku cloud.
Price has formed a clear Double Top near the highs.
Recent candles show breakdown below momentum, signaling a bearish correction.
---
📉 Sell Scenario
Sell Zone: 112.30 – 112.80
🎯 Targets
Target 1: 109.50
Target 2: 106.50
---
❌ Invalidation
A strong H4 close above 113.80 will invalidate the bearish setup.
---
📌 Summary
Pattern: Double Top
Bias: SELL
Expectation: Price to move down toward lower demand zones

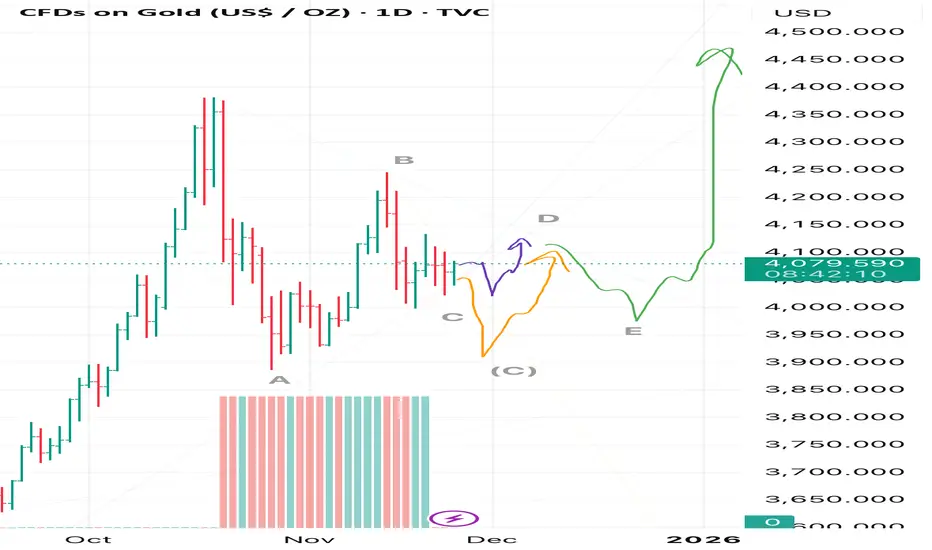
Gold — ABCDE Triangle Formation With Bullish Breakout AheadIn my view, gold is forming a corrective ABCDE triangle with an expected breakout to the upside🚀
At the moment, wave C is either still developing or it is almost completed, and wave D may soon begin. I marked these two scenarios with orange🟠and purple🟣 arrows respectively.
However, I also do not rule out the possibility that this structure may turn out to be a flat ABC correction rather than a triangle, as I currently expect.
In that case, price should first move according to the orange scenario.
After the correction completes, I expect price to follow the green path, taking gold above its recent all-time high🌱
And between us — I personally expect gold to eventually reach above 8000 😱
But for now, let’s patiently wait for this current structure to finish forming.
💬Share your thoughts in the comments:
Do you think wave C is already complete, or will gold dip lower according to the orange path?
I’m curious to hear your view.
$3,600 Gold Incoming? The Accumulation Zone Says It All!Gold has been showing textbook price action. After years of testing, the long-term trendline was finally broken and then flipped into solid support, classic breakout-retest behavior.
Former resistance zones have consistently turned into support on the way up, confirming bullish strength. Now, price is consolidating in a tight range near all-time highs, this is not weakness, it's accumulation.
As long as the structure holds, this looks like a potential launchpad for the next leg higher.
Patience pays in gold; accumulation leads to expansion.
DYOR, NFA
Thanks for Reading!

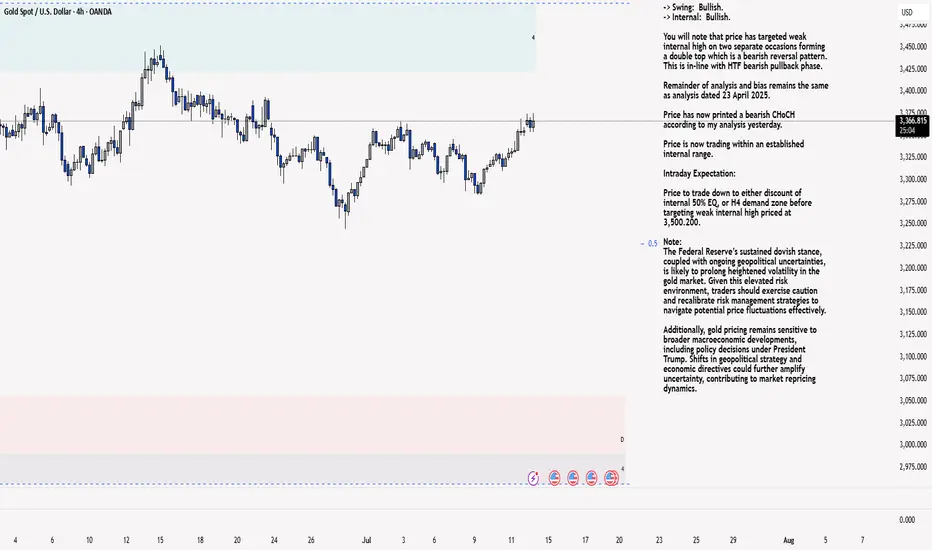
XAU/USD 14 July 2025 Intraday AnalysisH4 Analysis:
-> Swing: Bullish.
-> Internal: Bullish.
You will note that price has targeted weak internal high on two separate occasions forming a double top which is a bearish reversal pattern. This is in-line with HTF bearish pullback phase.
Remainder of analysis and bias remains the same as analysis dated 23 April 2025.
Price has now printed a bearish CHoCH according to my analysis yesterday.
Price is now trading within an established internal range.
Intraday Expectation:
Price to trade down to either discount of internal 50% EQ, or H4 demand zone before targeting weak internal high priced at 3,500.200.
Note:
The Federal Reserve’s sustained dovish stance, coupled with ongoing geopolitical uncertainties, is likely to prolong heightened volatility in the gold market. Given this elevated risk environment, traders should exercise caution and recalibrate risk management strategies to navigate potential price fluctuations effectively.
Additionally, gold pricing remains sensitive to broader macroeconomic developments, including policy decisions under President Trump. Shifts in geopolitical strategy and economic directives could further amplify uncertainty, contributing to market repricing dynamics.
H4 Chart:
M15 Analysis:
-> Swing: Bullish.
-> Internal: Bullish.
H4 Timeframe - Price has failed to target weak internal high, therefore, it would not be unrealistic if price printed a bearish iBOS.
The remainder of my analysis shall remain the same as analysis dated 13 June 2025, apart from target price.
As per my analysis dated 22 May 2025 whereby I mentioned price can be seen to be reacting at discount of 50% EQ on H4 timeframe, therefore, it is a viable alternative that price could potentially print a bullish iBOS on M15 timeframe despite internal structure being bearish.
Price has printed a bullish iBOS followed by a bearish CHoCH, which indicates, but does not confirm, bearish pullback phase initiation. I will however continue to monitor, with respect to depth of pullback.
Intraday Expectation:
Price to continue bearish, react at either M15 supply zone, or discount of 50% internal EQ before targeting weak internal high priced at 3,451.375.
Note:
Gold remains highly volatile amid the Federal Reserve's continued dovish stance, persistent and escalating geopolitical uncertainties. Traders should implement robust risk management strategies and remain vigilant, as price swings may become more pronounced in this elevated volatility environment.
Additionally, President Trump’s recent tariff announcements are expected to further amplify market turbulence, potentially triggering sharp price fluctuations and whipsaws.
M15 Chart:
Gold in correction or long consolidation phaseGold has a pattern of about 74% run. You could break it down to 74/3 as well as I had done in a related post. It could ender into some consolidation for a few months

GLD keeps surging in steps of 21.37% Why this number?Time for Gold to rest pause consolidate after climbing 21.37%. What's with this number? Even the best can't climb Mt Everest in one go. They must rest at every base camp, so must gold

$GLD - GOT GOLD?!AMEX:GLD - GOT GOLD?!
Day/ Week/ Month all breaking out!
- Green H5 Indicator
- Two symmetrical triangle breaking out
- Daily WCB thriving
- Launching off volume shelf
- Safe haven when FUD hits
All pointing to measured move: $268 🎯
Not financial advice

Expired GLD Weekly outlook. 5th WK OCT 2024Expired GLD Weekly outlook. 5th WK OCT 2024
> BULLISH 📈 HIT
Prior Week Closed Price: 253.32
This Week Target Price: 254
Strike Price: 257.71 on OCT 30, 2024
Upper Range: 258.17
Lower Range: 250.97

Gold PTs 2,800€ short term, 3K long termProbably nearing the end of the second bullish impulse that started around 2,300$, PTs 2,800€. Waiting for a turnaround around that area, and a fall to the (2)-(4) line around 2,600$ to then attack the 3K barrier (which I don’t think will pass in the following months).
Just my opinion!

Expired GLD Weekly outlook. 3rd WK AUG 2024Expired GLD Weekly outlook. 3rd WK AUG 2024
> BULLISH 📈 CORRECT
Prior Week Closed Price: 231.99
This Week Target Price: 233.66
Strike Price: 234.01 on AUG 20, 2024
Upper Range: 236.72
Lower Range: 230.59

Expired GLD Weekly outlook. 2nd WK JULY 2024Expired GLD Weekly outlook. 2nd WK JULY 2024
> BULLISH 📈 CORRECT
Closed Price: 220.93
Target Price: 223 | Strike Price: 224.15 on JULY 11, 2024
Upper Range: 226
Lower Range: 221

Expired GLD Weekly outlook. 1st WK MAY 2024Expired GLD Weekly outlook. 1st WK MAY 2024
> NEUTRAL 📊 CORRECT
Closed Price: 216.62
Target Price: 214.14 | Strike Price: 211.50 APR30 24'
Upper Range: 217.38
Lower Range: 210.90

Expired GLD Weekly outlook. 2nd WK DEC 2023Expired GLD Weekly outlook. 2nd WK DEC 2023
> NEUTRAL 📊 CORRECT
Closed Price: 185.64
Target Price: 184 | Strike Price: 183.23 DEC11
Upper Range: 188
Lower Range: 181

Gold quarterly outlookIn analyzing the gold market, I've observed a recurring pattern of ascending triangles over the past three years. Additionally, I've identified a discreet descending channel , a pattern often associated with bullish trends. Anticipating a breakout from the upper boundary of this channel by February 2024, it's noteworthy to consider the potential role of the March 2021 trendline, which may act as support in this possible scenario.

Expired GLD Weekly outlook. 3rd WK SEP 2023Expired GLD Weekly outlook. 3rd WK SEP 2023
> NEUTRAL 📊 CORRECT
Closed Price: 178.34
Target Price: 178.42 | Strike Price: 179.38 SEP18
Upper Range: 183.84
Lower Range: 172.99

Expired GLD Weekly outlook. 2nd WK SEP 2023Expired GLD Weekly outlook. 2nd WK SEP 2023
> NEUTRAL 📊 CORRECT
Closed Price: 178.08
Target Price: 178.48 | Strike Price: 178.59 SEP11
Upper Range: 183.91
Lower Range: 173.05

Expired GLD Weekly outlook. 1st WK SEP 2023Expired GLD Weekly outlook. 1st WK SEP 2023
> NEUTRAL 📊 CORRECT
Closed Price: 180.11
Target Price: 179.67 | Strike Price:178.64 SEP5
Upper Range: 185.15
Lower Range: 174.19

GLD GC1! Gold looks Bullish - Cup and Handle XAUUSDGold Cup and Handle pattern is developing, as banking crisis has just started...
The information and publications are not meant to be, and do not constitute, financial, investment, trading, or other types of advice or recommendations...

XAUUSD GLD GC1! Gold looks Bullish - Cup and HandleGold Cup and Handle pattern is developing, as banking crisis has just started...
The information and publications are not meant to be, and do not constitute, financial, investment, trading, or other types of advice or recommendations...

GLD Running into today's close getting ready for a whale spout soon.
Get your tickets to the show
-stikstockitslive

GLD big LEVELBe careful because this the big level NOW on GLD this will determine where we will go we're still in a bear market until we break up this level !!!

GLD SPDR two bullish breakout patterns in one!W Formation has formed and the price has broken above recently.
We then have a larger Cup and Handle forming, which the price is now completing the Brim Level.
This market is correlating well with Gold and seems to be lagging the current Gold rally. This means, we can expect upside for GLD very soon.
My first target is $174.68
