USDCAD possible fall!USDCAD could be falling today getting into NY session. Waiting for confirmation aa it has been struggling passing the zone it is at.
Gold

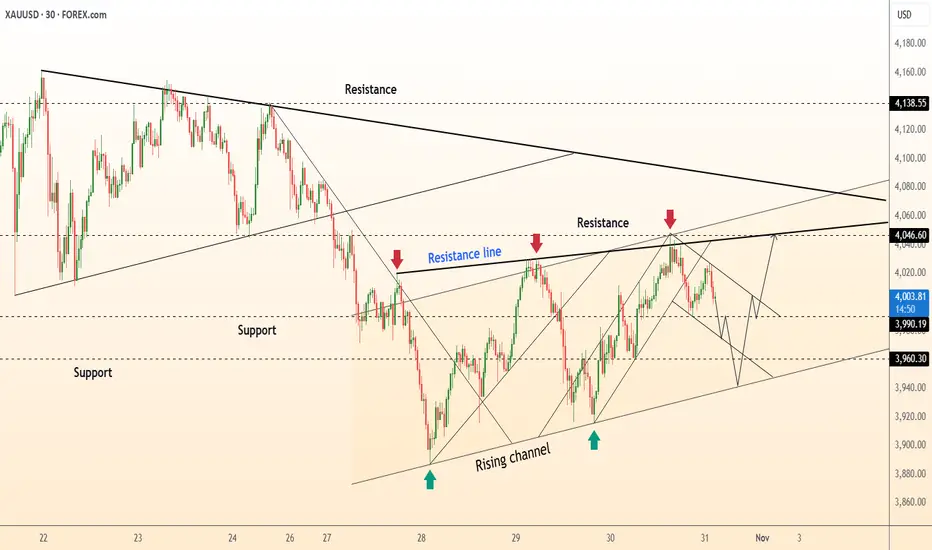
DeGRAM | GOLD is forming a new local ascending structure📊 Technical Analysis
● XAU/USD is forming a rising channel, holding firm above 3,960 support after rejecting from the resistance near 4,046.
● The pattern suggests a continuation of the uptrend as long as price sustains above the channel base, with potential breakout targets toward 4,138.
💡 Fundamental Analysis
● Gold remains supported by a softer dollar and cautious market sentiment ahead of key U.S. employment data, which could further boost safe-haven demand.
✨ Summary
● Long bias above 3,960; targets 4,046–4,138. Rising structure and weaker dollar fundamentals reinforce short-term bullish momentum.
-------------------
Share your opinion in the comments and support the idea with a like. Thanks for your support!
XAUUSD: Market Analysis and Strategy for October 31Gold Technical Analysis:
Daily chart resistance: 4090, support: 3890.
4-hour chart resistance: 4050, support: 3915.
1-hour chart resistance: 4030, support: 3988.
After a double bottom yesterday, gold prices rebounded again, even briefly reaching 4040 today. However, this momentum was short-lived, and prices fell back again during the Asian session. Currently, it's around 4000.
Today is Friday, the end of both the weekly and monthly charts. Various indicators suggest that the gold correction is far from over, so this rebound is merely a small pause in the downtrend and cannot be considered a reversal.
Today's trading strategy is to deal with the market within a range, focusing on support at 3988-3950 and resistance at 4030/4050/4100.
SELL: 4050 near
BUY: 3988 near
Join VIP to get live-time trading guidance

Gold (XAU/USD) Technical AnalysisGold (XAU/USD) Technical Analysis – Potential Rebound Toward Key Resistance Zone
On the 1H timeframe, Gold (XAU/USD) shows signs of a short-term recovery after a period of consolidation near the $4,000 psychological support. Price action has formed a higher low, hinting at potential bullish momentum building up in the short term.
Currently, the market is attempting to recover from the recent dip, and the next upside target lies around the $4,080 – $4,100 resistance zone, where previous supply and structural rejection occurred. This area also aligns with the 38.2% Fibonacci retracement of the recent downward swing, making it a critical level to monitor.
Key Levels to Watch
Resistance: $4,080 – $4,100 (short-term supply zone)
Support: $3,980 – $3,950 (recent swing low area)
Trading Plan
Scenario 1 – Buy on pullback:
If price holds above $3,980 and confirms a higher low, traders may consider buying toward the $4,080–$4,100 zone.
Scenario 2 – Rejection at resistance:
Should price face strong selling pressure at $4,100, it could trigger another correction back toward $3,950. Watch for bearish signals before shorting.
Technical Outlook
Overall, Gold remains in a corrective phase within a broader downtrend. Short-term buyers may drive a recovery toward $4,100 before stronger sellers re-enter the market. A clean breakout above $4,100 could shift intraday sentiment to bullish.

Real Estate vs Gold, Bitcoin, Stock MarketThis chart illustrates relative performance of Real Estate, Stock Market, Gold & Bitcoin through the critical Covid timeline up to recent time

DeGRAM | GOLD formed a rising bottom📊 Technical Analysis
● XAU/USD is trading inside a descending channel, forming a short-term rebound from the support line near 3,945, signaling a potential breakout attempt.
● A move above the 4,025–4,040 resistance zone would confirm a channel break and open the path toward the 4,138 level.
💡 Fundamental Analysis
● Gold finds demand amid geopolitical uncertainty and weaker U.S. Treasury yields, while markets await key inflation data that may limit dollar strength.
✨ Summary
● Long bias above 3,945; target 4,040–4,138. Channel bottom rebound supports a short-term bullish recovery scenario.
-------------------
Share your opinion in the comments and support the idea with a like. Thanks for your support!

Gold is Trading Under The Pressure of a Strong Dollar!!Hey Traders, in today's trading session we are monitoring XAUUSD for a selling opportunity around 4,020 zone, Gold is trading in a downtrend and currently is in a correction phase in which it is approaching the trend at 4,020 support and resistance area.
Trade safe, Joe.

GOLD (XAUUSD): Another Pullback Trade
Gold is testing a major daily resistance that we spotted earlier again today.
It looks like the price may retrace from that one more time.
A bearish breakout of a support line of a rising channel is my
intraday confirmation.
Goal - 3989
❤️Please, support my work with like, thank you!❤️
I am part of Trade Nation's Influencer program and receive a monthly fee for using their TradingView charts in my analysis.

Gold Rebound: Bulls Target 4,130 ResistanceHello, traders, I want share with you my opinion about Gold. Gold has been trading within a broad technical structure, evolving from a strong bullish phase into a corrective descending channel. The previous uptrend was clearly defined by an ascending channel, which guided the price through multiple impulsive rallies and pullbacks. However, after forming a double-top pattern near the 4320 resistance level, buyers began to lose momentum, resulting in a sharp decline. Currently, the price is trading within a well-defined descending channel, where sellers have been maintaining short-term control. After a deep test of the Buyer Zone around 3920, the market has shown early signs of a potential rebound. The asset is now pulling back from this support area and is approaching the resistance line of the descending channel. In my opinion, this upward correction represents a short-term recovery within a larger bearish context. I expect that the price will rally towards the Resistance Level near 4130–4140, where strong selling pressure may reappear. This area is also aligned with the upper boundary of the descending channel, creating a strong confluence zone. A rejection from this resistance line would confirm the continuation of the bearish structure. The next potential move could be a rotation back down towards the Buyer Zone, or even a deeper retest of the Support Line around 3920. My take-profit (TP1) for the corrective rally is placed at 4108, targeting the upper range of the structure before the next potential reversal. Please share this idea with your friends and click Boost 🚀

Stop!Loss|Market View: AUDUSD🙌 Stop!Loss team welcomes you❗️
In this post, we're going to talk about the near-term outlook for the AUDUSD currency pair☝️
Potential trade setup:
🔔Entry level: 0.65191
💰TP: 0.64101
⛔️SL: 0.65706
"Market View" - a brief analysis of trading instruments, covering the most important aspects of the FOREX market.
👇 In the comments 👇 you can type the trading instrument you'd like to analyze, and we'll talk about it in our next posts.
💬 Description: Sell pressure remains particularly strong on the Austrian and New Zealand dollars, with these two pairs expected to see the most significant strengthening of the USD. Currently, there is an open gap near this year's POC level, and a breakout of this level (near short-term support at 0.65230) will likely trigger a downward impulse amid liquidation by buyers (their stop-loss levels).
Thanks for your support 🚀
Profits for all ✅
❗️ Updates on this idea can be found below 👇

Stop!Loss|Market View: USDJPY🙌 Stop!Loss team welcomes you❗️
In this post, we're going to talk about the near-term outlook for the USDJPY currency pair☝️
Potential trade setup:
🔔Entry level: 153.477
💰TP: 155.036
⛔️SL: 152.140
"Market View" - a brief analysis of trading instruments, covering the most important aspects of the FOREX market.
👇 In the comments 👇 you can type the trading instrument you'd like to analyze, and we'll talk about it in our next posts.
💬 Description: The yen continues to accumulate near the 153 resistance area, with a gap in the 148-149 range continuing to attract sellers to open trades. Currently, short-term buy remains the priority, with a breakout of the 153 resistance area toward 154-155 expected.
Thanks for your support 🚀
Profits for all ✅
❗️ Updates on this idea can be found below 👇

Gold Buy at 4080 and sell at 4240Now gold in consolidation mode and trying to book profits and make the retail traders into the trap so for now we need to be patience and buy at 4080 and close at 4240, after the fed interest cut gold will come down so sell at 4240 and wait for long selling till 3966. This method is Wd Gann inspiration i made and am still learning, this one sharing for study purpose so trade with your own analysis.

XAU/USD – Key Decision Point Before the Next Big MoveGold continues to consolidate below the major resistance zone at $4,060–$4,100, after a recovery from the $3,950 area. The market is currently testing an important structure level, and today’s reaction here will determine the next short-term trend.
Technical Outlook (H1 timeframe):
Immediate Resistance: $4,060 – $4,100
Major Resistance: $4,180 – $4,200
Support Zone: $3,950 – $3,900
Key Level to Watch: $4,000
If price breaks and holds above $4,060, bulls may gain momentum toward $4,150 – $4,200, forming a potential short-term continuation pattern.
However, a rejection below $4,060 could trigger another decline toward $3,950, and if that breaks, the next target lies near $3,860.
Trading Strategy:
Bullish Scenario: Wait for a confirmed breakout and retest above $4,060, then target $4,150–$4,200.
Bearish Scenario: Look for rejection signals at $4,060 or a break below $4,000 to sell toward $3,950 and $3,860.
RSI is showing a potential short-term overbought condition, so traders should remain patient and wait for price confirmation before entering.
Stay disciplined—gold is in a key reaction zone, and today’s close could define the next 2–3 sessions.
Follow for more daily gold trading strategies and updates.

Gold Intraday – Oct 31 (No. 1)Starting the day with a clean setup on gold.
Waiting for price to break below 4008 – 4007 zone to confirm short entry.
The structure is showing early weakness after a strong push up yesterday — planning to ride a small intraday drop if it triggers.
Targets are staged near 3980 / 3966 / 3952 (RR 1.0 – 2.0 levels).
Setup remains waiting until breakout is confirmed — no entry yet.
I prefer simple price action over indicators — clean zones, clean risk.
⚠️ Disclaimer: This idea is only my personal market view shared for educational purposes.
It’s not financial advice. Always trade with your own analysis and proper risk management

Gold Futures (MGCZ25) – Monthly Close SetupPrice has ranged all week between 4040 and 3930. With an H4 FVG still sitting above, we might see one last liquidity grab before the next directional move.
⚖️ Neutral bias for now — watching for clean displacement at range extremes.
📍 If price reclaims 4040 → possible push into the H4 FVG.
📍 If it rejects and drops below 4020 → lower FVG fills toward 3930 could be next.
#Gold #Futures #ICT #MarketStructure #NOFOMO

XAUUSD: A Potential Reversal on the HorizonOANDA:XAUUSD The price has been on a steady decline, but there's a shift happening. Sellers have tried to push the price even lower twice, but both attempts were met with strong rejection at nearly the same price level. This is forming a Double Bottom, a classic signal that the downward momentum is losing power.
Now, all focus is on the neckline. A decisive breakout and a close above this level will not only confirm the pattern but could also spark a significant rally toward the 4,135 target.
If this happens, we could be looking at the beginning of a powerful trend reversal. The market is gearing up for a move, and this is where it gets exciting.

GOLD LOCAL SHORT|
✅XAUUSD is tapping into a fresh supply level after an impulsive rally, signaling potential bearish rejection toward the short-term imbalance zone below. Time Frame 2H.
SHORT🔥
✅Like and subscribe to never miss a new idea!✅

GOLD Free Signal! Sell!
Hello,Traders!
GOLD Price has reached a horizontal supply area after a corrective move upward. Bears are likely to step in, targeting the previous low for liquidity.
-------------------
Stop Loss: 4,052$
Take Profit: 3,997$
Entry: 4,027$
Time Frame: 2H
Setup Risk: High
-------------------
Sell!
Comment and subscribe to help us grow!
Check out other forecasts below too!
Disclosure: I am part of Trade Nation's Influencer program and receive a monthly fee for using their TradingView charts in my analysis.

THE KOG REPORT - FOMCTHE KOG REPORT – FOMC
This is our view for FOMC, please do your own research and analysis to make an informed decision on the markets. It is not recommended you try to trade the event if you have less than 6 months trading experience and have a trusted risk strategy in place. The markets are extremely volatile, and these events can cause aggressive swings in price.
We’ve done pretty well this week so we’ll only share the levels and potential path but say that it’s really not worth getting involved in the FOMC move itself. We’d rather wait for them to move the price and then look for a set up to get a trade due to the extreme volatility on gold this month.
Below, we have the support level 3965-75 which needs to hold us up in order for this daily candle to close bullish and attempt to target the higher liquidity regions of 4050 and above that 4095. A break above which is very possible will take us into our area or interest which is around the 4150 region. It’s that region we will want to watch, if approached and we get a reaction, an opportunity to short from there may be available to traders.
Because we’re already in long from the swing, there is no point attempting to short it from here, instead, if we do go downside into the lower levels, we will be looking at the 3840-60 regions for a reaction in price to then attempt the scalp long.
RED BOXES:
Break below 3985 for 3955 and 3938 in extension of the move
Break above 4003 for 4020, 4030 and 4061 in extension of the move
Please do support us by hitting the like button, leaving a comment, and giving us a follow. We’ve been doing this for a long time now providing traders with in-depth free analysis on Gold, so your likes and comments are very much appreciated.
As always, trade safe.
KOG

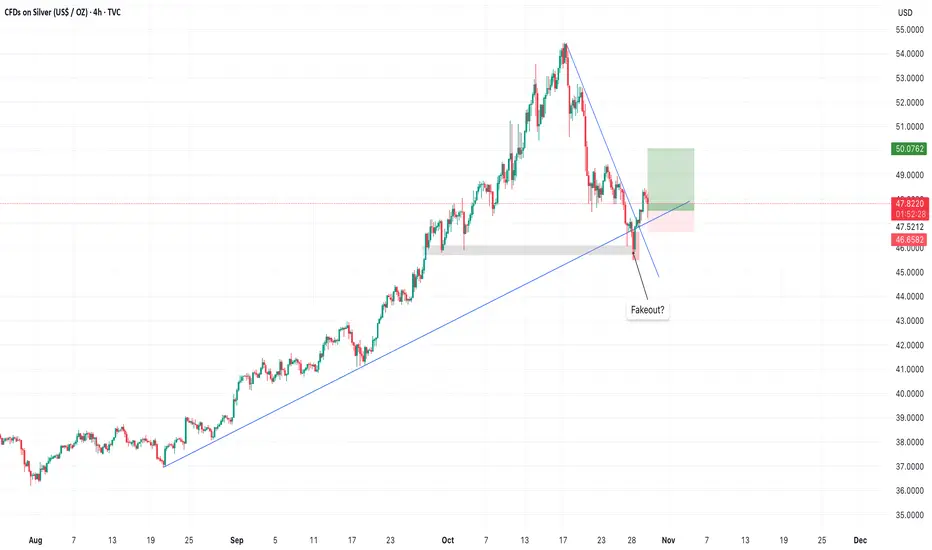
SILVER LongHello traders,
I am sharing my biases for Silver (XAG). My opinion is that we will have a touch to price 50$ at least. The reason why I'm getting long here is because we have a fakeout , and the trendline is holding properly. Also the bullish engulfing on 4H formed yesterday, gives another indication for long.
Silver bull will try to throw you off, but long term healthyA pause that could refresh might be warranted in silver and gold.
I am still optimistic for precious metals long term.
Silver is still undervalued based on historical metrics and money supply.
I worry about the rise in metals and what it implies for the broad stock market indices.

Bullish? Maybe This Will Change Your Mind About ETHHi guys,
This monthly inverse chart should make things clear to you that the market is about to crash hard!
Everyone is so bullish and Microstrategy just announced another BTC purchase which is a huge RED ALERT for all crypto investors.
Stay safe and let me know what do you guys think about this !

GOLD GATHERING MOMENTUM TO RETEST RECENT HIGHA close above (b) will confirm gold's price readiness to rise after creating a HH and HL.
N.B!
- XAUUSD price might not follow the drawn lines . Actual price movements may likely differ from the forecast.
- Let emotions and sentiments work for you
- ALWAYS Use Proper Risk Management In Your Trades
#gold
#xauusd
