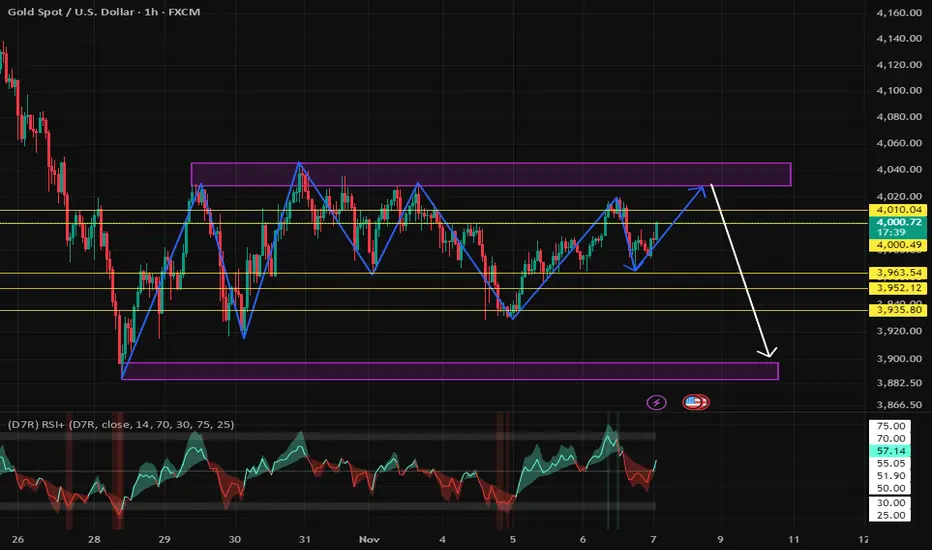
GOLD will rise in the coming weeks.GOLD has a stable week and should be making it's move back up in the next couple of weeks.
Gold

XAUUSD: Market Analysis and Strategy for November 7th.Gold Technical Analysis:
Daily Resistance: 4080, Support: 3890.
4-Hour Resistance: 4035, Support: 3965.
1-Hour Resistance: 4020, Support: 3985.
Technically, the bullish outlook on monthly and weekly charts remains strong, but caution is advised as the market may be accumulating upward momentum during the downtrend. The daily chart shows gold consolidating within a range; watch for a potential slowdown in the moving average system, and the MACD/KDJ indicators may be poised for an upward correction.
Whether the price can recover above 4080/85 is crucial for further bullish moves, while a break below 3880 is key for further bearish moves. A conservative approach would be to wait for a breakout and then follow the trend. Short-term traders can buy low and sell high within this range.
Looking at the 1-hour chart, the moving average support is moving upwards, the Bollinger Bands are narrowing, and the trading range is narrowing. In the short term, focus on the continuation of the upward trend during the European and American sessions, paying particular attention to the resistance zone around 4030, the recent rebound high, and secondarily the upper Bollinger Band at 4015-4020.
Trading Strategy:
BUY: 3970~3960
BUY: 3990~3980
SELL: 4020~4030
More Analysis →

#JX - Bull Market about to resume, massive inv Head & Shoulders.The Canadian venture index
After completing one Inverse Head and Shoulders that made target and overshot into expected resistance.
Has now setup a massive larger inverse head and shoulders that projects to previous all time high's last seen nearly 20 years ago.
The venture index is full of junior miners and commodity companies that have a letter .v Suffix
Once it has done retracing I expect it to attack the neckline for the Big pattern breakout.

XAUUSD — Intraday bullish if 3,996 holds — Targets 4,031 → 4,046Overview
Market printed CHOCH → BOS up intraday. I’ll look for a sell-side sweep into 3,996 (Bullish OB + FVG) and take confirmation longs toward BSL at 4,031 and extension 4,046. I’m not interested in chasing highs; I want liquidity → confirmation.
SMC Map (from your chart)
Buy-side liquidity (targets): 4,031.455, 4,046.774
Supply / Bearish OB: ~4,011
Mitigation zone: Bullish OB + FVG ~3,996.993
HTF Demand / Invalidation floor: 3,952.474
Structure: CHOCH → BOS up (intraday).
Playbook: sweep → BOS → FVG fill → OB entry.
Scenarios (reference levels)
Scenario 1 – Long (preferred)
Entry zone: 3,997–3,999 after a sweep of 3,996 + M5 BOS up and pullback (FVG fill).
SL: below 3,992 or below the M5 BOS swing low.
TP1: 4,011 (supply/OB).
TP2: 4,031 (BSL).
Runner: 4,046 (next BSL).
Management: take partial at TP1, move SL → BE; trail to structure.
Scenario 2 – Defensive short (reaction only)
Entry zone: 4,011–4,013 if price taps supply and prints M5 BOS down.
SL: above 4,016 or above reaction high.
TP1: 4,002 (intra support).
TP2: 3,996 (mitigation zone) → consider flip long if confirmation appears.
Invalidation: H1 close above 4,015 (supply reclaimed).
Notes & Session Timing
Focus on London Killzone; re-assess for NY if 4,011 breaks/holds.
No entries without confirmation (avoid FOMO at highs).
News/catalyst: manage size around data; protect gains into volatility spikes.
Risk
Partial at TP1, SL → BE post-confirmation. Risk per trade ≤ your plan. This is a personal view, not financial advice.

DeGRAM | GOLD fixed above a resistance line📊 Technical Analysis
● XAU/USD broke above the descending resistance line, signaling a potential bullish shift after a period of consolidation. Price action now targets the $4,080–$4,140 resistance zone, with strong support seen near $3,970.
● The breakout aligns with higher lows on intraday candles, suggesting increasing buying momentum as gold approaches the upper boundary of the channel.
💡 Fundamental Analysis
● A softer dollar and expectations of stable U.S. interest rates are supporting gold prices amid renewed safe-haven demand.
✨ Summary
● Support: $3,970. Resistance: $4,080–$4,140. A sustained move above $4,026 could trigger further gains toward $4,138.
-------------------
Share your opinion in the comments and support the idea with a like. Thanks for your support!

Gold Forms Higher Low — Potential Upside Toward Resistance LineHello traders, here’s my current outlook on Gold (XAUUSD). Gold has recently transitioned out of a strong bearish phase, where the price moved inside a descending channel and found significant support near the $3,930–$3,950 Buyer Zone. This support zone has proven to be a key reaction level multiple times, with several fake breakouts followed by strong bullish recoveries — confirming the presence of active buyers. After breaking out of the descending channel, the price began forming a higher-low structure, aligning along the Support Line, suggesting that bullish momentum is gradually returning. However, the market remains capped by the Resistance Line, where several strong rejections occurred, indicating that sellers are still defending higher levels. At the moment, Gold is trading between the Buyer Zone and the $4,020–$4,140 Resistance Zone (Seller Zone). If buyers manage to hold support and form another bullish push from the current levels, we could see an upward move targeting the $4,020 area first, and if momentum continues — a potential retest of the key resistance at $4,140. For now, the structure shows accumulation above strong support, suggesting that buyers still have the advantage. Please share this idea with your friends and click Boost 🚀

Gold 1H – Pullback Expected as USD Softens After Jobless Claims🟡 XAUUSD – Intraday Trading Plan | by Ryan_TitanTrader
📈 Market Context
Gold is trading within a corrective structure today as the U.S. dollar weakens slightly following higher-than-expected Jobless Claims.
Market sentiment remains mixed ahead of upcoming Fed speeches, which could provide clues about December policy expectations.
• A more hawkish tone could trigger a deeper downside move toward unfilled discount zones.
• Conversely, any dovish signals may push gold into a short-term liquidity grab before resuming its corrective trend.
Liquidity remains concentrated near the $4,030 area, where price may tap into resting buy-side liquidity before forming the next bearish leg.
🔎 Technical Analysis (1H / SMC Style)
• Structure: Current bias shows corrective bearish intent following recent ChoCH → BOS sequence on H1.
• Premium Zone: The 4030–4028 region aligns with an unmitigated H1 supply — ideal for continuation shorts.
• Liquidity Sweep: Price may reach 4030 to sweep early breakout buyers before confirming downside continuation.
• Discount Zone: Strong demand sits at 3932–3934, overlapping with previous bullish displacement and unmitigated demand.
🔴 Sell Setup
• Entry: 4030 – 4028
• Stop-Loss: 4040
• Take-Profit Targets: → 3980 → 3964 → 3934 (major demand zone)
🟢 Buy Setup (Countertrend Reaction)
• Entry: 3932 – 3934
• Stop-Loss: 3925
• Take-Profit Targets: → 3964→ 3995 → 4020
(Only valid if liquidity sweep and bullish reaction occur at the demand zone)
⚠️ Risk Management Notes
• Wait for M15 BOS/ChoCH confirmation at both zones to avoid premature entries.
• Avoid trading directly at the minor support around 3964 — it is not a valid SMC entry zone.
• Prioritize the sell setup; intraday bias remains corrective-bearish within a broader range.
• Secure partial profits at the first liquidity target and trail stops according to structure.
✅ Summary
Gold is likely to seek premium liquidity near 4030 before resuming its corrective move lower.
The 4030–4028 supply area offers a clean continuation-short entry, while 3932–3934 remains the strongest discount zone for reactive long setups.
Stay adaptable — the market maintains a mild bearish tone while waiting for further Fed guidance.
FOLLOW RYAN_TITANTRADER for daily SMC setups ⚡

Stop!Loss|Market View: BTCUSD🙌 Stop!Loss team welcomes you❗️
In this post, we're going to talk about the near-term outlook for the BTCUSD ☝️
Potential trade setup:
🔔Entry level: 105019.48
💰TP: 110424.25
⛔️SL: 102201.32
"Market View" - a brief analysis of trading instruments, covering the most important aspects of the FOREX market.
👇 In the comments 👇 you can type the trading instrument you'd like to analyze, and we'll talk about it in our next posts.
💬 Description: The global prospects for a decline to 90000 are lingering, but for now, unless the price pushes toward 100000, the decline will have to wait a bit longer. The most likely scenario now is a price move toward 104000, where a breakout toward 110000 is expected. Near this resistance, not only are technical factors stopping the price but also a accumulation of selling liquidations, so the price will likely drift toward this area in the short-term.
Thanks for your support 🚀
Profits for all ✅
❗️ Updates on this idea can be found below 👇

Stop!Loss|Market View: USDJPY🙌 Stop!Loss team welcomes you❗️
In this post, we're going to talk about the near-term outlook for the USDJPY currency pair☝️
Potential trade setup:
🔔Entry level: 154.304
💰TP: 156.111
⛔️SL: 153.446
"Market View" - a brief analysis of trading instruments, covering the most important aspects of the FOREX market.
👇 In the comments 👇 you can type the trading instrument you'd like to analyze, and we'll talk about it in our next posts.
💬 Description: A second test of the 153.446 support level isn't a good buy signal, and it's best to take aside from buy positions near current levels for now. The most attractive option for buyers remains near the 154.310 resistance level. If the price does reach that level soon, it's highly likely that the price will continue moving toward 155-156 as sellers liquidate their positions.
Thanks for your support 🚀
Profits for all ✅
❗️ Updates on this idea can be found below 👇

First Gold LongMaybe a bit early but I'm entering my first long around here with relatively close stoploss.

The Gold Rush and Washington's Strategic MoveThe US OANDA:XAUUSD and OANDA:XAGUSD markets are experiencing an unprecedented boom, with demand up 58% in the last three months alone, precious metal ETFs attracting over $16 billion. But behind this wave of investment is not just a defensive sentiment against inflation or geopolitical risks, but also a deeper shift in the global resource power structure.
On November 6, the US Department of the Interior unexpectedly added copper, silver and metallurgical coal to its list of “critical minerals,” expanding the strategic scope of supply security. The list, updated every three years by the US Geological Survey (USGS), will serve as the basis for a new round of tariff reviews under Section 232, a legal tool that allows tariffs on national security grounds.
The move was seen by analysts as a clear political signal: Washington is increasingly viewing industrial and precious metals not just as commercial goods, but as strategic assets in global supply chain competition.
A Strategic, Not Just Commercial List
According to the USGS, the definition of “critical minerals” includes materials that are essential to the economy or national security, are vulnerable to supply chain disruptions, and have systemic impacts if they are not available.
Silver, a metal widely used in electronics, solar panels, jewelry, and investments, is the most notable case. Its inclusion on the list has caused market volatility: New York silver stocks hit record levels, while London markets saw short-term shortages. The United States currently relies on imports for nearly two-thirds of its silver needs, mainly from Mexico and Canada.
The addition of silver “is the start of a new policy cycle,” said Suki Cooper, an analyst at Standard Chartered, and if tariffs are imposed, it could reshape the global balance of supply and demand for precious metals. While some silver customs codes have been exempted, the political signals from Washington are enough to trigger a wave of speculation and hoarding.
From Minerals to Geopolitical Power
This is not a one-off change. The US administration, starting with Trump and continuing under Biden, is remaking mineral policy as part of its national security strategy.
From promoting domestic mining, to funding smelting projects, to using financial tools like tax credits and federal loans, Washington is trying to reduce its dependence on imports, especially from China, which now dominates many rare and industrial metals supply chains.
In addition to silver, elements such as lead, silicon, phosphate, uranium and rhenium were also added to the list, reflecting the US vision of a “transitional energy economy”. Meanwhile, elements with the highest risk of supply chain disruption, such as rhodium, gallium, germanium, tungsten and rare earths, remain in the “special priority” category.
The resource power structure is shifting, and the US clearly wants to reshape that order, starting with establishing a “self-reliant mineral ecosystem”.
Gold, silver and investor defense
In this context, the acceleration of the gold and silver markets reflects more than just traditional safe haven sentiment. The 58% surge in precious metals demand in the US shows that capital is shifting from financial assets to physical goods, a manifestation of concerns about the debt cycle, expansionary monetary policy and prolonged geopolitical volatility.
Precious metal ETFs recorded net inflows of $16 billion in the most recent quarter alone, while gold prices continue their relentless bull run. Gold and silver are being repositioned as “strategic assets”, not just temporary shelters.
Long-term impact
The US upgrade of its mineral policy represents a turning point in post-globalization industrial policy: not just to protect productive capacity, but also to create leverage in strategic competition with other economies.
If tariffs and financial support are implemented in a coordinated manner, the metals market could enter a prolonged bull market, with higher volatility and deeper fragmentation in global trade.
In the long run, this is not just a story about gold or silver prices, but about how the US reshapes the physical power base of the 21st century economy.
Technical outlook analysis OANDA:XAUUSD
After a strong rally from July to early October, gold prices have entered a correction and consolidation period around the $3,850–$4,000/ounce range. The daily chart shows a short-term bearish structure within a falling channel, but selling pressure is showing signs of weakening as prices hold above the 0.5 Fibonacci level at $3,846/ounce.
The RSI is moving sideways around the neutral level of 50, indicating that the bearish momentum has slowed down, while the short-term MA21 (around $4,055) is acting as important dynamic resistance. A decisive break above $3,973–$4,000 could be an early signal for a technical recovery towards the $4,120 (0.236 Fibo) range.
Conversely, if the price loses the $3,846 mark, corrective pressure could pull the price to the next support zone at $3,720 (Fibo 0.618), which corresponds to the medium-term bottom of the current price channel.
Overview:
Gold is in a consolidation phase after a long rally, with the range narrowing and awaiting a fresh catalyst from monetary policy or geopolitics. A compression phase before a breakout is likely, with lower risk for buyers if prices continue to hold above the $3,850 area.
SELL XAUUSD PRICE 4021 - 4019⚡️
↠↠ Stop Loss 4025
→Take Profit 1 4013
↨
→Take Profit 2 4007
BUY XAUUSD PRICE 3939 - 3941⚡️
↠↠ Stop Loss 3935
→Take Profit 1 3947
↨
→Take Profit 2 3953

The price action continues to be range-bound.Gold has been trading within a range for eight trading days. On the daily chart, the 10-day and 7-day moving averages are flat, and the RSI indicator is adjusting towards the midline. On the 4-hour and 1-hour charts, the Bollinger Bands are narrowing, with the price hovering around the middle band. Currently, the short-term moving averages are turning downwards, and the MACD indicator is showing a death cross signal, but it's getting closer to the zero line, so a continuation of the sideways movement cannot be ruled out.
The large-scale daily range is locked at 4050-3900. Without breaking out of this range, a clear trend is unlikely. My current view is that a break above 4050 is insufficient for a bullish outlook, while a break below 3900 would indicate a significant decline. Both bulls and bears lack sustained momentum. We have consistently emphasized that gold is currently in a consolidation phase. Don't assume a major bullish surge or trend reversal just because there's a rebound. It's still in a sideways consolidation phase, and the overall center of gravity is still shifting downwards! The trading strategy is to buy low and sell high!
Key Levels:
First Support: 3963, Second Support: 3952, Third Support: 3936
First Resistance: 4000, Second Resistance: 4010, Third Resistance: 4028
Gold Trading Strategy:
Buy: 3960-3965, SL: 3950, TP: 3980-3990;
Sell: 4035-4040, SL: 4050, TP: 4020-4010;
More Analysis →
BTC to Gold Cracking Lower! CAUTION!This could end up turning into a significant crack! for BTC relative to Gold. We have a fight on our hands between Speculation (BTC) and a Safe asset (Gold)
For over 4 years, speculation has not been able to outperform safety, and it is now starting to break lower.
CAUTION! is in order!
Click boost, follow, for more authentic, no BS, raw analysis. Let's get to 5,000 followers. ))

STAY IN THE WAVE TO CATCH THE WAVE - THE ART OF RANGE MANAGEMENTHey Everyone,
Here at GVFX, we are currently buying dips. What that means is that we buy on the dips and therefore only concentrate on long positions/buys. As mentioned before, having both sell and buy positions open in your account will affect your psychology and in turn, your trading decisions.
Now a question that typically arises here is why would it still be advisable to buy when the market is pushing down? Firstly, let me assure you that the same algorithms, experience and strategies that we use with our bullish directional bias also gives us the heads up, or down if you will, on when the market is going down. Don't think for a moment that we only know how to analyse a bull market or up trends. We share trade ideas for both Bullish and Bearish moves but choose not to hedge out of choice.
In my experience, it is much safer to get out of a stuck buy position than a stuck sell position. That's not to mention the clean PSYCHOLOGICAL PROFILE that is achieved when trading in just one direction. And although hedging can in theory work, it requires years of experience and in the end, is simply not worth the effort and psychological stress.
Let us look at an example of the current short/mid term trend to further highlight this point. When you have short-term bearish momentum down, we take buys from key supports or MAs which act as dips. Remember that the market does not go up or down in a straight line (with the rare exception of short-lived parabolic moves). So, when the market is going down and hits one of our key levels, a buy from that point will go back up for 30 to 40 pips (this number of pips has been calibrated based on back testing) before resuming back down.
You can think of it like this. The market moves in a zigzag manner. The zig is that part of the leg which is going down to create lower lows (if the downward trend is continuing). The zag is that part of the leg which takes a breather and pushes back up with momentum for our entry and quick pip-take range to create a lower high (if the downward trend is continuing) before heading back down again. We catch the right and safest waves (buys) in and out and surf to success. When price hits a key structural support or stops creating lower lows and lower highs, we then reassess for entries with a wider range of pip capture.
Hope this post helps our followers to understand how we ride waves by staying committed to one direction in order to always fall naturally into the wave rather then chasing a wave!!
GoldViewFX

LONG ON GOLD XAU/USDGold has swept sell side liquidity and has given us a choc (change or character) to the upside.
There is tons of buyside liquidity to the upside with huge FVG's (Fair value gaps) and equal highs (double top) that need to be mitigated.
I am buying gold looking to catch over 200-300 points.
That's 2000-3000 pips.

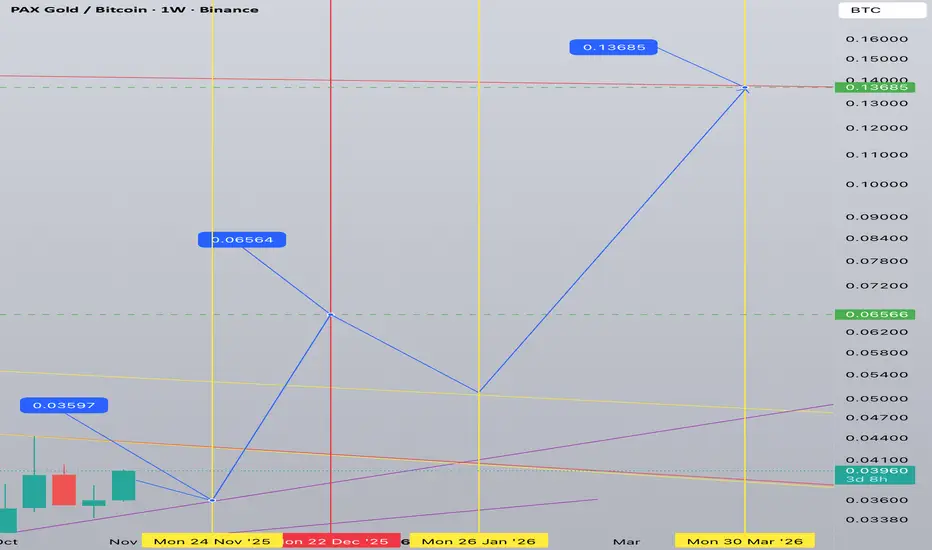
PAXG/BTC (Gold vs Bitcoin) 1W tf till March 2026Indeed BTC is in bear trend vs Gold until the end of March 2026. Gold will appreciate and this means falling crypto market in general.
Currently we are on the brink of a short correction - gold will go down/sideways in BTC terms.
After the correction we will see a rapid appreciation of gold vs bitcoin with one more correction between end of December 2025 and end of January 2026.
End of March 2026 will show us local top of PAXG/BTC.
XAU/USD) Bullish trend analysis Read The captionSMC Trading point update
Technical analysis of Gold (XAU/USD) — expecting a retracement into a demand/Fibonacci zone before a continuation to the upside toward the target at 4,030.68.
Here’s the detailed breakdown
---
Overall Idea
The analysis suggests a pullback-entry buy scenario, where Gold is expected to retrace to a key Fibonacci confluence + trendline support zone, then resume the uptrend toward 4,030.
This setup fits the Smart Money Concept (SMC) and market structure shift logic — from bearish to bullish.
---
Key Components
1. Market Structure Shift
Price broke above the descending trendline, signaling a potential bullish reversal.
The pullback is seen as a retest of the breakout zone, which often becomes a new support area.
The overall expectation is for a higher-low formation, leading to continuation upward.
2. Fibonacci Retracement Zone
The 0.5–0.79 retracement area (highlighted blue box) is the ideal buy zone.
Price is expected to tap into this area before continuing higher.
The 0.705 Fibonacci level aligns with the previous structure and EMAs, adding confluence.
3. EMA Confluence
50 EMA (3,986.37) and 200 EMA (4,007.71) are key dynamic levels.
Price is retesting around the 50 EMA, which supports the idea of a bullish continuation if respected.
Once price breaks above the 200 EMA, momentum confirmation strengthens.
4. Projected Path
The expected pattern:
➤ Pullback into 0.62–0.79 zone →
➤ Formation of a higher low →
➤ Impulsive move toward 4,030.68 target point.
The projected move aligns with structure and Fibonacci extension.
Mr SMC Trading point
---
Summary
Market bias: Bullish
Setup type: Retracement buy / Trend continuation
Entry zone: 3,975–3,985 (Fibonacci 0.62–0.79 area)
Target point: 4,030.68
Confirmation: Bullish rejection from zone or structure break above 4,000
Invalidation: Break below 3,960 (previous swing low)
---
pelas support boost 🚀 this analysis

XAU/USD) Bullish trend analysis Read The captionSMC Trading point update
Technical analysis of Gold (XAU/USD) on the 1-hour timeframe, with a clean structure suggesting continuation toward the 200 EMA. Here's the idea summary:
---
Analysis Idea: Bullish Continuation Setup
1. Structure Overview:
Price is currently trading above the ascending trendline, showing a short-term bullish bias.
The 50 EMA (3,974.93) has recently been retested and held as support.
The 200 EMA (4,011.37) acts as the next resistance / target point.
2. Setup Logic:
After a breakout above the 50 EMA, price is forming a retest zone (highlighted box).
A bullish reaction from this zone aligns with the trendline confluence and EMA support.
This suggests buyers may step in again to push price higher.
3. Entry & Target:
Entry Zone: Near 3,974–3,978 (trendline + EMA confluence area).
Target: 4,011 (200 EMA / key resistance).
Stop Loss: Below 3,965 (below the trendline and retest box).
4. Market Psychology:
Recent candles show higher lows and strong bullish momentum after rejection from previous lows.
Break and retest of dynamic resistance (50 EMA) supports bullish continuation.
Mr SMC Trading point
---
Trade Idea Summary:
Bias Entry Zone Stop Loss Target Confirmation
Bullish 3,974–3,978 <3,965 4,011 Bounce from trendline or bullish candle pattern
---
Pelas support boost 🚀 this analysis

GOLD Local Short! Sell!
Hello,Traders!
GOLD tapped into a premium supply zone, engineering liquidity above equal highs before showing bearish displacement. Expect a continuation move toward the downside imbalance. Time Frame 5H.
Sell!
Comment and subscribe to help us grow!
Check out other forecasts below too!
Disclosure: I am part of Trade Nation's Influencer program and receive a monthly fee for using their TradingView charts in my analysis.

XAUUSD: Market Analysis and Strategy for November 6th.Gold Technical Analysis:
Daily Resistance: 4080, Support: 3890.
4-Hour Resistance: 4035, Support: 3965.
1-Hour Resistance: 4025, Support: 3985.
Gold saw a strong rally in the London market, reflecting recent market volatility characterized by rollercoaster-like movements with large and rapid swings. This is typical of range-bound trading. After a rapid rise, a new plunge may follow. Avoid chasing highs after a sharp rise and avoid selling lows after a sharp fall in a range-bound market! Currently, without any major news catalysts, gold is expected to continue its range-bound movement. Focus on the short-term support/resistance level and look for a rebound to the 4030-4045 range, waiting for a pullback before buying opportunities.
BUY: 3985~3990

GOLD (XAUUSD): Deep Consolidation
This week is very slow for Gold.
The market is stuck within a wide horizontal range on a daily time frame.
With the absence of high impact US fundamentals, I think that probabilities will be high that the market will keep consolidating.
The best strategy to follow for now is to look for trading opportunities from the boundaries of the underlined parallel channel: selling from the resistance and buying from the support after a confirmation.
As the price is closer and closer to the resistance, wait for its test and then look for selling.
That is the plan so far.
❤️Please, support my work with like, thank you!❤️
I am part of Trade Nation's Influencer program and receive a monthly fee for using their TradingView charts in my analysis.

XAUUSD $4025 RESISTANCE NEXT?This chart displays the price action of **Gold Spot / U.S. Dollar (XAU/USD)** on an **Hourly (1h)** timeframe.
## 📈 Technical Analysis: XAU/USD
The price has been in a **consolidative or choppy phase** following a significant prior downtrend, primarily trading within a larger range defined by a **Support zone** around the **\$3,918 - \$3,925** area and a **Resistance zone** near **\$4,020 - \$4,030**.
Within this range, price action appears to have formed a **Descending Channel** (indicated by the dashed lines), suggesting a short-term bearish bias or continued correction within the broader consolidation. However, more recently, the price has broken out of the upper boundary of this descending channel.
Following the channel breakout, the price has entered a **tight, upward-sloping consolidation**, possibly forming a small **bullish flag or pennant pattern** (indicated by the solid, inner trendlines). The current candle is breaking above the upper trendline of this smaller pattern, suggesting a potential continuation move to the upside.
---
## 🎯 Price Projection
Given the breakout from both the descending channel and the smaller bullish consolidation pattern, the immediate projection is **bullish**. The target for this move is the test of the main **Resistance zone** established at **\$4,020 - \$4,030**.
* **Potential Target:** The analysis highlights a specific target around **\$4,040.5**, which represents a **1.17%** move from a breakout point and aligns with the upper boundary of the key resistance zone.
* **Validation:** Continued strength and sustained trading above the breakout level (around **\$3,980**) would reinforce this bullish projection.
* **Invalidation:** A decisive move back below the current consolidation area and the upper line of the descending channel (roughly below **\$3,960 - \$3,970**) would invalidate the immediate bullish bias and suggest a return to the broader ranging behavior or a retest of the support zone.
The overall context remains range-bound, meaning a successful test of the $\mathbf{\$4,020}$ $\mathbf{-}$ $\mathbf{\$4,030}$ **Resistance** could lead to another move back down unless there is a strong, sustained breakout above it.
Would you like me to search for fundamental news that might be impacting the price of Gold right now?

GOLD BEARS ARE STRONG HERE|SHORT
GOLD SIGNAL
Trade Direction: short
Entry Level: 4,007.34
Target Level: 3,924.43
Stop Loss: 4,062.61
RISK PROFILE
Risk level: medium
Suggested risk: 1%
Timeframe: 4h
Disclosure: I am part of Trade Nation's Influencer program and receive a monthly fee for using their TradingView charts in my analysis.
✅LIKE AND COMMENT MY IDEAS✅
