Bullish potential detected for BGLEntry conditions:
(i) higher share price for ASX:BGL along with swing up of indicators such as DMI/RSI.
Depending on risk tolerance, the stop loss for the trade would be:
(i) below the long-term support level of $0.98 (from the open of 7th January), or
(ii) below the rising 30 day moving average (currently $0.94).
Gold

Gold Eyes 4,010 Support Ahead of CPI – Big Move Loading?Hey Traders,
In tomorrow’s trading session, we’re monitoring XAUUSD for a potential buying opportunity around the 4,010 zone. Gold remains in a broader uptrend and is currently in a correction phase, approaching a key support and resistance confluence around 4,010 that aligns with the ascending trendline.
Market Focus:
All eyes are on tomorrow’s U.S. CPI release, with expectations for headline inflation at 3.0% and core at 3.1%. A softer-than-expected print could weigh on the U.S. Dollar, potentially igniting fresh momentum for GOLD to resume its bullish trend.
Next Move:
Watching price action around 4,010 closely — if CPI data confirms disinflation, we could see a strong rebound toward recent highs as safe-haven demand strengthens.
💬 What’s your take on the CPI? Are you positioning long or waiting for confirmation? Drop your thoughts below!
Trade safe,
Joe

GOLD: Short Signal with Entry/SL/TP
GOLD
- Classic bearish setup
- Our team expects bearish continuation
SUGGESTED TRADE:
Swing Trade
Short GOLD
Entry Point - 4129.1
Stop Loss - 4142.0
Take Profit - 4102.9
Our Risk - 1%
Start protection of your profits from lower levels
Disclosure: I am part of Trade Nation's Influencer program and receive a monthly fee for using their TradingView charts in my analysis.
❤️ Please, support our work with like & comment! ❤️

GBP/USD Market Outlook 4 HR TFThe British Pound is currently trading near its 4th August weekly low, a key technical support level that has historically attracted strong buying interest. Price action suggests that the pair may be forming a potential base in this area, with upside targets extending toward the 1.35 level if bullish momentum follows through.
From a technical perspective, the current consolidation near support indicates that buyers may be positioning for a rebound. A sustained move above interim resistance zones—around 1.29, 1.31, and 1.33—would strengthen the bullish outlook and open the path toward 1.35. Confirmation through momentum indicators such as RSI or MACD would further validate this scenario.
On the fundamental side, market sentiment remains closely tied to developments regarding potential UK–US Free Trade Agreement (FTA) discussions. Investors appear to be awaiting official confirmation or commentary from former President Trump concerning trade negotiations. Any positive announcement could provide significant tailwinds for the Pound, while uncertainty or delays may limit upside potential in the near term.
In summary, GBP/USD is positioned at a critical juncture. Technical support aligns with potential fundamental catalysts, suggesting that a confirmed FTA or broader risk-on sentiment could drive the pair higher toward 1.35 in the coming sessions.

GOLD WEEKLY CHART MID/LONG TERM ROUTE MAPHey everyone,
Please check out our updated Weekly Chart Route Map, featuring updated revised key levels after completion of our last long term weekly chart idea for precise level-to-level tracking.
We’ve refreshed our long-term structure on the weekly chart. Price action recently rejected the 4294 level and is now range-bound between 4284 (resistance) and 4059 (support). This consolidation aligns with a detachment from the EMA5, highlighted on the chart with a circle. Even if a full detachment doesn’t materialize, a partial (halfway) correction remains the more probable scenario.
To determine the next directional move, we’ll need a decisive test and break of either boundary level. On the broader horizon, 3006 stands as the long-range pivotal swing zone, which may come into play if a major correction unfolds.
🔹 Note: The key distinction between a retracement range and a swing range is that swing ranges typically produce larger bounces and wider price reactions compared to standard retracement ranges.
We’ll continue to update this outlook throughout the week as the structure develops. Thank you all for your likes, comments and follows, we really appreciate it!
Mr Gold
GoldViewFX

XAUUSD remains stable at high levels, focus on what comes nextHey everyone, Erik here.
XAUUSD has been showing strong momentum lately. After a sharp decline, the market quickly recovered, rebounding powerfully from the lower boundary of the newly projected channel. What initially appeared as weakness was actually a calculated shakeout, trapping sellers before reversing upward with confidence.
This behavior is typical of strong bullish trends. It clears out weak positions, triggers stop losses, and restores balance before the next upward movement. At this stage, the market appears to be entering the early phase of a new bullish impulse.
There might be a short consolidation or a slight correction, but the momentum is clearly pointing toward the upper boundary of the channel. For XAUUSD, the bullish continuation scenario seems far more convincing.
My target is around 4,585, near the upper resistance zone of the projected channel. The overall market structure remains decisively bullish, and the emotional surge during the last drop may become the fuel that powers the next strong rally.

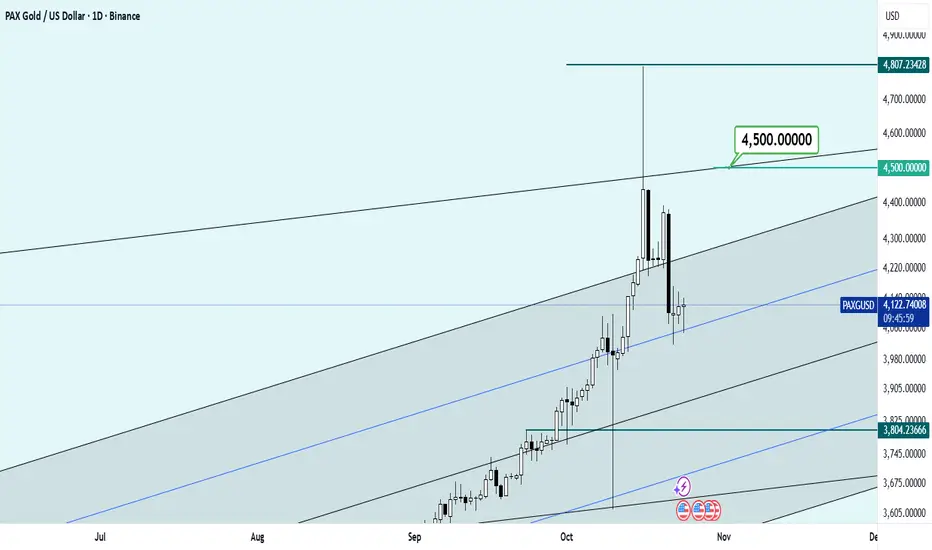
We should test gold with a price target of $4,800!!!This is an empirical test and forward and backtests on the gold chart have confirmed this to some extent, but the timing of the events remains a vague issue. In the end, I must say that I envision a range of $4,800 for the global gold price!
Good luck...
XAU/USD | Gold’s Historic Dump – Will $4,000 Hold or Break?By analyzing the Gold chart on the 2-hour timeframe , we can see that gold experienced an extremely sharp sell-off — the biggest single-day drop in over 12 years — falling nearly $400 in less than 24 hours!
After dropping from $4,381 to $4,003 , price rebounded to $4,162, but then corrected again and is now trading around $4,051.
Given the current volatility, it’s important to watch key levels closely. As long as gold holds above $4,000, there’s potential for a recovery toward the FVG zone between $4,100 and $4,128 .
The main supply levels to monitor are $4,101, $4,114, $4,128, and $4,155 — watch how price reacts at these points!
Please support me with your likes and comments to motivate me to share more analysis with you and share your opinion about the possible trend of this chart with me !
Best Regards , Arman Shaban

Could Gold Recover After Yesterday's CrashGold saw its biggest single-day drop since the infamous 2013 crash. Back then, I was inexperienced, but with some luck and perhaps a bit of reckless bravery, I managed to secure a tidy profit. Unfortunately, my more experienced self missed most of yesterday’s move :)
Now that gold has reached the double-top target near 4000, a short-term bounce could be on the way. However, volatility remains high, making gold a risky trade at the moment.
My plan is to enter around current levels, targeting a recovery toward the 61.8% retracement of the recent drop. It’s a calculated gamble, but the risk-reward ratio looks acceptable, at least for me.

Possible Gold Long SetupIf gold falls to around 4065–4070, it could present a buying opportunity. My target is 4122, but the 4094 level is an intermediate resistance that could disrupt this setup.
A breakout above 4094 might act as a buy signal, though I would avoid entering there due to the unfavorable risk-reward ratio.

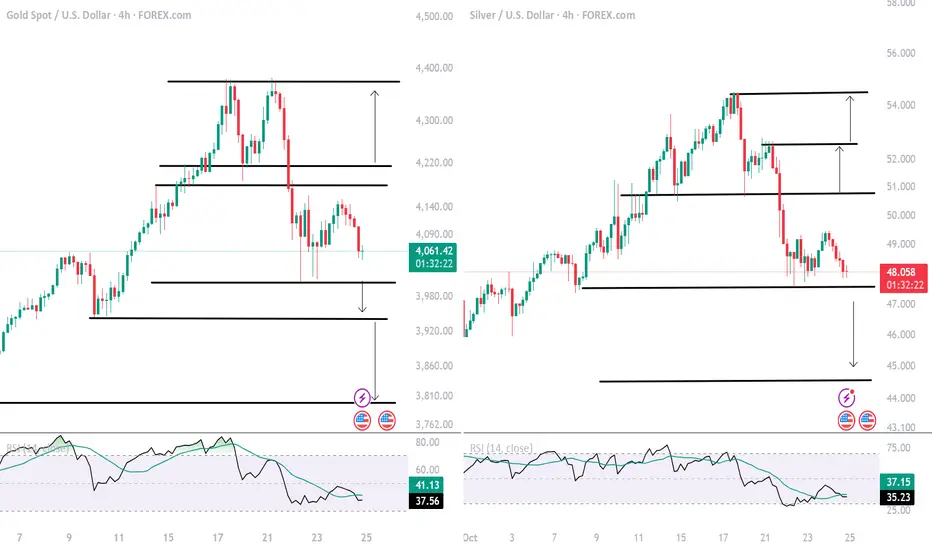
Gold, Silver Outlook: Haven Sentiment, Reversal Patterns on HoldFollowing the heated headlines on gold and silver — driving long lines outside jewelry stores and fueling intense media coverage and momentum — a contrarian signal has emerged. This signal was confirmed by classic reversal patterns, triggering the 300+ point selloff we witnessed this week.
Gold Outlook:
On the 4-hour chart, gold prices have formed a double-top pattern near the $4,380 peak, pulling back toward $4,000 support — a level that now defines two potential scenarios:
A sustained move below $4,000 — the double-top target and key support — could trigger another 300-point decline, with the next support zones around $3,920 and $3,780.
As price action remains above the target but below the neckline, the bearish bias persists. A clean break above $4,200–$4,240 would be required to reignite upside momentum toward $4,300–$4,380, after which new record highs could extend toward $4,900–$5,000.
Silver Outlook
On the 4-hour chart, silver has traced a head and shoulders reversal pattern, targeting the $47.30 level. If prices close back above the neckline at $50.80, gains may resume toward record levels, with key targets at $52.40, $54.40, and $56.60. Holding below $47 could extend losses toward $44.40 and $42.90, aligning with the trendline connecting consecutive higher highs between January 2023 and October 2024, setting up a potential bullish rebound.
- Razan Hilal, CMT
XAUUSD: Watch for Breakout +70$ Move Timeframe: 1H
Gold is consolidating between 4055 support and 4126 resistance.
A breakout on either side could trigger a $70 move.
Bullish Bias: Break and hold above 4126 → next target 4200 area.
Bearish Bias: Break and close below 4055 → continuation toward 3950 zone.
Invalidation:
If price re-enters the range after breakout, bias becomes invalid.
📊 Overall momentum still favors bears, as lower highs and strong rejections from 4120–4130 keep pressure downward.

GOLD Is Bearish! Short!
Here is our detailed technical review for GOLD.
Time Frame: 45m
Current Trend: Bearish
Sentiment: Overbought (based on 7-period RSI)
Forecast: Bearish
The market is on a crucial zone of supply 4,058.20.
The above-mentioned technicals clearly indicate the dominance of sellers on the market. I recommend shorting the instrument, aiming at 3,995.15 level.
P.S
The term oversold refers to a condition where an asset has traded lower in price and has the potential for a price bounce.
Overbought refers to market scenarios where the instrument is traded considerably higher than its fair value. Overvaluation is caused by market sentiments when there is positive news.
Like and subscribe and comment my ideas if you enjoy them!

Gold at pivotal support ahead of US CPI data The Gold remains in a bullish trend, with recent price action showing signs of a corrective pullback within the broader uptrend.
Support Zone: 4010 – a key level from previous consolidation. Price is currently testing or approaching this level.
A bullish rebound from 4010 would confirm ongoing upside momentum, with potential targets at:
4215 – initial resistance
4270 – psychological and structural level
4315 – extended resistance on the longer-term chart
Bearish Scenario:
A confirmed break and daily close below 4010 would weaken the bullish outlook and suggest deeper downside risk toward:
3985 – minor support
3955– stronger support and potential demand zone
Outlook:
A bullish bias remains intact while the Gold holds above 4010. A sustained break below this level could shift momentum to the downside in the short term.
This communication is for informational purposes only and should not be viewed as any form of recommendation as to a particular course of action or as investment advice. It is not intended as an offer or solicitation for the purchase or sale of any financial instrument or as an official confirmation of any transaction. Opinions, estimates and assumptions expressed herein are made as of the date of this communication and are subject to change without notice. This communication has been prepared based upon information, including market prices, data and other information, believed to be reliable; however, Trade Nation does not warrant its completeness or accuracy. All market prices and market data contained in or attached to this communication are indicative and subject to change without notice.

GOLD BEARISH BIAS RIGHT NOW| SHORT
GOLD SIGNAL
Trade Direction: short
Entry Level: 4,250.59
Target Level: 4,039.91
Stop Loss: 4,389.04
RISK PROFILE
Risk level: medium
Suggested risk: 1%
Timeframe: 12h
Disclosure: I am part of Trade Nation's Influencer program and receive a monthly fee for using their TradingView charts in my analysis.
✅LIKE AND COMMENT MY IDEAS✅

Gold 4-hour timeframe analysisHi traders
In the 4-hour gold structure, following the break below the balance zone’s low, we can consider the entry of 4-hour sellers. The pullback zones for these sellers are at 4067 and 4090. The defined take-profit level for this time frame is 3773. As long as this balance remains intact (i.e., no 4-hour candle closes above the zone), the mentioned target will remain valid

XAUUSD: Market Analysis and Strategy for October 24thGold Technical Analysis
Daily Resistance: 4380, Support: 4000
4-Hour Resistance: 4165, Support: 4015
1-Hour Resistance: 4105, Support: 4015
On the 1-hour chart, the candlestick pattern forms a short-term rounded top, with the moving averages moving in a downward trend. Watch for the continuation of the decline in the European and American markets. Short-term upward resistance is at 4165, followed by 4200, the short-term bull-bear boundary. The overall rebound momentum for gold prices is limited, so the impact of the NY CPI data will be closely monitored.
After plummeting on Tuesday and Wednesday, gold prices rebounded yesterday, but the strength was modest, failing to break through Wednesday's high of 4160, let alone return to 4185 or even 4200.
Since the rebound was weak and consolidating at a low level, a new round of decline is likely brewing, likely below 4000. After all, this correction is at the daily level and will not end so quickly.
Yesterday, I said a return to around 3800 would be a reasonable level, representing the 50% and 61.8% golden ratios of the rally from around 3311 in mid-August. While this target may seem distant, judging by the pace of decline at the beginning of the week, it might only take two days.
In today's NY market, we will continue to sell on rallies.
Trading Strategy:
SELL: 4105near
SELL: 4145near
More Analysis →

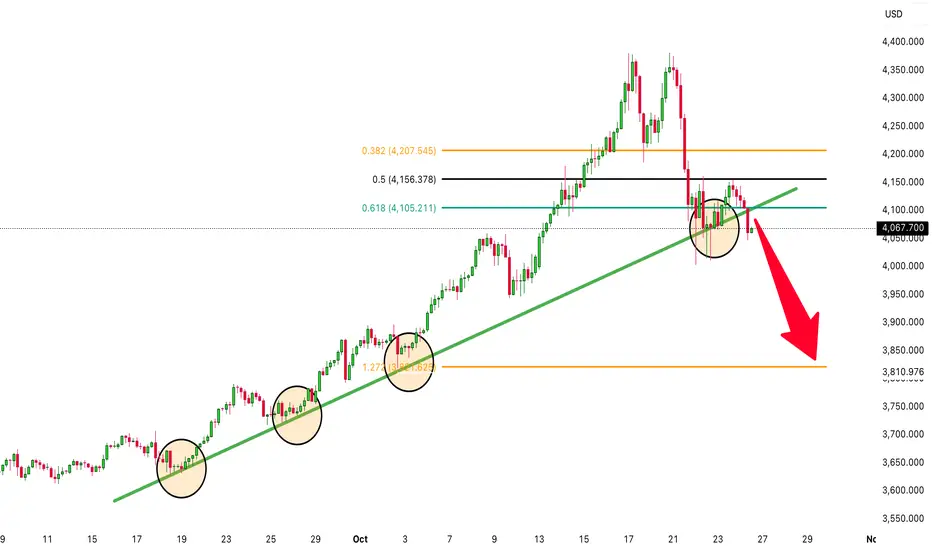
Time for GOLD To DROP! (XAUUSD is heading to the downside!)For many weeks gold (XAUUSD) has been sky rocketing to the upside, however there have been many new signals indicating that it could be a bearish move to the downside. Nothing keeps going up forever! Gold has broken major support levels including the trendline that has been holding it up for weeks. It has also been struggling to break above the fibonacci level of 0.50! Time to sell!
Gold (XAU/USD) Analysis – October 24, 2025Gold (XAU/USD) Analysis – October 24, 2025: Short-Term Retracement Before Another Drop?
Gold continues to move within a corrective structure after rejecting the upper Fibonacci zone around $4,280 – $4,300, showing signs of lower highs and declining momentum on the H1 chart. The recent price action suggests that buyers are losing strength, and the market might be preparing for another leg down.
On the technical side, price is currently hovering near $4,070, after forming a short-term base pattern. If this pullback extends higher, the area around $4,160 – $4,200 will likely act as a strong resistance zone — a potential region for sellers to step in.
Conversely, a clear rejection here could open the way for a deeper move toward the $4,000 – $3,980 support area, completing the projected harmonic swing.
Key levels to watch:
Resistance: $4,160 – $4,200
Support: $4,000 – $3,980
Fibonacci zone: 61.8% retracement aligns with $4,190
EMA trend: Price remains below EMA50, confirming short-term bearish bias
Trading strategy:
Wait for a retracement to the $4,160 – $4,200 zone to look for short setups with confirmation (bearish candle or RSI divergence). Target $4,000 area for potential take profit, with stops above $4,230.
Intraday traders may also scalp minor pullbacks as long as price stays below $4,200.
The overall structure remains bearish unless gold breaks and closes above $4,230, which would invalidate the current downside scenario.
Remember — patience is key in this consolidation phase. Wait for clear signals before entering.
If you find this analysis helpful, follow to get daily gold trading insights and strategies.

( Gold Protocol ) Bearish Reversal DetectedStatus: Active Reversal Protocol
🆚Symbol: Gold
Session: London–New York Overlap (Smart Exit Window)
Bearish Reversal : 4085
☄️ Volume Surge Confirmed — Sellers dominate exhausted highs
☄️ Session Aligned — Smart money exit window open
☄️ Cluster Shield Active — Supply imbalance verified
☄️ Delta Shift Negative — Buyers trapped above
☄️ POC Retest Completed — Liquidity absorbed at resistance
☄️ Structure Break Pending — Bearish bias confirmed
🚀 Logic: This is engineered reversal, not prediction.
🚀 Objective: Controlled execution with minimal drawdown.
Goal: Controlled Both Sides with minimal drawdown
★★★★★ (Smart Money Aligned)
⤵️ Every like & comment on our Trading View posts helps us grow. More engagement means more exposure ★★★★★ , which benefits everyone in the community!

DeGRAM | GOLD is continuing to decline📊 Technical Analysis
● XAU/USD is trading within a descending channel after a double-top rejection near 4,360, with momentum now pressing below 4,106 resistance.
● Consecutive lower highs and breakdown retests suggest continuation toward 4,015 and possibly 3,953 as bears maintain control.
💡 Fundamental Analysis
● Gold weakens as U.S. Treasury yields rebound and market sentiment shifts to risk-on, reducing demand for safe-haven assets.
✨ Summary
● Short bias below 4,106; targets 4,015–3,953. Technical and macro pressure align for extended downside in the medium term.
-------------------
Share your opinion in the comments and support the idea with a like. Thanks for your support!

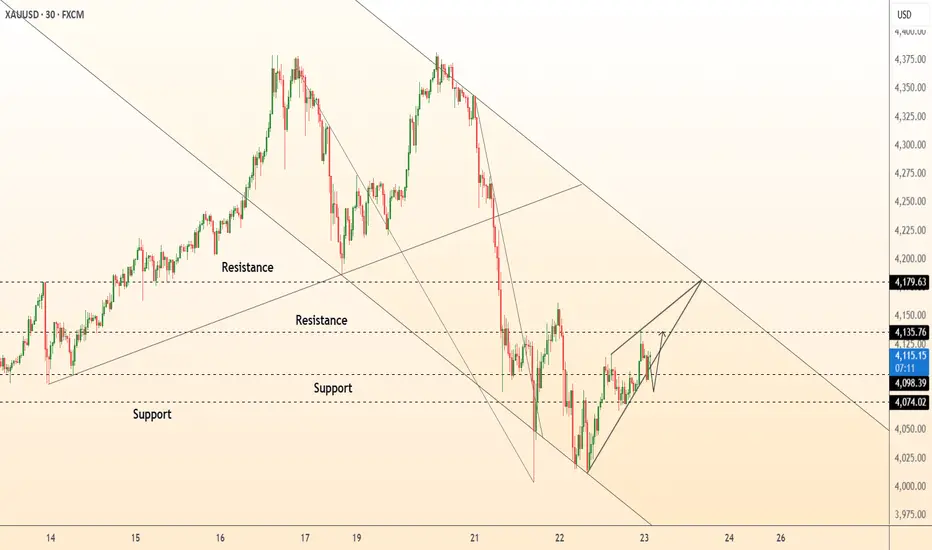
DeGRAM | GOLD rebounded in a descending channel📊 Technical Analysis
● XAU/USD is consolidating between 4,074 and 4,179, forming a short-term ascending structure within a broader descending channel.
● Price action suggests a potential breakout attempt above 4,135 toward 4,179, supported by higher lows and tightening range momentum.
💡 Fundamental Analysis
● Gold gains traction as traders anticipate weaker U.S. PMI data, which could limit dollar strength and revive demand for safe-haven assets.
✨ Summary
● Long bias above 4,100; targets 4,179. Technical compression and macro softness support short-term bullish continuation.
-------------------
Share your opinion in the comments and support the idea with a like. Thanks for your support!
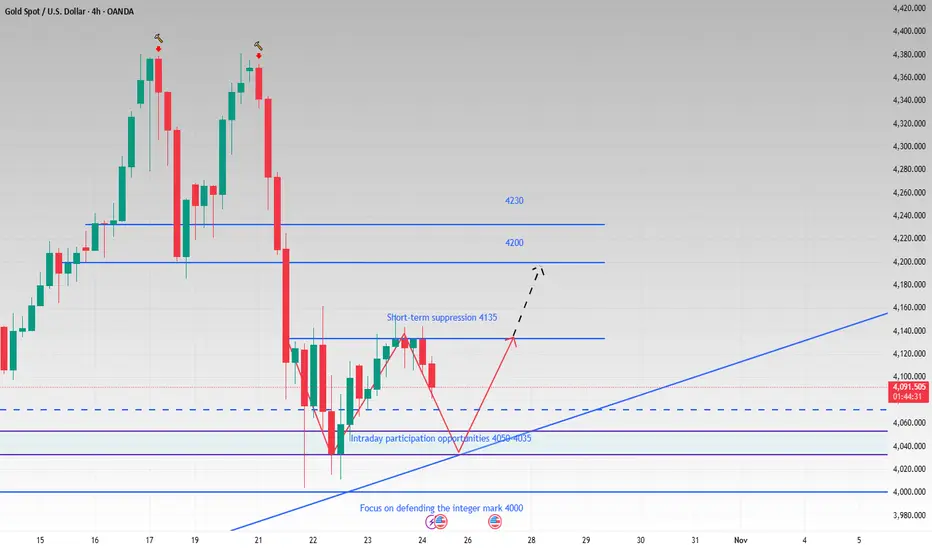
4H see W shape. Support is not broken and it is still bullish.Although gold has experienced a temporary pullback today, we remain bullish as long as the price remains above the upward trend line. While the hourly chart shows a downward trend, with moving averages diverging downward and technical indicators like the MACD forming a death cross, it appears that bears have regained control of the market in the short term.
But from the 4H perspective, if the short-term decline continues and it can effectively rebound after touching the trend line and move out of the W-shaped structure, then gold will be expected to hit the 4135-4145 pressure again, and then gradually hit the 4160, 4200 and other periodic resistance levels until the bulls return. As time goes by, the support points on the short-term trend line are constantly moving up. If it falls back to 4050-4035, try to go long on gold in batches with light positions, and the target is 4090-4130.
OANDA:XAUUSD