Gold Futures (MGCZ25) – Monthly Close SetupPrice has ranged all week between 4040 and 3930. With an H4 FVG still sitting above, we might see one last liquidity grab before the next directional move.
⚖️ Neutral bias for now — watching for clean displacement at range extremes.
📍 If price reclaims 4040 → possible push into the H4 FVG.
📍 If it rejects and drops below 4020 → lower FVG fills toward 3930 could be next.
#Gold #Futures #ICT #MarketStructure #NOFOMO
Gold

XAUUSD: A Potential Reversal on the HorizonOANDA:XAUUSD The price has been on a steady decline, but there's a shift happening. Sellers have tried to push the price even lower twice, but both attempts were met with strong rejection at nearly the same price level. This is forming a Double Bottom, a classic signal that the downward momentum is losing power.
Now, all focus is on the neckline. A decisive breakout and a close above this level will not only confirm the pattern but could also spark a significant rally toward the 4,135 target.
If this happens, we could be looking at the beginning of a powerful trend reversal. The market is gearing up for a move, and this is where it gets exciting.

GOLD LOCAL SHORT|
✅XAUUSD is tapping into a fresh supply level after an impulsive rally, signaling potential bearish rejection toward the short-term imbalance zone below. Time Frame 2H.
SHORT🔥
✅Like and subscribe to never miss a new idea!✅

GOLD Free Signal! Sell!
Hello,Traders!
GOLD Price has reached a horizontal supply area after a corrective move upward. Bears are likely to step in, targeting the previous low for liquidity.
-------------------
Stop Loss: 4,052$
Take Profit: 3,997$
Entry: 4,027$
Time Frame: 2H
Setup Risk: High
-------------------
Sell!
Comment and subscribe to help us grow!
Check out other forecasts below too!
Disclosure: I am part of Trade Nation's Influencer program and receive a monthly fee for using their TradingView charts in my analysis.

THE KOG REPORT - FOMCTHE KOG REPORT – FOMC
This is our view for FOMC, please do your own research and analysis to make an informed decision on the markets. It is not recommended you try to trade the event if you have less than 6 months trading experience and have a trusted risk strategy in place. The markets are extremely volatile, and these events can cause aggressive swings in price.
We’ve done pretty well this week so we’ll only share the levels and potential path but say that it’s really not worth getting involved in the FOMC move itself. We’d rather wait for them to move the price and then look for a set up to get a trade due to the extreme volatility on gold this month.
Below, we have the support level 3965-75 which needs to hold us up in order for this daily candle to close bullish and attempt to target the higher liquidity regions of 4050 and above that 4095. A break above which is very possible will take us into our area or interest which is around the 4150 region. It’s that region we will want to watch, if approached and we get a reaction, an opportunity to short from there may be available to traders.
Because we’re already in long from the swing, there is no point attempting to short it from here, instead, if we do go downside into the lower levels, we will be looking at the 3840-60 regions for a reaction in price to then attempt the scalp long.
RED BOXES:
Break below 3985 for 3955 and 3938 in extension of the move
Break above 4003 for 4020, 4030 and 4061 in extension of the move
Please do support us by hitting the like button, leaving a comment, and giving us a follow. We’ve been doing this for a long time now providing traders with in-depth free analysis on Gold, so your likes and comments are very much appreciated.
As always, trade safe.
KOG

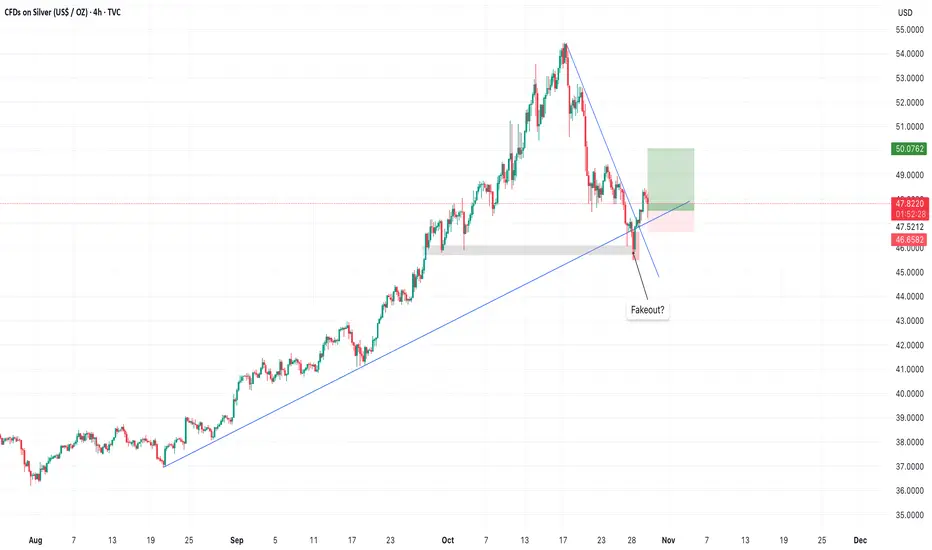
SILVER LongHello traders,
I am sharing my biases for Silver (XAG). My opinion is that we will have a touch to price 50$ at least. The reason why I'm getting long here is because we have a fakeout , and the trendline is holding properly. Also the bullish engulfing on 4H formed yesterday, gives another indication for long.
Silver bull will try to throw you off, but long term healthyA pause that could refresh might be warranted in silver and gold.
I am still optimistic for precious metals long term.
Silver is still undervalued based on historical metrics and money supply.
I worry about the rise in metals and what it implies for the broad stock market indices.

Bullish? Maybe This Will Change Your Mind About ETHHi guys,
This monthly inverse chart should make things clear to you that the market is about to crash hard!
Everyone is so bullish and Microstrategy just announced another BTC purchase which is a huge RED ALERT for all crypto investors.
Stay safe and let me know what do you guys think about this !

GOLD GATHERING MOMENTUM TO RETEST RECENT HIGHA close above (b) will confirm gold's price readiness to rise after creating a HH and HL.
N.B!
- XAUUSD price might not follow the drawn lines . Actual price movements may likely differ from the forecast.
- Let emotions and sentiments work for you
- ALWAYS Use Proper Risk Management In Your Trades
#gold
#xauusd

Title: Gold Pullback to Key Fibonacci Zone — Is $3900 the BottomAfter a 10% correction, gold is now pulling back toward the $4150–$4200 Fibonacci retracement zone.
If the price extends to around $4300, it could signal that the recent low near $3900 was the true bottom and that the bullish structure is recovering.
The next few candles will confirm whether this move is just a technical pullback or the start of a new uptrend.
As long as the daily RSI stays above 50, the bullish trend remains valid.
(This post is for educational purposes only and not financial advice.)
#Gold #XAUUSD #Trading #Markets #Investing

Bitcoin-Gold Ratio Versus Monetary Policy
Chart shows:
—Bitcoin/Gold
—20-Week SMA
—SMA Slope Z-Scores*
—Fed Funds
—QE & QT
Bitcoin/Gold broke support of its 20W SMA for the 6th time in Bitcoin's history while the SMA slope normalizer* value reached zero (the long SMA rolled over), the Fed enters a rate-cutting cycle, and QT is ending.
These could represent increased bearish probabilities for the Btc/Gold ratio on medium and long timeframes.
*Slope Normalizer: The differentiated (positive and negative values are separated before subsequent calculations are made with the data) normalized z-scores (z-scores below 1 are muted while z-scores above 1 are not muted, in order to emphasize unusual values.)
When used with the SMA as an input, this essentially shows the normalized values of the rates of change of the SMA (on this chart, it is showing the normalized slope of the long-term simple moving average.)

Gold Intraday – Oct 30 (No. 2)Setup: Short bias on breakout hold below ~3,959 zone.
Looking for move toward ~3,921 (RR 1.5) and potentially ~3,908 (RR 2.0) if momentum continues.
Stop-loss above invalidation level at ~3,984.
Previous call didn’t hit target — resetting bias with clearer structure.
⚠️ Not financial advice — sharing my view only, trade at your own risk.

Gold Price Analysis – Will Bears Drag XAUUSD Below 3900?Gold continues to trade within a clear downward structure facing consistent resistance near the 4040–4060 zone while maintaining pressure below key descending trendlines. Price recently confirmed another Change of Character (ChoCH) near the 3972 level suggesting bearish continuation. The projection shows potential short-term pullbacks toward 3980–4000 followed by a deeper drop toward targets at 3901 and 3857.
Unless bulls reclaim the 4063–4128 resistance the overall bias remains bearish with expectations of further downside toward the $3,816–$3,850 support range.
Regarding the Fed meeting tomorrow markets widely expect a 25 bps rate cut which is already priced in. The real impact will come from the Fed speech if the Fed hints at further easing (a dovish stance) gold may bounce higher as the dollar weakens. But if the Fed sounds cautious or signals a pause gold could drop sharply as yields and dollar strength return. Overall trend remains bearish traders should stay alert to post Fed volatility as it could temporarily disrupt or confirm the next major move.
🔴 Sell Zone:
The main sell zone is between 4150-4200 which aligns with the upper resistance range and the top boundary of the descending channel. This area has repeatedly acted as a rejection point where sellers step in aggressively. If price retraces into this zone and forms bearish confirmation candles it becomes a strong region to look for short entries.
⚡ Sell Trigger Area:
The sell trigger area lies around 4000 which is a key psychological and structural level. A confirmed break and candle close below 4000 would likely trigger renewed bearish momentum opening the way toward 3901-3857 as next downside targets. This break would confirm continuation of the bearish wave and strengthen the short bias.
Note
Please risk management in trading is a Key so use your money accordingly. If you like the idea then please like and boost. Thank you and Good Luck!

Gold Intraday – Oct 30 (No.1)Scalping setup based on early London session volatility.
Expecting rejection near 2380 and possible short fade toward 2370 zone.
⚠️ Quick play — not advice, just sharing my intraday view.

GOLD | Consolidating Near Pivot, Awaiting Breakout GOLD | Consolidating Near Pivot, Awaiting Breakout
Gold is currently consolidating around the pivot zone at 3,982, as traders await fresh direction following recent volatility.
Momentum remains neutral-to-bearish, but a breakout from this range will define the next move, with volatility expected to rise ahead of upcoming U.S. data and Fed commentary.
Key Levels:
Pivot Line: 3,982
Resistance: 4,011 · 4,031 · 4,053
Support: 3,960 · 3,922 · 3,893
Trading Plan:
Sell Setup: Shorts valid below 3,982, targeting 3,960, and below it will get / 3,922 / 3,893.
Buy Setup: Longs valid only above 3,982, targeting 4,011 / 4,053.
Premium Takeaway
Gold is consolidating between 3,960–3,982, waiting for a decisive breakout.
A 15-minute close below 3,960 would confirm bearish continuation toward 3,922–3,893, while a close above 3,982 shifts bias to bullish, targeting 4,011–4,053

XAUUSD: Market Analysis and Strategy for October 30Gold Technical Analysis:
Daily chart resistance: 4090, support: 3840.
4-hour chart resistance: 4050, support: 3890.
1-hour chart resistance: 4030, support: 3916.
Technical Analysis: Gold prices rebounded technically after falling nearly 5% over four consecutive trading days. The market faced short-term headwinds due to Powell downplaying the possibility of a December rate cut; however, widening divisions within the Federal Reserve regarding interest rate decisions have introduced new uncertainty to the market. Meanwhile, the trade easing agreement reached between the US and China has weakened safe-haven demand.
The daily chart shows a stepped decline, with four consecutive days of losses up to the previous trading day, and the moving average system has formed a death cross. After the European market opened today, prices rebounded rapidly. Short-term resistance levels to watch are 4010 and 4030. If gold can hold above 4010 and remain firmly above 4000, it will likely attract previous buying interest and resume its long-term upward trend. Conversely, if gold fails to recover and hold above 4000, selling on rallies is advisable.
Looking at the 1-hour chart, the moving averages have formed a golden cross, and the MACD/KDJ indicators are providing upward momentum. In the short term, focus on the continuation of the upward trend, paying particular attention to yesterday's rebound high of 4006 and the previous trading day's rebound high around 4030.
Trading Strategy:
SELL: 4050~4056 near
BUY: 3966~3960 near
More Analysis →

GOLD (XAUUSD) | Smart Money Buy Setup from Demand Zone 📝 Description:
Gold is showing a potential reversal structure from the lower demand zone after a liquidity grab near $3,962.
The price is now reacting bullishly from the mitigation block and aiming toward the supply zone at $3,984–$4,019.
Trade Plan:
Entry: From $3,972–$3,975 demand zone (after liquidity sweep)
Stop-Loss: Below $3,962 (structure invalidation)
Target: $4,019 (supply zone / PDH area)
Bias: Bullish – expecting continuation toward previous highs
R:R: ~1:3 setup
If price cleanly breaks above $3,984, expect further continuation to $4,029 (Previous Day High).
A failure to hold above $3,962 would invalidate this bullish setup.

GOLD: Short Trade Explained
GOLD
- Classic bearish formation
- Our team expects fall
SUGGESTED TRADE:
Swing Trade
Sell GOLD
Entry Level - 3972.9
Sl - 3987.4
Tp - 3944.7
Our Risk - 1%
Start protection of your profits from lower levels
Disclosure: I am part of Trade Nation's Influencer program and receive a monthly fee for using their TradingView charts in my analysis.
❤️ Please, support our work with like & comment! ❤️

GOLD Will Go Up From Support! Buy!
Here is our detailed technical review for GOLD.
Time Frame: 2h
Current Trend: Bullish
Sentiment: Oversold (based on 7-period RSI)
Forecast: Bullish
The market is testing a major horizontal structure 3,985.10.
Taking into consideration the structure & trend analysis, I believe that the market will reach 4,051.12 level soon.
P.S
Please, note that an oversold/overbought condition can last for a long time, and therefore being oversold/overbought doesn't mean a price rally will come soon, or at all.
Like and subscribe and comment my ideas if you enjoy them!

GOLD Under Pressure! SELL!
My dear subscribers,
My technical analysis for GOLD is below:
The price is coiling around a solid key level - 4023.4
Bias - Bearish
Technical Indicators: Pivot Points High anticipates a potential price reversal.
Super trend shows a clear sell, giving a perfect indicators' convergence.
Goal - 3987.3
My Stop Loss - 4041.7
About Used Indicators:
By the very nature of the supertrend indicator, it offers firm support and resistance levels for traders to enter and exit trades. Additionally, it also provides signals for setting stop losses
Disclosure: I am part of Trade Nation's Influencer program and receive a monthly fee for using their TradingView charts in my analysis.
———————————
WISH YOU ALL LUCK

( Gold Protocol ) Bearish After Break Detected( Gold Protocol ) Bearish After Break Detected
Status: Active Reversal Protocol
Symbol: Gold
Session: London–New York Overlap (Smart Exit Window)
Confidence Level: ★★★★★ ( Hanzo Volume Detected )
☄️ Bearish After Break Out 3948
Reasons
1. Alpha Sequence Engaged — Smart flow detected within Hanzo precision range.
2. Volume Window Synced — Session energy aligns with internal volume pulse.
3. Liquidity Cycle Active — Engineered sweep confirms smart money transition.
4. Time Lock Confirmed — Market phase locked with directional intent.
5. Volume Map Aligned — Cluster balance reveals real directional flow.
6. Hanzo Wick Detected — Manipulation wick verified under Alpha filter.
⤵️Every like & comment on our TradingView posts helps us grow. More engagement means more exposure, which benefits everyone in the community!
XAU/USD Technical AnalysisXAU/USD Technical Analysis – Gold Awaits Reaction Near 4,000 Zone
Gold (XAU/USD) continues to trade within a corrective structure after a sharp sell-off from the 4,180 area. On the H1 timeframe, price is currently consolidating just below the psychological level of 4,000 USD/oz, showing a battle between short-term buyers and dominant sellers.
The market is now testing a key decision point:
A bullish breakout above 4,020 – 4,040 could trigger a short-term rally toward 4,100 – 4,130, and potentially the major resistance near 4,180.
Conversely, failure to sustain above the 4,000 zone would likely invite renewed selling pressure, driving price back toward 3,950 and possibly 3,880.
This makes the current area a crucial inflection point where price action confirmation will determine the next directional move.
Key Technical Levels
Resistance Zones: 4,040 / 4,130 / 4,180
Support Levels: 3,950 / 3,880
Psychological Level: 4,000
Trading Plan
Scenario 1 (Bullish Breakout):
Entry: Above 4,040 (confirmed breakout)
Targets: 4,100 – 4,130
Stop-Loss: Below 3,990
Scenario 2 (Bearish Rejection):
Entry: Near 4,020 – 4,040 (sell rejection signals)
Targets: 3,950 – 3,880
Stop-Loss: Above 4,060
Technical Outlook
Momentum remains fragile after the recent correction, with traders waiting for confirmation before committing to a directional bias. A clean break above 4,040 would shift short-term sentiment bullish, while a strong rejection from this zone would reaffirm the prevailing downtrend.
Keep an eye on upcoming U.S. economic data and Fed commentary, as volatility around the 4,000 level could set the tone for November’s trading range.
Follow for more daily gold market updates, trade ideas, and macro-driven setups designed for professional traders.

GOLD → Price stuck in range after Fed speech FX:XAUUSD continues to battle for the $4,000 zone. The fundamental backdrop has a hint of unpredictability following the Fed's statement. Technically, the range of 3,915-4,015 is developing
Key factors: US shutdown (4th week): Weighs on the economy and the dollar, supporting gold as a safe haven. However, the Fed toughened its tone yesterday: It cut rates by 25 basis points, but Powell ruled out guarantees for a cut in December. Trump and Xi meeting: Agreements reached on soybeans and rare earths, reducing demand for defensive assets.
Gold balances between shutdown risks and monetary policy tightening. Growth is only possible if macro statistics deteriorate or geopolitics escalate.
Resistance levels: 4015 - 4050
Support levels: 3980 - 3960 - 3915
Gold may continue its correction from the 4015 - 4050 zone to 3950 - 3900 if the bulls are unable to keep the price within the upper range. However, if the market continues to buy the metal (there are no fundamental reasons for this yet) and the price closes above 4015, there may be a chance for growth to 4050 - 4085.
Best regards, R. Linda!
