Gold facing pressure but still open for further surgeFollowing a recent rally, the gold price met significant profit-taking pressure. Prices reached a record high of 4381, signaling an easing of US-China trade tensions.
China confirmed trade talks with the US will occur tomorrow in Malaysia alongside the ASEAN summit. However, both sides are escalating tensions pre-talks to gain bargaining power, potentially complicating a final agreement.
Meanwhile, the prolonged US government shutdown, combined with a weakened Labor Market and a lack of data, has obscured the Labor Market's current situation. This uncertainty fueled market concern and drove investors toward safe-haven assets.
Concurrently, expectations place the US CPI at 3.1% YoY, accelerating from 2.9%. This increase raises stagflation concerns in the US economy, further supporting the gold price.
Technically, XAUUSD hovers slightly above the EMA78. Both EMAs are consolidating, signaling continued flattening momentum.
However, the long-term trend remains to the upside, suggesting investors may buy the dips amid the remaining uncertainty.
Gold

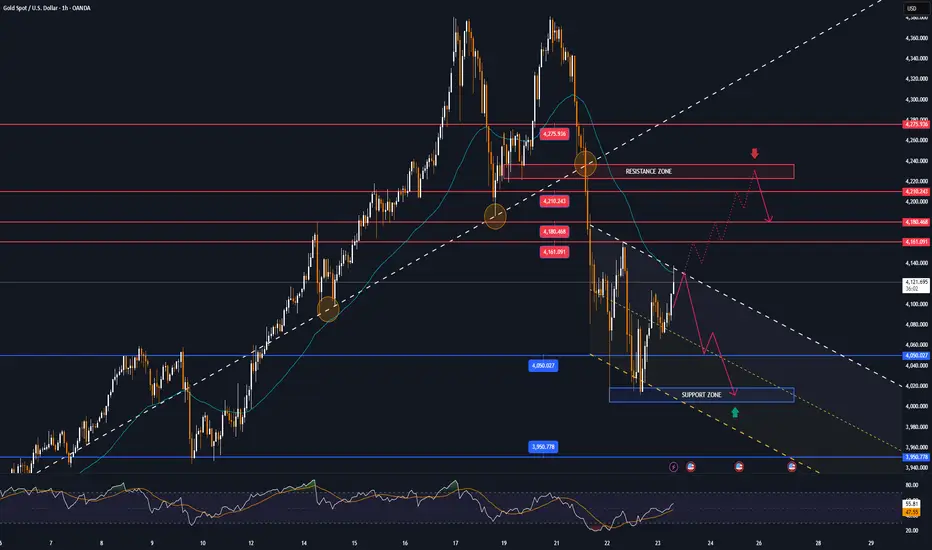
GOLD → Fundamental background boosts interest FX:XAUUSD is recovering after a correction, trading in the range of 4060-4120 amid geopolitical tensions and risks of an escalating trade war.
Key supporting factors: New threats from the US against China, which is responding with additional measures. Trump imposed sanctions against Russian oil companies, accusing Moscow of lack of progress on Ukraine. US inflation data (CPI) on Friday may cause volatility, although the Fed's rate cut next week is likely already priced in.
The meeting between Trump and Xi Jinping next week remains uncertain.
Gold remains a safe haven, but near-term dynamics depend on the balance between dollar strength and geopolitical risks.
Resistance levels: 4116, 4163, 4200
Support levels: 4082, 4060, 4002
A retest of support at 4082-4060, as well as a breakout of resistance at 4116, could trigger a bullish reaction—a rise to the resistance level or imbalance zones. Against the backdrop of the escalating trade war, gold is becoming attractive again.
Best regards, R. Linda!

what is happening wiyth xauusd?1. Fundamental Analysis (Macro Drivers)
🏦 Monetary Policy & Interest Rates
Federal Reserve stance: The Fed has paused rate hikes amid slowing US growth and moderating inflation. Real yields have begun to fall, which supports gold prices.
Market expectation: Traders now expect possible rate cuts in early 2026, lowering opportunity costs of holding non-yielding assets like gold.
Impact: Lower real yields → bullish for gold.
💵 US Dollar Trends
The US Dollar Index (DXY) has weakened over the last quarter due to rate-cut bets and growing fiscal deficits.
A weaker dollar directly lifts XAU/USD since gold is priced in USD.
📈 Inflation & Recession Fears
Despite softening inflation (US CPI ~3.2%), sticky services inflation and fiscal pressures maintain gold’s appeal as a hedge.
Global growth is fragile, and recession fears (notably in Europe and Japan) have increased safe-haven demand.
🌍 Geopolitical & Structural Factors
Escalating geopolitical tensions (Eastern Europe, South China Sea, Middle East) and US election uncertainty have driven institutional and central bank gold buying.
Central banks (notably China, India, and Turkey) are diversifying away from the USD — net gold purchases are at multi-year highs.
🏦 Central Bank Gold Demand
According to the World Gold Council, 2025 central bank purchases are on pace for another record year.
This provides a floor for gold prices even during corrective phases.
📊 Fundamental Outlook Summary
Factor Current Status Gold Impact
Fed Policy / Yields Dovish bias ✅ Bullish
US Dollar Weakening ✅ Bullish
Inflation Moderate but sticky ✅ Bullish
Geopolitical Risk Elevated ✅ Bullish
Central Bank Demand Strong ✅ Bullish
Global Growth Slowing ✅ Bullish
🔎 Overall Fundamental Bias: Strongly Bullish (Short-to-Medium Term)
📉 2. Technical Analysis (as of Oct 23 2025)
🔹 Current Price
XAU/USD ≈ $4,340/oz (TradingEconomics, Oct 20 2025)
🔹 Trend Overview
Long-term uptrend since early 2024 continues.
Gold broke out from a multi-decade ascending channel earlier this year and now trades well above 200-day moving average.
🔹 Moving Averages
Indicator Value Signal
20-day MA $4,215 ✅ Bullish
50-day MA $4,030 ✅ Bullish
100-day MA $3,740 ✅ Bullish
200-day MA $3,290 ✅ Bullish
→ All MAs are aligned in a bullish configuration (short-term > long-term).
🔹 RSI (Relative Strength Index)
RSI ≈ 78 → Indicates overbought conditions → risk of short-term correction or consolidation before further rally.
🔹 Key Levels
Type Level (USD/oz) Note
Resistance 1 $4,400 Recent high
Resistance 2 $4,500 Psychological round level
Support 1 $4,200 Short-term support
Support 2 $3,950 Strong support (previous breakout zone)
Support 3 $3,700 Long-term support / 100-DMA
🔹 Chart Pattern
Ascending channel with potential breakout continuation.
Some analysts note a rising wedge, signaling possible short-term exhaustion.
🔹 Volume & Momentum
Volume peaked on breakout above $4,000 — confirming strong institutional participation.
Momentum indicators show minor divergence → watch for short-term pullback.
📊 3. Combined Outlook
Horizon Technical Bias Fundamental Bias Combined View
Short-Term (1–3 weeks) ⚠️ Overbought – possible pullback to $4,150–4,200 ✅ Bullish Consolidation likely before next leg up
Medium-Term (1–3 months) ✅ Uptrend intact ✅ Bullish Buy on dips strategy favored
Long-Term (6–12 months) ✅ Strong uptrend ✅ Bullish Targets $4,500–$5,000 possible
🪙 4. Scenario Analysis
Scenario Trigger Likely Outcome
Bullish Continuation Fed confirms 2026 rate cuts, DXY weakens Gold → $4,500+
Short-Term Correction RSI reset, USD rebound Pullback to $4,100–$4,200
Bearish Reversal Sharp rise in yields or risk-on sentiment Gold retests $3,700–$3,900
🧩 5. Trading/Investment Insights
Short-term traders: Watch for retracement toward $4,150–$4,200 to consider buy setups.
Swing traders: Maintain partial longs; trail stops below $4,000.
Investors: Maintain core exposure; gold remains a hedge against macro and geopolitical volatility.

GOLD Analysis: Watching for Reaction Near Buyer ZoneHello traders, I want to share with you my opinion about Gold. The market for Gold has been in a strong bullish trend for quite some time, forming a clear upward channel structure. Each impulse has been followed by a short consolidation phase (range), allowing the market to gather liquidity for the next push higher. However, after reaching the key Resistance Level near 4368, the price entered a Seller Zone where heavy supply emerged, triggering a sharp correction. This move broke the short-term market structure and pushed the price down towards the Buyer Zone — an important support area that previously acted as a base for a strong rally. Currently, Gold is trading near the bottom of a descending correction channel, approaching a crucial decision point. I expect the market to make a small corrective move to retest the Resistance Line of this channel, and if rejection follows, it could open the way for another bearish leg toward my TP around 4020. From a broader perspective, this decline still looks like a healthy correction within a major uptrend, so I’ll be watching closely how the price reacts inside the Buyer Zone — it might offer great opportunities for the next bullish impulse later on. Thank you for reading! Please share this idea with your friends and click Boost 🚀

GOLD → Correction after aggressive growthFX:XAUUSD is in a correction phase after a month and a half of aggressive growth. The price is forming a trading range and continues to storm support...
The record growth was overheated, and traders are closing long positions. A gradual change in the fundamental background and market sentiment is also provoking an outflow of funds. However, US-China negotiations, the ongoing US shutdown, and the tense geopolitical situation, including the cancellation of Trump's meeting with Putin, create additional risks in the economy, which may support the metal.
The correction in gold looks like a healthy pause. The $4,000 level remains key support. A recovery above $4100 indicates continued buyer interest, but further dynamics depend on news about trade negotiations.
Resistance levels: 4082, 4107, 4163
Support levels: 4059, 4000
A breakdown of the trading range support could trigger further sell-offs. Focus on 4000K, aggressive reaction possible. At the moment, the market is falling as aggressively as it rose. We need to wait for the price to slow down in order to make reasonable technical decisions.
Best regards, R. Linda!

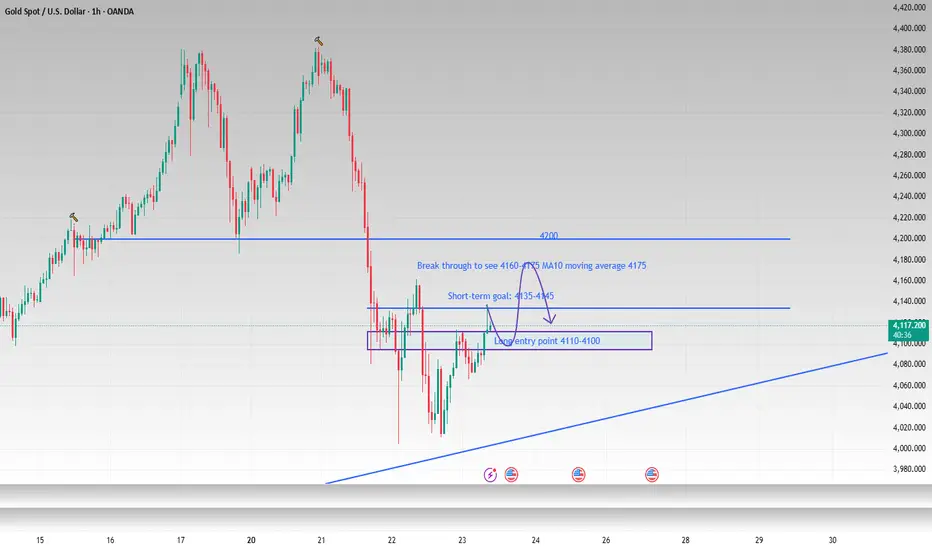
The trend line is not broken and the medium to long term is bull
Good morning, bros. Gold has fallen from its high of 4380, dropping nearly $380. This significant drop is relatively rare in the past six months. However, judging from the 4H cycle trend, the current gold price is still above the rising trend line. The 4000 mark is a defensive point for bulls. The decline will only continue after successfully breaking through 4000. Yesterday, the lowest point only retreated to around 4015-4005 before it began to rebound. Although it did not provide us with an ideal entry opportunity, it also confirmed the determination of the buyers below to hold on to the 4000 mark. Therefore, until a clear break below the trend line is achieved, our bullish outlook remains unchanged.
The gold price rebounded to around 4135 during the day and then fell back. As I told you yesterday, this position is a relatively dense trading area. I believe the current decline is the market accumulating strength to hit yesterday's rebound high, and it also provides us with a good opportunity to enter the long market. Pay attention to 4110-4100 below. If it retreats to this range, you can try to go long on gold in batches. The first target can continue to look at 4135-4145.
OANDA:XAUUSD
GOLD PAUSES DECLINE; REBOUND IN PLAY TP: 4398 - 4485 - 4630GOLD Macro Outlook
Gold prices rose to around $4,120 per ounce on Thursday, halting a two-day decline as investors weighed trade developments and geopolitical tensions that lifted the metal’s safe-haven appeal.
Reports indicated that the US is considering export restrictions on China involving American-made software, though President Donald Trump later confirmed plans to meet with Chinese President Xi Jinping.
Gold is setting up for a potential bullish continuation as falling bond yields and anticipated Federal Reserve rate cuts continue to weaken the U.S. dollar and boost demand for safe-haven assets.
The 10-year Treasury yield remains below 4%, and yields across the curve have softened. This reinforces expectations that the Fed will announce rate cuts during its upcoming FOMC meetings on October 29 and December 10.
Looking into 2026, the trend of global monetary easing is likely to persist. Economies in Asia and Northern Europe are showing signs of structural weakness due to aging demographics and declining household formation, leading to prolonged low growth and further pressure on global interest rates.
Gold Technical Structure
On the technical front, Gold is currently trading near $4,137, after correcting from the recent high of $4,398. The chart shows price consolidating along the lower Gann support, with a potential reversal setup forming.
Immediate Support: $4,023–$4,100
Immediate Resistance: $4,175 and $4,225–$4,255 (key breakout zone)
Breakout Targets: $4,318 → $4,398 → $4,485 → $4,631
Stop-Loss: Below $4,025 (closing basis)
A daily close above $4,255 would confirm bullish continuation, opening the path toward $4,400–$4,630 levels in the medium term. A breakdown below $4,050 would invalidate the setup and shift bias back to neutral.
Summary
Bias: Bullish (above $4,225)
Entry Zone: $4,060–$4,150
Confirmation: Close above $4,255
Stop-Loss: $4,025 (closing basis)
Targets: $4,318 → $4,398 → $4,485 → $4,631
Macro Catalyst: Fed easing cycle, weaker USD, global rate decline
Gold remains well-positioned for a renewed upside phase driven by macro tailwinds and technical recovery from support zones. Sustained trade above $4,225–$4,255 could confirm a breakout, aligning both macro fundamentals and technical signals in favor of the bulls.

Hellena | GOLD (4H): LONG to 61.8% Fibo of 4265.Dear colleagues, in the new forecast the idea remains the same - the upward momentum (12345) is not yet complete.
At the moment I see the end of the formation of the corrective wave “4” at the level of 4000, as stated earlier, and the beginning of the upward movement in wave “5”.
I do not want to set distant targets, because their achievement may take time, so let's start small - the nearest target is the resistance area at 4265 - the area beyond the 61.8% level of wave “4”. I think that this is the nearest target that we should expect.
Fundamental context
Earlier this week, gold experienced a sharp pull-back after its recent record highs. Nothing to panic about — it’s simply a technical correction: investors are taking profits after a rapid and extended rally. Key drivers like central bank buying and lower rate expectations remain intact, so the broader bullish story is still alive. In fact, this brief dip may offer a better entry point before the next leg up.
Manage your capital correctly and competently! Only enter trades based on reliable patterns!

GOLD cooling down, correction or signal of new cycle?Summary
“After three consecutive sessions of declines, gold is experiencing a short-term correction after a rally that has lasted more than two months. Despite falling nearly 6% from its recent peak, the medium-term uptrend remains solid as prices remain above the psychological level of $4,000 per ounce. This move reflects a technical cooling of an overbought market, rather than a fundamental reversal.
With the Fed expected to cut interest rates before the end of the year, geopolitical tensions lingering and the trend of “de-dollarization” spreading, gold continues to play a central role in the global safe-haven portfolio. Investors are now closely watching the price reaction around the $4,000 region, the balance point between short-term profit-taking pressure and medium-term accumulation momentum, while the technical outlook still favors a recovery trend if this support level holds.”
OANDA:XAUUSD corrects after 3-day decline, medium-term uptrend remains strong
Gold has fallen for three consecutive days, marking a technical correction after a long rally. Spot gold was hovering around $4,080/ounce on Tuesday morning, nearly 6% below its recent peak, reflecting a necessary pullback in an overbought market.
The decline comes amid global markets being cautious about the latest developments in US-China trade talks and unclear signals on the Federal Reserve’s interest rate path. Despite short-term pressure, gold remains a central part of the safe-haven portfolio, especially as geopolitical risks increase and major currencies face “soft devaluation” pressure.
Comment: “After a period of excessive growth, gold is correcting like an overstretched spring. The fact that the price is still holding above the $4,000 mark shows that this is a technical cooling process, not a fundamental reversal. The need for safe haven and defensive trades in the Dollar still exists.”
Gold has risen more than 55% year-to-date since mid-August, boosted by expectations of at least a 25 basis point cut by the Fed before the end of the year, along with a trend to hedge against inflation and widening budget deficits. The stability of the US dollar and ETF inflows supported gold prices, while silver and platinum recorded consecutive losses due to profit-taking pressure.
Traders are also focusing on new political-trade signals. US President Trump expressed optimism about a “good deal” at the upcoming meeting with Asian leaders, but admitted that a delay scenario is still possible. This situation has made the market sentiment “cautious but realistically optimistic,”.
The current decline reflects a technical correction, not a trend reversal. With the Fed likely to cut interest rates, persistent geopolitical tensions and the “de-dollarization” trend of some economies, gold remains a pillar in the global safe-haven structure. Investors should monitor the price reaction around the $4,000 mark, the balance point between short-term profit-taking and medium-term accumulation.
Technical outlook analysis of OANDA:XAUUSD
Gold Technical Outlook: Bulls Keep the Initiated Around $4,000
Gold prices are experiencing a short-term but strong correction, after a long rally since mid-August. On the daily chart, the decline has brought the price to test the important support cluster around $4,000–$4,050/oz, corresponding to the Fibonacci 0.618 zone and the MA50 average, which acts as a key “psychological milestone” for the bulls.
The RSI has retreated to near the neutral level of 50, reflecting a temporary cooling rather than a trend reversal. The major trend structure remains clearly bullish, as evidenced by the intact upward price channel.
If the $4,000 zone is maintained, gold is likely to enter an accumulation-recovery phase, with the nearest resistance zones at $4,160–$4,180 (Fibo 0.5) and $4,210–$4,275 (Fibo 0.382–0.236). Conversely, a loss of the $4,000 mark would trigger deeper profit-taking towards the extended support zone of $3,950.
The current correction suggests the market is consolidating its medium-term uptrend, with no signs of breaking the trend. Once sentiment stabilizes around the $4,000 threshold, new buying pressure is likely to return, especially if there are supportive signals from US economic data or expectations of a Fed rate cut.
SELL XAUUSD PRICE 4231 - 4229⚡️
↠↠ Stop Loss 4235
→Take Profit 1 4223
↨
→Take Profit 2 4217
BUY XAUUSD PRICE 4001 - 4003⚡️
↠↠ Stop Loss 3997
→Take Profit 1 4009
↨
→Take Profit 2 4015
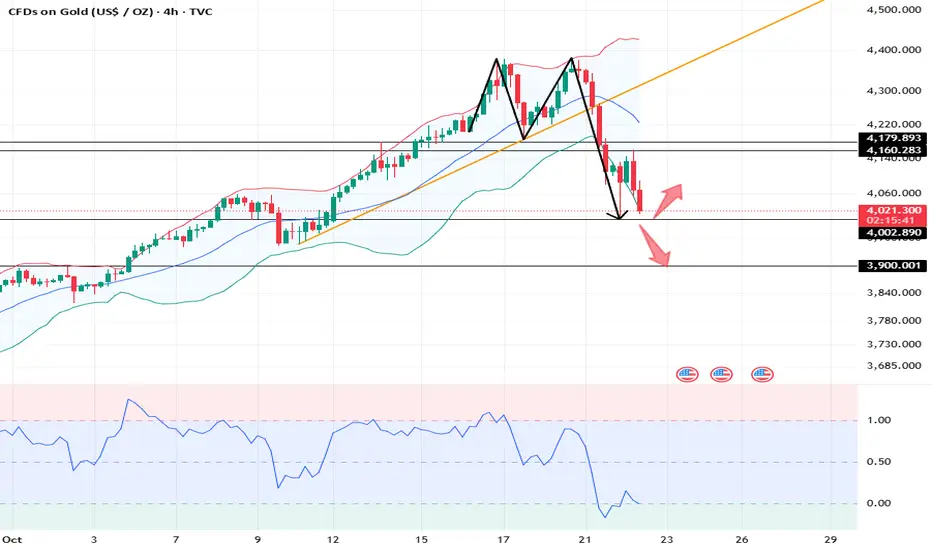
Gold is correction done? 22/Oct/25XAUUSD probably will break the uptrend line (blue) since triangle breakouton August as price now just stalling at the trendline before creating panic selling /stop lost..Price could reach as low as 3940 +/- before...

The Ultimate GOLD || Intraday Trading Plan (10/23/2025)Welcome to Trade with Decrypters!
DETAILED AND COMPLETE ANALYSIS ( 5 TRADE SETUPS )
Central Bank Buying
Central banks added net 19t in August led by Kazakhstan (14t), Bulgaria and El Salvador, Q3 on pace for 1,000t+ annually up 41% from historical norms. BRICS drivers like China (300t+ YTD) and India's $100B reserves fuel de-dollarization and inflation hedges; Poland reaffirms targets amid risks. Silver links to EV/solar boom (+70% China demand). Outlook: Unfazed 1,000t buys lift prices into 2026.
ETF Inflows & Sentiment
Gold ETFs hit $472B AUM in Q3 (+23% q/q) with $64B YTD inflows, September $17B record led by North America/Europe; Asia minor outflows. Safe-haven rush amid trade wars, minor profit-taking post $4k peak. RSI 75 overbought, $3,900 support holds. Silver +$2B YTD on industry bets. Forecast: Gold $4,200 test, silver $50+.
Macro & Geopolitical Events
Fed Oct cut vs. 2.9% inflation/shutdown-delayed jobs—labor firmer but risks grow.
Trump's China tariffs fuel wars; BRICS stalls de-dollarization but boosts gold; Ukraine/Mideast hikes energy/inflation. Drives 50%+ YTD metals gains; tariffs add 1–2% CPI.
Silver Deficit
Fifth straight deficit at 118M oz in 2025 (down 21% YoY), demand stable 1.20B oz vs supply +3% to 1.05B oz, industrial record 680M+ oz from solar/EVs. Renewables offset jewelry drops
Futures & Options Flow
CME gold OI ~528k contracts, steady amid volumes; CVOL moderate, call/put skew bullish for rate-cut squeezes
Fundamentals & Forecast
Gold +51% to $4,062, silver +43% to $48—via 1,000t+ CB buys, inflation, cuts, 7% GDP deficits. De-dollarization/geo-risks dominate. Projection: Gold $4,400 Q4, silver $57 mid-2026

Stop!Loss|Market View: GBPUSD🙌 Stop!Loss team welcomes you❗️
In this post, we're going to talk about the near-term outlook for the GBPUSD currency pair☝️
Potential trade setup:
🔔Entry level: 1.33425
💰TP: 1.32176
⛔️SL: 1.34167
"Market View" - a brief analysis of trading instruments, covering the most important aspects of the FOREX market.
👇 In the comments 👇 you can type the trading instrument you'd like to analyze, and we'll talk about it in our next posts.
💬 Description: For the pound, sell priorities are still in place. A retest of the 1.32870 support area is expected here in the near future. Sell trade is looked for from current prices (as the primary scenario), but manipulation (a false breakout) should be expected in the event of a further retest of the 1.34500 resistance area, after which a sell should be looked for again at more favorable prices. The 1.30000 level is considered a medium-term target.
Thanks for your support 🚀
Profits for all ✅
❗️ Updates on this idea can be found below 👇

EUR/USD on the 30-minute timeframe....EUR/USD on the 30-minute timeframe, and my marked two “Target Points” on it.
Let’s interpret what’s shown:
Current price: around 1.1598–1.1600.
I have a downtrend line that price looks like it’s testing from below.
A small support box (around 1.1590 area) shows a possible reversal zone.
Two target levels are marked with blue arrows and labeled “Target Point.”
Based on what’s visible:
First target (near-term): Around 1.1650–1.1655
Second target (extended): Around 1.1700–1.1710
✅ Targets summary:
🎯 TP1: 1.1650
🎯 TP2: 1.1700
These levels correspond to my drawn projection arrows and are logical resistance zones (top of the Ichimoku cloud and prior structure highs).
If you want a tactical plan:
Entry zone: Around 1.1600 (confirmation of bullish break from the descending channel).
Stop-loss: Below 1.1580 (below recent low and support box).
Take-profit:
TP1 → 1.1650
TP2 → 1.1700

EUR/GBP on the 4-hour chart Pattern..EUR/GBP on the 4-hour chart the Ichimoku cloud and a trendline setup.
From my chart, here’s what I can read and infer:
The ascending trendline is acting as support, connecting higher lows from mid-September onward.
Price is consolidating near 0.8690, just above that trendline.
The target point drawn on my chart is around 0.8716 – 0.8720, based on the breakout projection.
My marked a measured move from the triangle’s height projected upward — suggesting a potential bullish breakout.
✅ So my target point is approximately 0.8716 – 0.8720.
If my trading this setup:
Entry: Around 0.8690–0.8695 (confirmation of breakout above Ichimoku cloud or the small resistance).
Stop-loss: Below the trendline, near 0.8670–0.8660.
Take-profit: 0.8716–0.8720 (my chart’s target).

Gold (XAU/USD) – Technical Outlook for TodayGold continues its short-term recovery after last week’s sharp selloff from the 4,400 zone. On the 1H timeframe, price has shown early signs of stabilization above the 4,070–4,080 support area, where strong buy-side reaction appeared.
The market is now attempting a corrective move toward the 4,150–4,160 resistance zone, a key structure level that previously acted as support before the breakdown. A successful retest of this area could determine the next directional bias:
Bullish scenario: If buyers can reclaim and hold above 4,160, we may see further upside extension toward 4,300–4,350, aligning with the 0.5–0.618 Fibonacci retracement of the previous down-leg.
Bearish scenario: Failure to break 4,160 may attract renewed selling pressure, possibly leading to another retest of 4,050 or even 4,000.
Technical confluence:
EMA20 turning upward, signaling short-term momentum recovery.
RSI recovering from oversold territory, supporting a potential retracement.
Key resistance zone: 4,150–4,160
Key support zone: 4,070–4,000
In summary, gold is currently in a pullback phase within a broader correction. Traders may look for short-term buy opportunities toward resistance but should watch price behavior closely around 4,160 before deciding the next move.
Follow for more high-probability setups and daily strategy updates.

Gold finally has a supply range! Time for bullish correction?I talked about everything but the obvious inverse head and shoulders/Quasimodo forming the right shoulder now. If everything goes right can we expect an arm to extend upwards here during the stochastic buy cycle?
Let me know what you think and be sure to share and care for others if you found this helpful.
Also talked about the "REAPER WARNING" as we have a reaper inversion range actively terrorizing price 🧩

Gold buyers showing signs of activityHi traders and investors!
This analysis is based on the Initiative Analysis (IA) concept.
Daily Timeframe
We can see that volume is starting to appear from the buyer zone located at the base of the last buyer initiative.
Yesterday’s seller activity didn’t bring any visible result — the candle closed inside the previous one.
Still, this leaves hope that there is a buyer active in this area, and we may soon see a move from their side.
1-hour timeframe
On the 1-hour timeframe, a sideways range has formed.
The buyer initiative currently has a target at 4127 — let’s watch how this movement develops.
Inside this initiative, we now have a key seller bar - IC on the chart, which was absorbed by the buyer.
There has already been a first attempt of a rebound from this buyer zone, and it’s currently unfolding. We’ll see how it plays out.
If the first attempt fails, we can look for local long opportunities from the support level around 4065 or 4004.
Wishing you profitable trades!

XAUUSD: Market Analysis and Strategy for October 22Gold Technical Analysis
Daily Resistance: 4380, Support: 3900
4-Hour Resistance: 4180, Support: 4000
1-Hour Resistance: 4160, Support: 4000
Technically, gold fell by $380, temporarily halting its decline near 4000. Technical indicators are recovering, and the market is taking a brief breather. Bull markets are prone to large swings, so it's unclear whether gold has truly reversed in the short term.
Gold has tested the 4000 support level twice. Watch for the continuation of the short-term downtrend. The moving average price has broken through the upward trend line in the short term, and the indicators are in a state of recovery, but the Bollinger Bands remain upward. The 4170/4180 levels on the daily chart are key. If they are successfully recaptured, the market is poised for a strong bullish resurgence. Otherwise, the market will continue to fluctuate downwards in the short term, looking for support. Focus on the 4000 level. If it breaks below, it will continue to move towards 3900.
Looking at the 1-hour chart, the candlestick pattern has broken below the neckline of the M-shaped top. Market bearish sentiment is being released, and indicators continue to move downward rapidly. The short-term bull-bear dividing line is between 4188 and 4208. Short-term rebound momentum is limited, and the NY market remains bearish.
Trading Strategy:
BUY: 4000-4005near
SELL: 4160near
SELL: 4178near
More Shares →
#Gold Long Bullish on all fronts with lots of volatility.OANDA:XAUUSD
Fundamental — 🟢 Bullish (4/5 stacks): Hedge demand; easing bias supports.
Technical — 🟢 Diamond Vault Bullish (7/7 stacks): > EMAs; RSI 58; MACD strong; ADX 55; +DI gap ~52%.
Overall: 🟢 Diamond Vault Bullish (11 total stacks)
Trade plan: Long → SL ≈ 149.416 | TP ≈ 388.482. Approx levels: SL 3945.904, TP 4483.8016.
20-word summary: Top momentum asset; trend breadth and strong ADX favor dip buys toward 4050 with upside continuation to new highs.
Extremely volatile keep smaller positions and wider stops and take profit.
Stay sharp, Stay nimble.

GOLD BEARISH BIAS|SHORT|
✅XAUUSD broke its main ascending trendline, and gold is now showing bearish structure with potential continuation toward the next downside target. Price has retested the broken trendline before extending lower and we are seeing a clear rejection.Time Frame 2H.
SHORT🔥
✅Like and subscribe to never miss a new idea!✅

( Gold Protocol ) Bullish & Bearish Reversal Detected➕ Bearish Reversal " 4115 Zone
➕ Bullish Reversal : 3990
🩸 Volume Surge Confirmed — Institutional buyers active
🩸 Session Aligned — Timing matches liquidity expansion window
🩸 Cluster Shield Formed — Demand imbalance verified
🩸 Delta Shift Positive — Accumulation phase confirmed
🩸 POC Retest Completed — Weak shorts absorbed
🩸 Structure Break Pending — Bullish intention verified
Logic: This is engineered reversal, not prediction.
💯 Objective: Controlled execution with minimal drawdown.
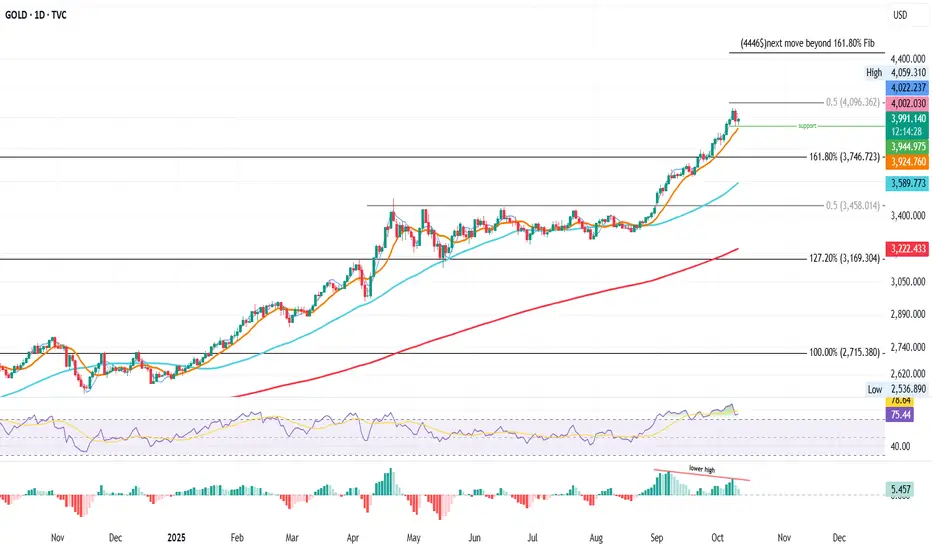
GOLD DAILY CHART ROUTE MAP UPDATEHey everyone,
Check out our updated Daily Chart Route Map, now featuring updated levels for tracking Golds movement.
We’ve refined our proprietary Goldturn Channel, our unique method for constructing ascending channels. Price action recently broke out above the channel, with a body close above 4325, leaving a long-term gap open near 4444.
Currently, we’re observing rejection at 4325, and our channel top is now acting as support. The market is range-bound between 4325 (resistance) and 4183 (channel top as support). A decisive break above or below either of these levels will help define the next directional move, keeping in mind the open gap overhead at 4444.
On the downside, 3961 remains the pivotal swing zone, aligning with the channel midline, should we see a confirmed break below 4183.
As always, we will keep you all updated with regular updates throughout the week and how we manage the active ideas and setups. Thank you all for your likes, comments and follows, we really appreciate it!
Mr Gold
GoldViewFX

Gold Daily – Holding the Line Before the Next MoveGold Daily – Holding Support, Eyes on the Next Leg
Gold’s run from the 50MA support that started in the second half of August has been nothing short of spectacular.
After such a sharp move, it’s natural to look for where price might pause or recharge.
Based on historical price action and key Fibonacci levels, several zones stand out.
The 0.5 Fib level at $4,096 acted as resistance on October 8, marking the local high of this move.
Below, the green support line around $3,945 is now being tested, a zone that also aligns closely with the BBcenter, creating a confluence of potential support.
So far, this level has held for two sessions, but confirmation will depend on today’s daily close, roughly 12 hours from now.
With inflation concerns resurfacing and central banks showing renewed interest in gold reserves, the macro backdrop still favours strength in the long term.
Many are calling for a top in gold after this explosive rally, but as history shows, tops are rarely that obvious.
If this support zone, defined by the BBcenter and green line, manages to hold, price could push again toward $4,096, and possibly even extend to the projected “Next Move Beyond 161.8%” level around $4,446.
Bias: Cautiously bullish, support cluster holding, watching daily close for confirmation of continuation.
Always take profits and manage risk.
Interaction is welcome.