EUR/GBP on the 4-hour chart Pattern..EUR/GBP on the 4-hour chart the Ichimoku cloud and a trendline setup.
From my chart, here’s what I can read and infer:
The ascending trendline is acting as support, connecting higher lows from mid-September onward.
Price is consolidating near 0.8690, just above that trendline.
The target point drawn on my chart is around 0.8716 – 0.8720, based on the breakout projection.
My marked a measured move from the triangle’s height projected upward — suggesting a potential bullish breakout.
✅ So my target point is approximately 0.8716 – 0.8720.
If my trading this setup:
Entry: Around 0.8690–0.8695 (confirmation of breakout above Ichimoku cloud or the small resistance).
Stop-loss: Below the trendline, near 0.8670–0.8660.
Take-profit: 0.8716–0.8720 (my chart’s target).
Gold

Gold (XAU/USD) – Technical Outlook for TodayGold continues its short-term recovery after last week’s sharp selloff from the 4,400 zone. On the 1H timeframe, price has shown early signs of stabilization above the 4,070–4,080 support area, where strong buy-side reaction appeared.
The market is now attempting a corrective move toward the 4,150–4,160 resistance zone, a key structure level that previously acted as support before the breakdown. A successful retest of this area could determine the next directional bias:
Bullish scenario: If buyers can reclaim and hold above 4,160, we may see further upside extension toward 4,300–4,350, aligning with the 0.5–0.618 Fibonacci retracement of the previous down-leg.
Bearish scenario: Failure to break 4,160 may attract renewed selling pressure, possibly leading to another retest of 4,050 or even 4,000.
Technical confluence:
EMA20 turning upward, signaling short-term momentum recovery.
RSI recovering from oversold territory, supporting a potential retracement.
Key resistance zone: 4,150–4,160
Key support zone: 4,070–4,000
In summary, gold is currently in a pullback phase within a broader correction. Traders may look for short-term buy opportunities toward resistance but should watch price behavior closely around 4,160 before deciding the next move.
Follow for more high-probability setups and daily strategy updates.

Gold finally has a supply range! Time for bullish correction?I talked about everything but the obvious inverse head and shoulders/Quasimodo forming the right shoulder now. If everything goes right can we expect an arm to extend upwards here during the stochastic buy cycle?
Let me know what you think and be sure to share and care for others if you found this helpful.
Also talked about the "REAPER WARNING" as we have a reaper inversion range actively terrorizing price 🧩

Gold buyers showing signs of activityHi traders and investors!
This analysis is based on the Initiative Analysis (IA) concept.
Daily Timeframe
We can see that volume is starting to appear from the buyer zone located at the base of the last buyer initiative.
Yesterday’s seller activity didn’t bring any visible result — the candle closed inside the previous one.
Still, this leaves hope that there is a buyer active in this area, and we may soon see a move from their side.
1-hour timeframe
On the 1-hour timeframe, a sideways range has formed.
The buyer initiative currently has a target at 4127 — let’s watch how this movement develops.
Inside this initiative, we now have a key seller bar - IC on the chart, which was absorbed by the buyer.
There has already been a first attempt of a rebound from this buyer zone, and it’s currently unfolding. We’ll see how it plays out.
If the first attempt fails, we can look for local long opportunities from the support level around 4065 or 4004.
Wishing you profitable trades!

XAUUSD: Market Analysis and Strategy for October 22Gold Technical Analysis
Daily Resistance: 4380, Support: 3900
4-Hour Resistance: 4180, Support: 4000
1-Hour Resistance: 4160, Support: 4000
Technically, gold fell by $380, temporarily halting its decline near 4000. Technical indicators are recovering, and the market is taking a brief breather. Bull markets are prone to large swings, so it's unclear whether gold has truly reversed in the short term.
Gold has tested the 4000 support level twice. Watch for the continuation of the short-term downtrend. The moving average price has broken through the upward trend line in the short term, and the indicators are in a state of recovery, but the Bollinger Bands remain upward. The 4170/4180 levels on the daily chart are key. If they are successfully recaptured, the market is poised for a strong bullish resurgence. Otherwise, the market will continue to fluctuate downwards in the short term, looking for support. Focus on the 4000 level. If it breaks below, it will continue to move towards 3900.
Looking at the 1-hour chart, the candlestick pattern has broken below the neckline of the M-shaped top. Market bearish sentiment is being released, and indicators continue to move downward rapidly. The short-term bull-bear dividing line is between 4188 and 4208. Short-term rebound momentum is limited, and the NY market remains bearish.
Trading Strategy:
BUY: 4000-4005near
SELL: 4160near
SELL: 4178near
More Shares →
#Gold Long Bullish on all fronts with lots of volatility.OANDA:XAUUSD
Fundamental — 🟢 Bullish (4/5 stacks): Hedge demand; easing bias supports.
Technical — 🟢 Diamond Vault Bullish (7/7 stacks): > EMAs; RSI 58; MACD strong; ADX 55; +DI gap ~52%.
Overall: 🟢 Diamond Vault Bullish (11 total stacks)
Trade plan: Long → SL ≈ 149.416 | TP ≈ 388.482. Approx levels: SL 3945.904, TP 4483.8016.
20-word summary: Top momentum asset; trend breadth and strong ADX favor dip buys toward 4050 with upside continuation to new highs.
Extremely volatile keep smaller positions and wider stops and take profit.
Stay sharp, Stay nimble.

GOLD BEARISH BIAS|SHORT|
✅XAUUSD broke its main ascending trendline, and gold is now showing bearish structure with potential continuation toward the next downside target. Price has retested the broken trendline before extending lower and we are seeing a clear rejection.Time Frame 2H.
SHORT🔥
✅Like and subscribe to never miss a new idea!✅

( Gold Protocol ) Bullish & Bearish Reversal Detected➕ Bearish Reversal " 4115 Zone
➕ Bullish Reversal : 3990
🩸 Volume Surge Confirmed — Institutional buyers active
🩸 Session Aligned — Timing matches liquidity expansion window
🩸 Cluster Shield Formed — Demand imbalance verified
🩸 Delta Shift Positive — Accumulation phase confirmed
🩸 POC Retest Completed — Weak shorts absorbed
🩸 Structure Break Pending — Bullish intention verified
Logic: This is engineered reversal, not prediction.
💯 Objective: Controlled execution with minimal drawdown.
GOLD DAILY CHART ROUTE MAP UPDATEHey everyone,
Check out our updated Daily Chart Route Map, now featuring updated levels for tracking Golds movement.
We’ve refined our proprietary Goldturn Channel, our unique method for constructing ascending channels. Price action recently broke out above the channel, with a body close above 4325, leaving a long-term gap open near 4444.
Currently, we’re observing rejection at 4325, and our channel top is now acting as support. The market is range-bound between 4325 (resistance) and 4183 (channel top as support). A decisive break above or below either of these levels will help define the next directional move, keeping in mind the open gap overhead at 4444.
On the downside, 3961 remains the pivotal swing zone, aligning with the channel midline, should we see a confirmed break below 4183.
As always, we will keep you all updated with regular updates throughout the week and how we manage the active ideas and setups. Thank you all for your likes, comments and follows, we really appreciate it!
Mr Gold
GoldViewFX

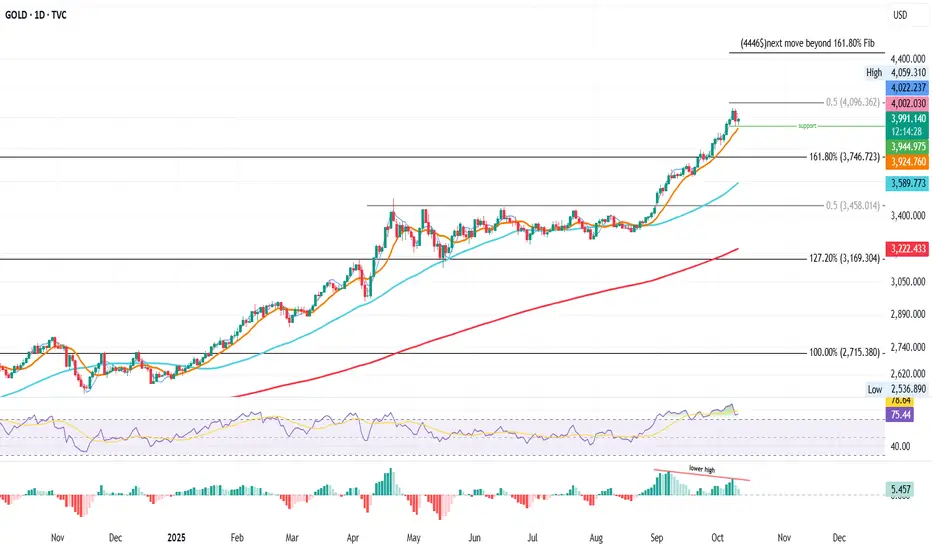
Gold Daily – Holding the Line Before the Next MoveGold Daily – Holding Support, Eyes on the Next Leg
Gold’s run from the 50MA support that started in the second half of August has been nothing short of spectacular.
After such a sharp move, it’s natural to look for where price might pause or recharge.
Based on historical price action and key Fibonacci levels, several zones stand out.
The 0.5 Fib level at $4,096 acted as resistance on October 8, marking the local high of this move.
Below, the green support line around $3,945 is now being tested, a zone that also aligns closely with the BBcenter, creating a confluence of potential support.
So far, this level has held for two sessions, but confirmation will depend on today’s daily close, roughly 12 hours from now.
With inflation concerns resurfacing and central banks showing renewed interest in gold reserves, the macro backdrop still favours strength in the long term.
Many are calling for a top in gold after this explosive rally, but as history shows, tops are rarely that obvious.
If this support zone, defined by the BBcenter and green line, manages to hold, price could push again toward $4,096, and possibly even extend to the projected “Next Move Beyond 161.8%” level around $4,446.
Bias: Cautiously bullish, support cluster holding, watching daily close for confirmation of continuation.
Always take profits and manage risk.
Interaction is welcome.
GOLD Bull Market Price Target is 7 500 USD accumulate on dips🏆 Gold Market Long-Term Update 12/24 months
📊 Technical Outlook Update
🏆 Bull Market Overview
▪️2weeks/candle price chart
▪️Gold Bull market in progress
▪️1976/1979 650% gains - Bull Market 1
▪️1999/2012 650% gains - Bull Market 2
▪️2016/2027 650% gains- Bull Market 3
▪️Price Target BULLS 7500 USD
▪️650% gains off the lows
▪️will hit in 2026/2027
⭐️Recommended strategy
▪️BUY/HOLD accumulate dips
▪️BUY/HOLD physical gold
▪️BUY/HOLD GLD/GDX

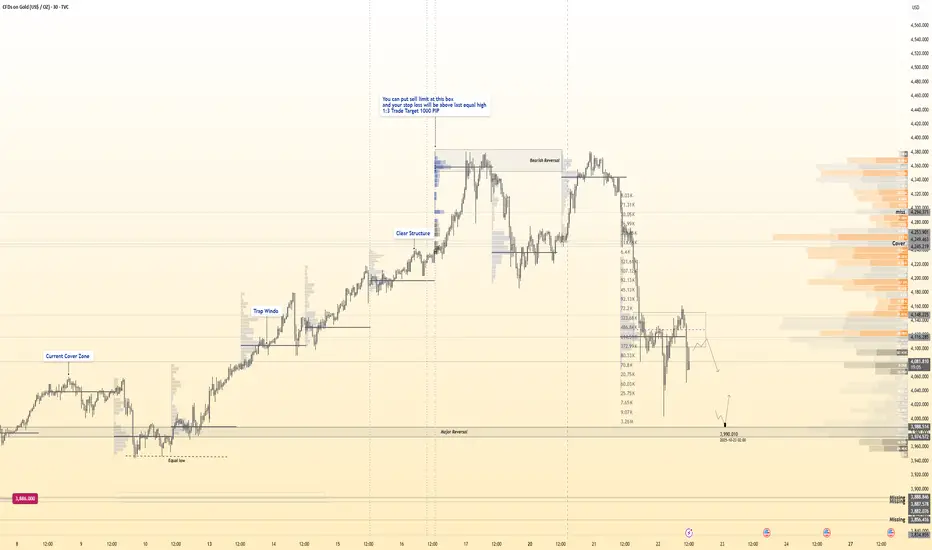
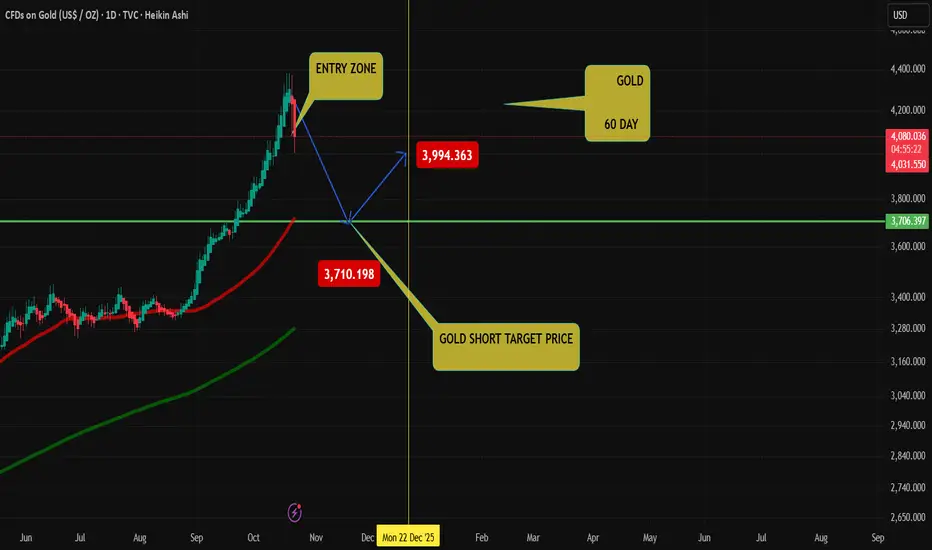
GOLD US SHORTGOLD 60 DAY Target point
You try! Easy Money,
The gold Only long position after!!!
check my profile gold / play button
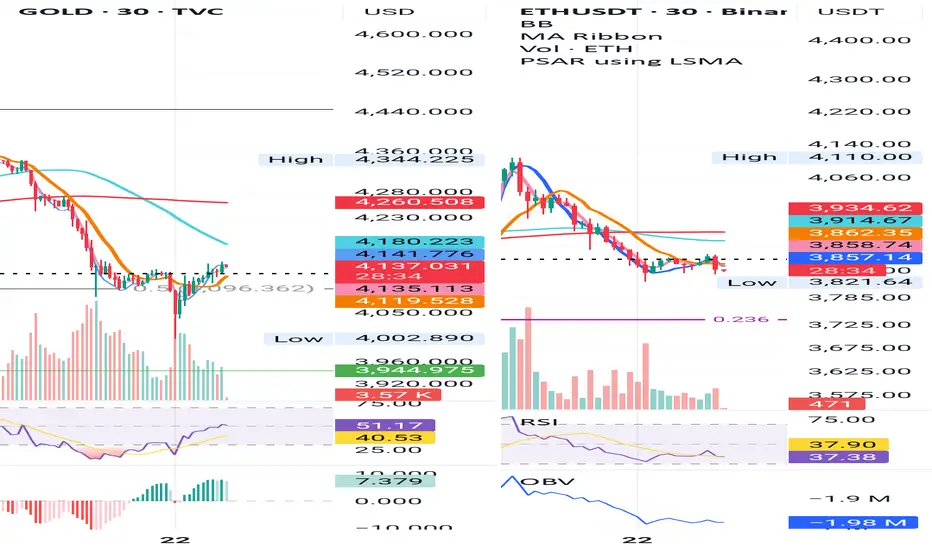
Gold & ETH 30-Min – Parallel Structures, Subtle Differences
Gold found support right at the 0.5 Fib 4096 $ and is now trading above yesterday’s close, a sign of renewed strength.
ETH, meanwhile, is retesting yesterday’s close as support but is now slipping slightly below it, showing early weakness after failing to sustain the bounce.
From a system perspective, both charts are aligned:
BB Center < SMA < Price < MLR, a constructive setup that still supports potential continuation, if price stabilizes above support.
However, Gold continues to show more strength, holding structure more cleanly and staying resilient above key short-term levels.
This parallel move between a risk asset (ETH) and a defensive one (Gold) suggests a market in transition: strength rotating, but not breaking.
Bias: Short-term neutral-to-bullish, Gold firm, ETH needs confirmation.
Always take profits and manage risk.
Interaction is welcomed.
Gold’s Correction: The Calm Before the Next Wave🟡 Gold’s Correction: The Calm Before the Next Wave 🟡
The golden bull just took a breather — and this chart screams opportunity, not panic.
After tagging the $4,380 high, XAUUSD has retraced cleanly to the 0.618 Fibonacci zone (~$3,995), right at the heart of strong historical demand.
We’re now seeing:
✅ A tight falling channel forming a classic bullish flag
✅ Heavy volume node at $4,000 acting as support
✅ RCI oversold across all timeframes — the last time this happened, gold ripped nearly $400.
💬 My read:
The weak hands are selling. Smart money is quietly loading.
As long as $3,990 holds, the risk/reward here is golden.
🎯 Targets
First breakout: $4,165 (Fib 0.786 / channel top)
Next wave: $4,380 retest
Extension: $5000 if momentum confirms
🛡️ Stop: Below $3,880
💰 Reward potential: 3–4x
🚀 Accumulating here before the breakout.
Gold’s next leg could be the one everyone wishes they hadn’t missed.
#Gold #XAUUSD #Commodities #Fibonacci #RCI #VWAP #TechnicalAnalysis #BuyTheDip #TrendTrading #SmartMoney

COPPER - Following Gold?Hello TradingView Family / Fellow Traders. This is Richard, also known as theSignalyst.
📈 COPPER has been overall bullish, trading inside the rising wedge pattern in blue.
At present, COPPER is undergoing a correction phase and it is hovering around the lower bound of the wedge.
Moreover, it is retesting a massive support zone marked in green.
🏹 Thus, the highlighted blue circle is a strong area to look for buy setups as it is the intersection of the green support and lower blue trendline acting as a non-horizontal support.
📚 As per my trading style:
As #COPPER approaches the blue circle zone, I will be looking for bullish reversal setups (like a double bottom pattern, trendline break , and so on...)
📚 Always follow your trading plan regarding entry, risk management, and trade management.
Good luck!
All Strategies Are Good; If Managed Properly!
~Rich

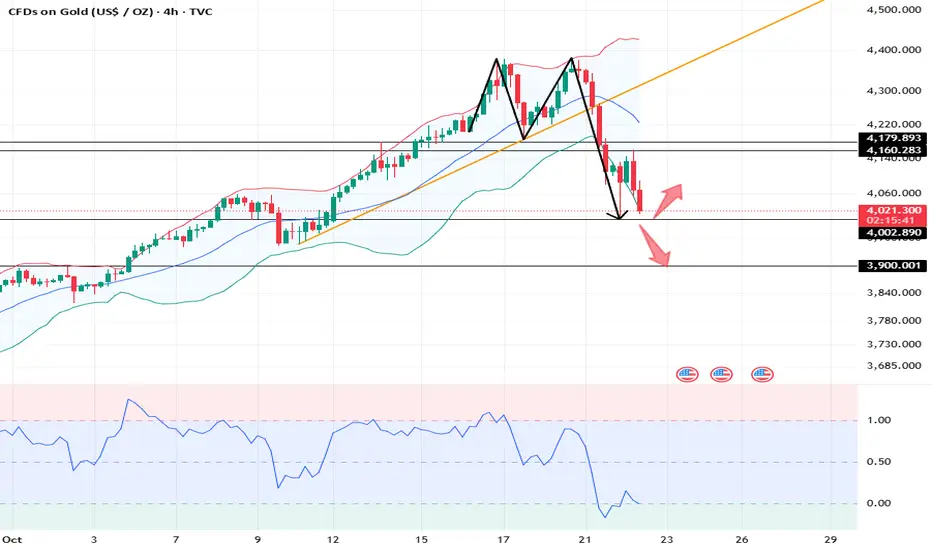
Double Top Confirmed! Is Gold About to Fall Deeper?As expected from my previous idea , Gold touched its target of $4,183 ( the double top pattern’s target(Small) ). Before reaching that target, it had some ups and downs over the past few days, mainly due to the ongoing US-China tensions .
Gold is trading near a Support zone($4,193 – $4,156) .
From a classical technical analysis perspective, it’s forming a clear double top pattern on the 1-hour timeframe . There’s also a regular bearish divergence (RD-) visible between the two peaks of the double top.
From an Elliott Wave theory standpoint, it looks like Gold has started its corrective wave. If the Support zone($4,193 – $4,156) and the double top pattern’s neckline break , we can expect further downside .
I expect that after breaking the Support zone($4,193 – $4,156) and the neckline , Gold could drop at least to around $4,083(First Target) .
Second Target: $4,057
Stop Loss(SL): $4,385(Worst)
Note: Keep in mind that given the ongoing US-China tensions, any news could invalidate this analysis. So it’s more important than ever to manage your risk carefully these days.
Please respect each other's ideas and express them politely if you agree or disagree.
Gold Analyze (XAUUSD), 1-hour time frame.
Be sure to follow the updated ideas.
Do not forget to put a Stop loss for your positions (For every position you want to open).
Please follow your strategy; this is just my idea, and I will gladly see your ideas in this post.
Please do not forget the ✅ ' like ' ✅ button 🙏😊 & Share it with your friends; thanks, and Trade safe.

Gold closes in on 4KThe volatility in gold continues. The metal fell a further 2.6% to close in on $4,000, extending drop from Monday's all-time high to over 8% amid profit-taking and dollar strength. It had staged a decent bounce yesterday but that turned out to be a dead-cat. Anyway the area between around 4000 to 4022 is where the trend line, round 4K handle and 21 day exponential all converge. Needs to hold to keep bulls interested in dip buying. Below 3944, the most recent low prior to the breakout above 4K, things will turn bearish.
By Fawad Razaqzada, market analyst with FOREX.com

GOLD: Long Trade with Entry/SL/TP
GOLD
- Classic bullish setup
- Our team expects bullish continuation
SUGGESTED TRADE:
Swing Trade
Long GOLD
Entry Point - 4048.5
Stop Loss - 4029.6
Take Profit - 4083.6
Our Risk - 1%
Start protection of your profits from lower levels
Disclosure: I am part of Trade Nation's Influencer program and receive a monthly fee for using their TradingView charts in my analysis.
❤️ Please, support our work with like & comment! ❤️

Gold Consolidates After Biggest One-Day Drop Since 2013GOLD | Price Slips After Tuesday’s Massive Selloff
Gold remains under pressure after recording its largest one-day drop since 2013, falling more than 6% (≈ $250).
Despite the steep decline, long-term fundamentals such as central-bank demand and geopolitical uncertainty continue to provide underlying support.
For now, the metal is consolidating between $4,011 and $4,056, awaiting a decisive breakout.
A 15-minute close below $4,011 would confirm continuation toward $3,979 → $3,945 → $3,894.
A close above $4,057–$4,074 would trigger a bullish reversal, targeting $4,101 → $4,162.
Pivot Line: 4,011
Support: 3,979 · 3,945 · 3,894
Resistance: 4,056 · 4,075 · 4,101
previous idea:

GOLD (XAUUSD): Important Supports to Watch
As Gold continues an extended correction,
here are significant supports to watch.
Horizontal Structures
Support 1: 4040 - 4060 area
Support 2: 3942 - 3959 area
Support 3: 3870 - 3897 area
Support 4: 3766 - 3831 area
Support 5: 3691 - 3735 area
Vertical Structures
Vertical Support 1: Rising trend line
A trend line and horizontal Support 1 compose a demand zone.
That will be the first potentially significant zone for a pullback.
In case of its breakout, the price will reach at least Support 2 then.
❤️Please, support my work with like, thank you!❤️
I am part of Trade Nation's Influencer program and receive a monthly fee for using their TradingView charts in my analysis.

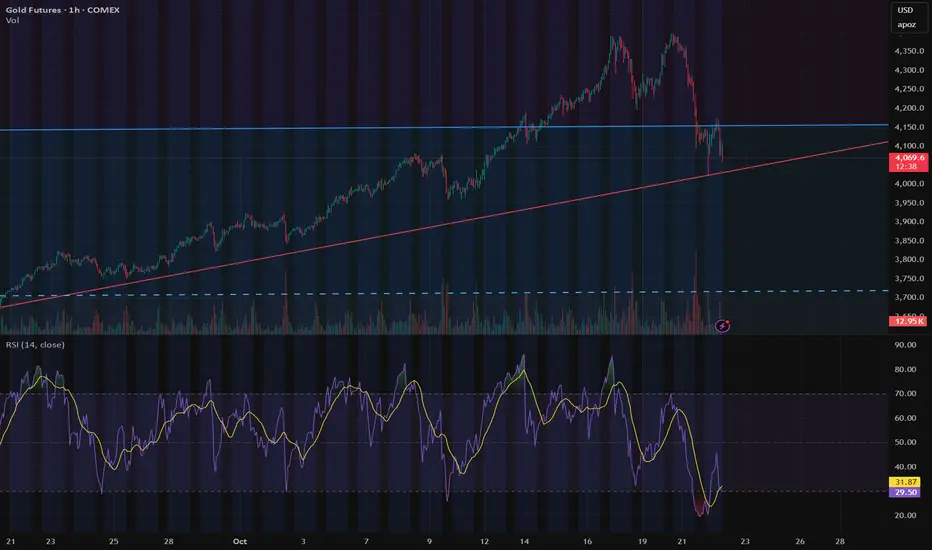
Gold’s Pullback: The Dip Everyone’s Afraid to Buy🏆 Gold’s Pullback: The Dip Everyone’s Afraid to Buy 🏆
Gold just gave us the pullback we’ve been waiting for. After an incredible vertical run to $4,400, price has tapped right back into long-term trend support — exactly where past rallies have launched from.
Zoom out on the weekly channel and it’s clear:
Momentum spikes look scary, but historically they’ve reset just before the next leg up.
Volume confirms conviction — this isn’t a fade; it’s a reload.
On the 4H chart, buyers are already defending the trendline like clockwork.
On the 15M, we’re seeing the first signs of stabilization.
💡 My take:
This isn’t the time to panic — it’s the time to position.
“Buy fear, sell greed” wasn’t written for stocks; it was written for gold.
🎯 Watch zone: $4,000–$4,050 — that’s my reload range.
Next resistance: $4,400 → $4,800 if the structure holds.
📈 I’m buying the dip. Are you brave enough to?
#Gold #GC1 #Comex #Futures #BuyTheDip #Macro #Commodities #TrendFollowing #TechnicalAnalysis
What do you think 4085 gold buys or sellsBased on recent trading ideas for Gold on TradingView, the price level around 4085 is often cited as a key technical level:
Support/Buy Zone: Many analyses view the area around $4085 - $4090 as a critical support level or a demand zone. If the price drops to this level and shows signs of reversing (like a bullish candlestick pattern), it's often seen as a good opportunity to BUY (go long), expecting the price to rebound.
Invalidation/Sell Trigger: Conversely, if the price breaks clearly and holds below $4085 (or the nearby support zone), it is often considered an invalidation point for the bullish view. This breakout below support would typically signal a shift to a bearish bias, leading traders to consider SELL (go short) positions with targets at lower levels.
Decision Zone: In some cases, $4085 is part of a larger "Decision Zone" (e.g., $4085–$4125), where the market's reaction dictates the next short-term trend.
In summary, a "4085 gold buys or sells" TradingView idea is likely suggesting:
BUY (Long) if the price holds above or bounces from $4085.
SELL (Short) if the price breaks and closes convincingly below $4085.

GBP/JPY 2-hour chart...GBP/JPY 2-hour chart, here’s what’s clear:
The pair has broken out of a falling-wedge / descending-channel pattern, which usually signals a bullish reversal.
Price is trading around 202.15–202.65, currently testing above the wedge resistance and sitting near the Ichimoku cloud top, confirming early bullish structure.
My marked a measured move projection (blue arrow) — that projection aligns well with a typical wedge breakout target.
📈 Target Analysis
Breakout confirmation zone: Above 202.50–202.80.
Target Point: Around 205.50–206.00 (the level drawn on my chart).
This zone matches both the top of the previous swing and the measured-move objective of the wedge.
📊 Summary
Type Price Level Notes
Entry Zone 202.50–202.80 On bullish breakout confirmation
Main Target 205.50 – 206.00 Projected wedge target
Stop-Loss (for buy) 201.00 – 200.80 Below cloud & wedge retest
Support to watch 201.20 Should hold to maintain bullish bias
✅ Final Target: 205.50 – 206.00 JPY
