Gold

A Bearish XAUUSD Setup You Can’t Afford to MissOANDA:XAUUSD has dropped sharply, reflecting the complete dominance of sellers who continue to push the market lower with strong bearish momentum.
After the decline, the price paused and then began to rise slowly, forming a familiar wedge pattern, a classic signal of trend continuation. Buyers attempted to regain control, but the buying pressure was weak, and every rally was quickly met with renewed selling.
Eventually, the price broke below the pattern with significant pressure and is now retesting the breakout area. This confirms that the market remains bearish, with limited chances of a meaningful reversal. If the price continues to break below this zone, further declines are likely to follow.
I anticipate the next bearish wave could reach around 3,885, aligning with the broader downtrend.
This analysis is for educational purposes only and does not constitute trading advice or financial recommendation.

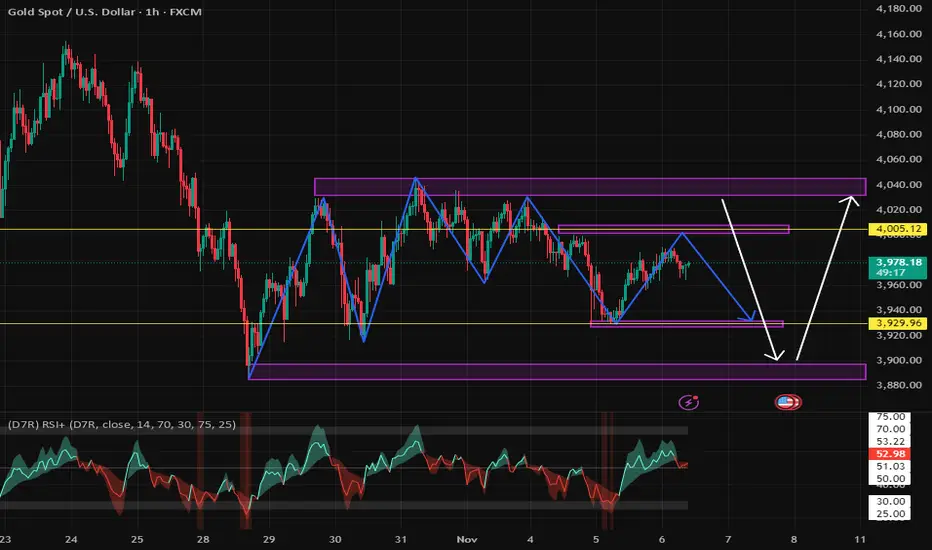
Possible Bullish Turn for GoldOk, some things seems to be changing. The activity that lacking to end US shutdown maybe over. Will it be fruitful is a very big question. If the shutdown end, this will be positive for gold because of the incoming liquidty flowing to the banks. However the first pricing could be in reverse.
I have no clear plan yet and might not find time to immidiately write here when I buy so I'm writing this warning here. If everything go smoothly, gold might target 4130 or maybe 4190 in the coming days, but I'm currently not in position yet.

We firmly go long when the market is blindly shorting.#XAUUSD OANDA:XAUUSD TVC:GOLD
From the hourly chart, the short-term gold price has broken through the resistance of the triangle pattern boundary. The market has made its choice, and it is clear that we bulls have won. Therefore, we can continue to execute our trading strategy for the next step. Wait for a pullback to 3995-3985 to buy again, with an initial target of 4020-4030.

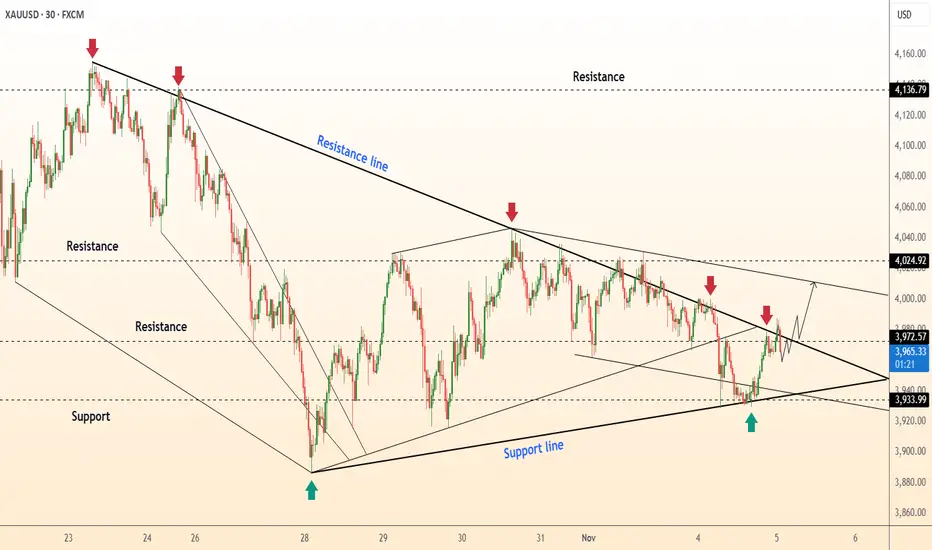
DeGRAM | GOLD is testing the resistance line📊 Technical Analysis
● XAU/USD has been respecting the support line at $3,933.99 and is approaching the resistance line near $4,024.92. The market has shown upward momentum after recent bounces from support, suggesting a possible breakout to higher levels.
● The price action is currently inside a rising channel, and a breakout above the resistance could lead to a move towards the next key resistance level.
💡 Fundamental Analysis
● A weaker USD and strong safe-haven demand could provide additional bullish support for gold in the near term.
✨ Summary
● Key levels to watch: Support at $3,933.99, resistance at $4,024.92. A breakout above $4,024.92 could target $4,046.60 for the next move.
-------------------
Share your opinion in the comments and support the idea with a like. Thanks for your support!
DXY Daily Outlook — Bullish Order Flow Toward Equal HighsHello traders 👋
On the DXY daily chart, we can clearly see that price showed a strong bullish reaction after grabbing liquidity below 96.37, initiating a bullish order flow that, in my view, is still in progress.
The equal highs above the current price act as a potential draw on liquidity and serve as my first bullish target.
However, keep an eye on the trendline liquidity forming below the current price — there’s a possibility that price may sweep this liquidity before continuing higher.
Overall, my bias remains bullish for now.
💌It is my honor to share your comments with me💌
🔎 DYOR
💡Wait for the update!

Stop!Loss|Market View: AUDUSD🙌 Stop!Loss team welcomes you❗️
In this post, we're going to talk about the near-term outlook for the AUDUSD currency pair☝️
Potential trade setup:
🔔Entry level: 0.64398
💰TP: 0.63482
⛔️SL: 0.64782
"Market View" - a brief analysis of trading instruments, covering the most important aspects of the FOREX market.
👇 In the comments 👇 you can type the trading instrument you'd like to analyze, and we'll talk about it in our next posts.
💬 Description: The likelihood of a strengthening USD in the medium term remains, meaning major pairs will likely remain under pressure from the American currency until the end of the year. One of the best alternatives for the strength of the US dollar seems to be the AUDUSD. Currently, the most promising sell scenario appears to be a breakout of support near 0.64480, with downside targets at 0.64000 and 0.63500.
Thanks for your support 🚀
Profits for all ✅
❗️ Updates on this idea can be found below 👇

Gold trade in a narrow range with lack of majors dataGold is consolidating within a range of 3900-4500 due to geopolitical easing, but the US government's prolonged shutdown has now reached its longest duration, which could cost the US economy $15 billion per week and cloud the economic data, such as the labor market, which is currently weakening.
Meanwhile, the ADP Employment Change shows the private sector gained 50k jobs in October, easing concerns over the labor market. However, the ADP number usually diverges from the official NFP data, and it might not provide a clearer picture of the US labor market.
Gold prices could become more volatile when US government operations resume, providing clearer data.
Elsewhere, central banks are expected to build up their gold reserves in 3Q 2025 with an annual growth rate of 28%, providing support for the gold price.
Technically, after a long rally since Aug, the XAUUSD tends to retreat and trade in a narrow range to absorb the profit-taking pressure. XAUUSD breaches the EMA21, and trading between both flattening EMAs signals further consolidation.
By Van Ha Trinh - Financial Market Strategist at Exness

GOLD rises despite strong ADP jobs dataOANDA:XAUUSD prices rose more than 1% on Wednesday to $3,978.92 an ounce, despite better-than-expected U.S. private-sector jobs data, reflecting cautious investor sentiment amid high stock market valuations and uncertainty surrounding President Donald Trump’s tariff policies, which are reshaping the global economic landscape.
The ADP employment report showed that the private sector added 42,000 jobs in October, well above the forecast of 28,000, reinforcing the view that the US labor market remains strong and therefore the Fed can delay rate cuts. However, the rise in real yields has not been enough to dampen demand for havens, as investors view gold as a hedge against a potential correction in risk assets.
Christian Borjon Valencia (FXStreet) said gold prices were supported by dovish comments from several Fed officials. Meanwhile, Jim Wyckoff (Kitco Metals) said “safe haven demand is back” as investors “are increasingly concerned about the AI stock bubble and the overvaluation of the US market.”
Financial markets are in a wait-and-see mode as the US Supreme Court holds a hearing on the legality of tariffs imposed by President Trump under the International Emergency Economic Powers Act. An adverse ruling could result in the government having to repay more than $100 billion in tariffs and limit the White House’s ability to direct trade policy, potentially sending shockwaves through the dollar and commodity markets.
Conservative justices, including Chief Justice John Roberts and Neil Gorsuch, have questioned whether the president has the authority to unilaterally impose a “tax on Americans” without congressional approval. A decision against Trump could weaken his central “economic weapon” and drive money into risk-free assets like gold.
On the political prediction market Kalshi, the likelihood of the court backing Trump has fallen from nearly 50% to just about 30%, reflecting growing skepticism about the sustainability of the tariff strategy.
These factors combine to suggest that OANDA:XAUUSD is consolidating its position in a transitional period between monetary policy and political uncertainty, a period in which the Fed is cautious, Washington faces regulatory risks and its power structure is challenged.
Technical Analysis OANDA:XAUUSD
Gold prices are entering a narrow consolidation phase around the $3,940–$3,980/ounce range, after a correction from the $4,380 peak. The daily chart shows that the short-term downtrend channel structure is still maintained, but the downside momentum has weakened significantly. The $3,896 (0.5 Fib) zone continues to act as a key support, while the $3,972–$4,055 resistance zone (0.382 Fib and MA20) is the decisive threshold for the next trend.
The RSI is slowly recovering from the neutral zone and is showing signs of converging with the moving MA, implying that selling pressure is drying up and the market may form a short-term bottom. If the price breaks out decisively at $3,972, the current accumulation pattern could be completed, opening a recovery cycle towards $4,128, the 0.236 Fib mark of the previous decline.
The conditions for a new bull run lie in gold prices remaining stable above the $3,900 support zone, combined with improved cash flows and expectations of the Fed shifting to a more dovish stance in December. In that case, the current consolidation zone could become the basis for a new rally, rather than just a technical pullback.
SELL XAUUSD PRICE 4022 - 4020⚡️
↠↠ Stop Loss 4026
→Take Profit 1 4014
↨
→Take Profit 2 4008
BUY XAUUSD PRICE 3948 - 3950⚡️
↠↠ Stop Loss 3944
→Take Profit 1 3956
↨
→Take Profit 2 3962

XAUUSD H4 | Bullish Bounce OffXAU/USD has bounced off the buy entry at 3,945.45, which is a pullback support and could rise from this level to the upside.
Stop loss is at 3,840.07, whic his a pullback support.
Take profit is at 4,136.36, which is a pullback resistance that aligns witht he 50% Fibonacci retracement.
Stratos Markets Limited (tradu.com ):
CFDs are complex instruments and come with a high risk of losing money rapidly due to leverage. 68% of retail investor accounts lose money when trading CFDs with this provider. You should consider whether you understand how CFDs work and whether you can afford to take the high risk of losing your money.
Stratos Europe Ltd (tradu.com ):
CFDs are complex instruments and come with a high risk of losing money rapidly due to leverage. 70% of retail investor accounts lose money when trading CFDs with this provider. You should consider whether you understand how CFDs work and whether you can afford to take the high risk of losing your money.

Poteential bullish reversal?The Gold (XAU/USD) is reacting off the pivot, which is a pullback support and could bounce to the 50% Fibonacci resistance.
Pivto: 3,952.85
1st Support: 3,800.21
1st Resistance: 4,148.52
Disclaimer:
The above opinions given constitute general market commentary, and do not constitute the opinion or advice of IC Markets or any form of personal or investment advice.
Any opinions, news, research, analyses, prices, other information, or links to third-party sites contained on this website are provided on an "as-is" basis, are intended only to be informative, is not an advice nor a recommendation, nor research, or a record of our trading prices, or an offer of, or solicitation for a transaction in any financial instrument and thus should not be treated as such. The information provided does not involve any specific investment objectives, financial situation and needs of any specific person who may receive it. Please be aware, that past performance is not a reliable indicator of future performance and/or results. Past Performance or Forward-looking scenarios based upon the reasonable beliefs of the third-party provider are not a guarantee of future performance. Actual results may differ materially from those anticipated in forward-looking or past performance statements. IC Markets makes no representation or warranty and assumes no liability as to the accuracy or completeness of the information provided, nor any loss arising from any investment based on a recommendation, forecast or any information supplied by any third-party.

Gold 8H Forecast- Price will continue to sell off🔥 GOLD (XAU/USD) – 8H Forecast 🔥
Alright fam, let’s break this one down nice and clean 👇
🧠 Bias : Short-term bearish → Long-term bullish
Gold’s cooking a classic pullback setup right now — we’re in a mid-range squeeze after that massive rally and rejection from the external BSL (Buy-Side Liquidity) at the top.
📉 Technical Breakdown
Price broke structure at the top and started forming lower highs under that descending trendline.
We’ve already taken external SSL (Sell-Side Liquidity) below recent lows, showing signs of a cleanup phase.
The current compression looks like a bearish continuation pattern that could push into the 8H demand zone around $3,750 – $3,800.
That zone also aligns perfectly with the 200 EMA, making it a juicy liquidity magnet before any major reversal.
🎯 Potential Play
Short-term:
Watch for a breakdown below current structure → ride it down to that $3,750 demand area.
Ideal short confirmation = rejection at the $3,950 – $4,000 supply zone.
Medium to Long-term:
Once price taps that HTF demand, expect bulls to step back in hard.
A clean rebound from there could launch us toward $4,300 – $4,500, following the red arrow projection. 🚀
⚙️ Risk Management
Avoid early longs until the sweep and reaction from demand confirm a shift.
Keep stops tight above the 8H swing high if shorting.
Wait for structure + volume confirmation before flipping bias long.
🧩 Summary
Gold’s chilling mid-range after a big rally — expect one more dip into demand before the next bullish leg ignites. HTF structure remains intact, but we’re not done with the correction yet. Patience pays here.

XAU/USD – Price Facing Strong Resistance, Potential Pullback SetGold continues to move within a tight range near $3985–$4015, showing signs of exhaustion after the recent corrective rebound. The current structure on the H1 timeframe forms a potential lower high pattern, suggesting a short-term bearish reaction could unfold.
Key Technical Levels
Resistance zone: 4015 – 4055
Immediate resistance: 4005
Support zone: 3915 – 3880
Technical Outlook
Price is testing the neckline of a bearish continuation pattern while staying below the previous distribution zone.
If gold fails to break and close above 4015, the probability of a downward continuation toward 3915 increases.
The RSI is flattening near the mid-range, showing loss of bullish momentum, while the price remains under the EMA cluster, reinforcing the short bias.
Trading Strategy
Sell zone: 4005 – 4015
Stop loss: Above 4055
Take profit: 3920 – 3885
Alternative scenario: Only if price closes decisively above 4055, short-term buyers may re-enter aiming for 4090–4100.
This setup favors sellers while gold remains capped below resistance. Watch for confirmation from intraday rejections or bearish candlestick patterns near the 4000–4015 area before executing.
Follow for more daily gold trading strategies and save this post if you find it helpful.

Gold. 1 more leg down. 6/Nov/25Xauusd 1 more leg down before surging..What "trigger" the surge? coming NFP?

XAUUSD: Market Analysis and Strategy for November 5thGold Technical Analysis:
Daily Resistance: 4080, Support: 3890.
4-Hour Resistance: 4035, Support: 3930.
1-Hour Resistance: 4000, Support: 3960.
The bullish outlook over the long term remains intact, but market correction and consolidation are warranted. The daily candlestick chart shows a slowing decline in spot gold, with the price entering a range-bound consolidation. Multiple moving averages above are hindering any short-term rebound. Watch for MACD/KDJ indicator corrections. Resistance levels to watch are around 4000 and 4030 respectively. The short-term downside risk is relatively high.
Based on the 1-hour candlestick chart, spot gold is in a rebound phase with a potential for continuation. The bottom on the 1-hour chart is gradually moving upwards, the trading range is narrowing, and the Bollinger Bands are converging. Support levels to watch are around 3955/3945. Short-term market momentum is weak; a strategy of buying low and selling high is recommended.
Trading Strategy:
SELL: 3993~4000 (near)
BUY: 3945~3940 (near)

GOLD: First, it needs to rebound to around 4000, then sell.Gold's wide-range fluctuation cycle is expected to continue, with the daily chart showing cyclical ups and downs. Prices are adjusting around the RSI indicator's midline, and the 10-day and 7-day moving averages are closely aligned, currently near the 5-day moving average. The 4-hour chart shows the Bollinger Bands narrowing, with prices consolidating within the lower half of the band. The hourly RSI indicator is consolidating around 50. Gold is expected to maintain a wide range of fluctuations, and the larger-cycle downward correction is not yet over.
Gold rebounded yesterday during the US session, reaching a high near 3990. This rebound has brought the price back into the trading range, but it doesn't negate our strategy of selling on rallies. Gold is currently under pressure below the 4000 level, with short-term bears holding the upper hand. The 4000 level has become a key dividing line between bulls and bears; as long as it is not broken, the downtrend will continue.
The 1-hour chart for gold remains in a weak, oscillating pattern. The current market is characterized by large swings, but no clear trend. Yesterday's ADP report did not cause significant volatility in gold, so we expect continued consolidation. We will sell at resistance levels.
Key Levels:
First Support: 3958, Second Support: 3930, Third Support: 3912
First Resistance: 3988, Second Resistance: 4005, Third Resistance: 4028
Gold Intraday Trading Strategy:
Buy: 3925-3930, SL: 3915, TP: 3950-3960;
Sell: 4000-4005, SL: 4015, TP: 3980-3970;
More Analysis →
Gold/Oil Signaling Market Is In A Super Bubble Gold = Fear
Oil = how strong the economy is.
Except for COVID we have never seen such an extreme reading. Yet people are buying up stocks like we will never again be able to produce another stock again as long as we live!
Tulips!
Here are just a few of the factors to consider that make this indicator important.
Why This Indicator Matters: Key Factors at a Glance
Gold’s Surge Signals a Shift
Gold has soared nearly 60% year-to-date, adding a staggering $10 trillion in market capitalization. This rally effectively erases all the stock market gains made since May 2021, including those driven by AI enthusiasm and speculative tech runs.
USD Can Only Be Measured Against Gold
As the world’s reserve currency, the U.S. dollar’s real value is best gauged in terms of gold. This is a critical point—because when gold rises this dramatically, it reflects monetary inflation. A large part of the stock market rally has been driven by an expanding money supply, not true value creation.
Curiously, this inflation hasn’t shown up in oil prices, which have collapsed, despite geopolitical risks. More on that below.
The Dollar’s Worst Year in Decades
2025 marks one of the most significant declines for the U.S. dollar in recent history. Its role as the world reserve currency (WRC) has diminished—from 85% in the 1970s to just 50% today. Trade wars and tariffs are only accelerating this trend.
Monetary Inflation Drives Stock Prices
Stock markets are being lifted by monetary inflation, not organic growth. Stocks can be created endlessly—unlike gold. That makes gold a true inflation benchmark. The stock market’s rise is, in large part, a mirage, reflecting debased currency, not real productivity.
Oil Isn’t Behaving as Expected—Why?
Typically, when the dollar weakens, oil prices rise—because more dollars are needed to buy the same barrel of oil. But right now, oil prices are soft. Why?
Global demand is weak, outpaced by supply. Even the Russia-Ukraine war hasn’t changed that dynamic. In fact, Russia is now importing gasoline, as Ukrainian forces continue to target and disable refining capacity.
Here’s why this matters: when oil wells are opened, they can't just be turned off. If the refiners are destroyed and the oil has nowhere to go—it’s wasted. That’s a strategic win for Ukraine.
The Disconnect Between Stock Prices and Profits
While inflation has pushed stock prices higher, it hasn’t translated into equivalent profit growth.
Example: If a stock goes from $10 to $20 due to inflation, you'd expect earnings to go from $1 to $2 to maintain the same P/E ratio. Instead, the earnings yield is just 3.2%—a historical low. That’s a major red flag.
As pilots would say: WTF, over?
Here’s the likely explanation:
The money hasn’t reached consumers—it's concentrated in the hands of wealthy savers and leveraged investors, who are buying more stocks to sell to the next buyer willing to lever up even more. It’s a classic feedback loop—and a superbubble reminiscent of the tulip mania era.
The Smart Money Knows What's Coming
As this imbalance grows more obvious, central banks and institutional investors are quietly increasing their gold holdings—well above the pace of supply growth.
So when Gold/Oil (two important commodities) completely disconnect like this, and Gold explodes up like this, you'd better take notice!
Lastly, it takes 100 ounces to buy a new home. Last time this occurred was in 1978 ish, 2011, and now!
Debt to GDP in 76 was 33%, 2011 was 99% and today 126% It is not the same animal as the past.
GTFO & STFO! No matter where the prices for stocks go!
CAUTION!!!


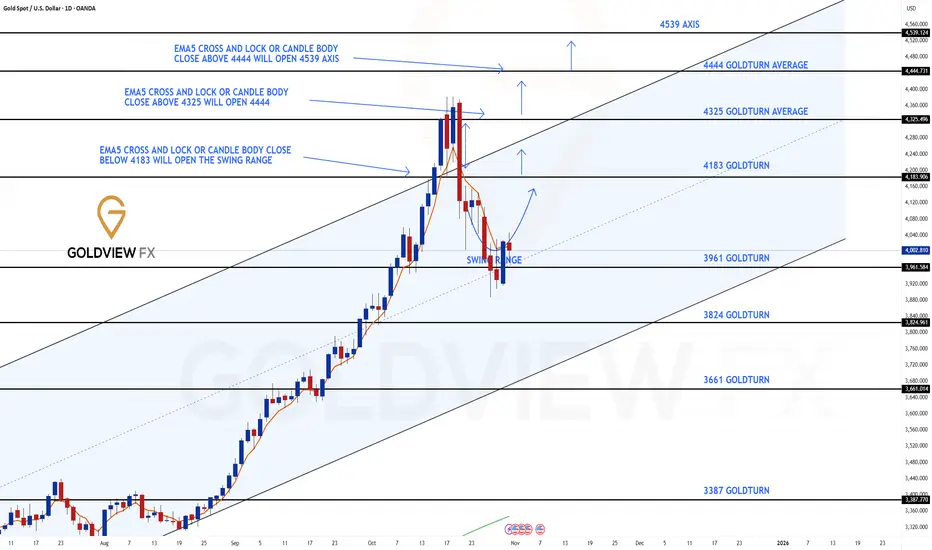
GOLD DAILY CHART ROUTE MAP Hey everyone,
Please review our Daily Chart Route Map, now featuring updated levels for tracking Golds movement.
We continue to track our refreshed proprietary Goldturn Channel, our unique method for constructing ascending channels. Price action is now testing the swing range and the swing range seems to be holding support as expected. This swing range support also falls inline with the channel half line providing stronger support.
As long as ema5 remains above the swing zone we expect price to play between this range until the full long term swing is completed into 4183. An ema5 break below the swing range will open the lower channel floor for test, currently sitting at 3824
As always, we will keep you all updated with regular updates throughout the week and how we manage the active ideas and setups. Thank you all for your likes, comments and follows, we really appreciate it!
Mr Gold
GoldViewFX
Gold Price Targets 3990 After Support ReboundGold (XAU/USD) is trading around 3966, showing bullish momentum after rebounding from the support zone near 3928. The price is moving within an ascending channel, with a short-term target set at 3990. A breakout above this level could push prices toward the next resistance near 4006.

GOLD climbing.GOLD is starting to make it's way up in the NY session after news. Looking for new Higher Highs and Higher lows.

XAU/USD) Bearish trend analysis Read The captionSMC Trading point update
Technical analysis of XAU/USD (Gold Spot) – Bearish Continuation Setup
Timeframe: 1H (Capital.com)
Concepts: Smart Money Concepts (SMC), Trendline Break, FVG & EMA Confluence
---
Market Structure Overview
The uptrend structure was recently broken, confirming a shift to bearish order flow.
Price has broken the ascending trendline, retested near the FVG / premium retracement zone, and is rejecting from the supply area.
The structure and EMAs both support further downside continuation.
---
Key Technical Elements
Retracement Zone (Short Entry Area):
0.5 – 0.79 Fibonacci levels align with the Fair Value Gap (FVG), showing potential for bearish mitigation.
Price currently trading near 0.62–0.705 level (premium zone).
EMA Confluence:
EMA-50 ≈ 3,992
EMA-200 ≈ 4,024
Both EMAs are above price, acting as dynamic resistance.
Trendline Break:
The ascending trendline has been decisively broken and retested, indicating trend reversal confirmation.
---
Targets
Immediate Target (0-level structure): 3,940 zone
Extended Bearish Target: 3,796 — marked as the final target point on the chart
---
Scenario Plan
1. Expect minor retracement to the FVG zone (3,990–4,010).
2. Watch for bearish confirmation (rejection or lower-timeframe BOS).
3. Target downside continuation to 3,796, completing the swing projection.
Mr SMC Trading point
---
Bias:
> Bearish – Market showing structure shift, EMA confluence, and FVG rejection setup aligning toward deeper downside movement.
---
please support boost 🚀 this analysis

GOLD A Fall Expected! SELL!
My dear subscribers,
GOLD looks like it will make a good move, and here are the details:
The market is trading on 3995.7 pivot level.
Bias - Bearish
My Stop Loss - 4003.2
Technical Indicators: Both Super Trend & Pivot HL indicate a highly probable Bearish continuation.
Target - 3983.4
About Used Indicators:
The average true range (ATR) plays an important role in 'Supertrend' as the indicator uses ATR to calculate its value. The ATR indicator signals the degree of price volatility.
Disclosure: I am part of Trade Nation's Influencer program and receive a monthly fee for using their TradingView charts in my analysis.
———————————
WISH YOU ALL LUCK
