Gold vs SilverGold approaching Oct 14 mitigation zone while Silver approaches Oct 10 mitigation zone.
Gold price action more bearish over london session but in higher timeframe, gold dropping less aggressively considering it's barely approaching Oct 14 price while Silver already well below its respective Oct 14 levels.
Will be a market execution idea based on which gets to its zone last.
Gold

Gold Double Top Forming – Correction Ahead?When an asset hits an All-Time High(ATH) , technical analysis can get a bit tricky because there’s no historical resistance above and the usual technical rules might have less impact. However, right now it seems like some technical principles are still visible on gold’s chart, at least on the 1-hour timeframe , and I’d like to share that with you.
At the moment, Gold has broken below the lower line of its ascending channel, the Support zone($4,320 – $4,279) , and the neckline of a Double Top Pattern . This could indicate the start of a short-term correction. Given how strong gold’s momentum has been in recent weeks, this correction might not last too long since gold remains very attractive globally.
From an Elliott Wave perspective , the formation of a double top pattern might signal the end of an impulsive wave and the beginning of a corrective phase .
I expect that in the next few hours, Gold could at least drop to the Double Top Pattern’s target around $4,183 . If Gold breaks the Support zone($4,193 – $4,156) , we could see a deeper correction .
Second target:$4,143
Stop Loss(SL): $4,385(Worst)
Please respect each other's ideas and express them politely if you agree or disagree.
Gold Analyze (XAUUSD), 1-hour time frame.
Be sure to follow the updated ideas.
Do not forget to put a Stop loss for your positions (For every position you want to open).
Please follow your strategy; this is just my idea, and I will gladly see your ideas in this post.
Please do not forget the ✅ ' like ' ✅ button 🙏😊 & Share it with your friends; thanks, and Trade safe.

Gold Tests Key Support of Double Top FormationGold is testing the neckline of the double-top pattern. The selloff has been sharp, so a clean break below support is unlikely today, even if it retreats below 4200. The base case is a short-term rebound toward the 4250–4270 zone before a potential break lower.

Gold Pullback Could Be the Next Buying OpportunityHello, traders, I want share with you my opinion about Gold. The market for Gold has been trading within a clear bullish structure, forming an ascending channel since breaking out from the earlier range near the 4,050–4,100 zone. The breakout from that consolidation led to strong upward momentum, with price making consistent higher highs and higher lows. Recently, the market faced strong selling pressure from the Seller Zone near 4,366, which aligns with the Resistance Level. After a retest of this supply area, price rejected and started a correction within the channel. The price is approaching the Buyer Zone around 4,205, which also coincides with the lower boundary of the ascending channel and the previous support level. This confluence makes the area significant for potential bullish reactions. I expect Gold to retest the Buyer Zone (4,205) and, if buyers show strength, a bounce toward 4,320–4,366 could follow. This would represent the continuation of the uptrend within the ascending channel. However, if price breaks below 4,205, it would signal a possible shift in structure and open the door for a deeper correction toward the 4,100 area. Please share this idea with your friends and click Boost 🚀

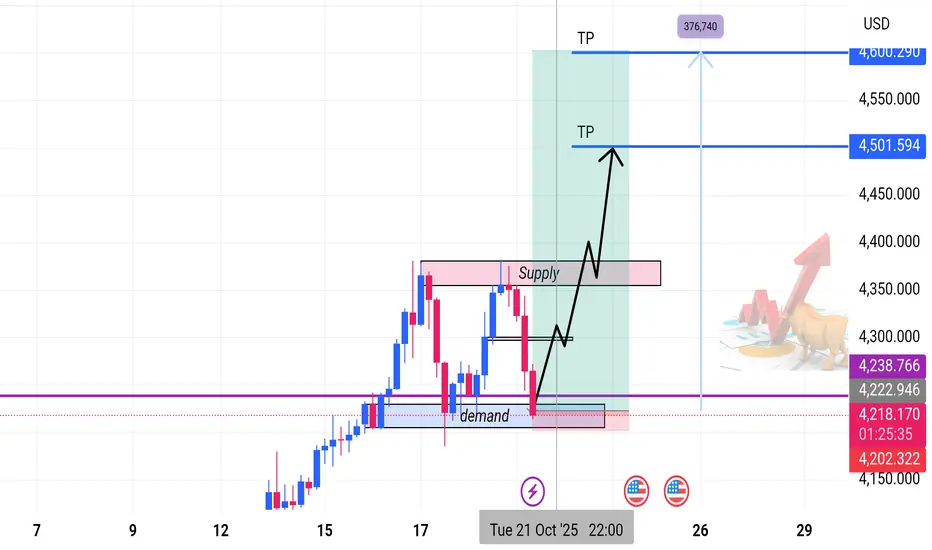
Bullish Continuation from Demand Zone | 4H SetupOverview:
Gold is maintaining a strong bullish structure on the 4-hour timeframe, forming consistent higher highs and higher lows.
Recently, price tapped into a key Demand Zone, showing a clear rejection and early signs of buyer re-entry — signaling a potential continuation of the uptrend.
Technical Outlook
• Trend: Bullish market structure intact.
• Current Price: ~4,230.34
• Demand Zone (Buy Zone): Price has bounced from a major demand area — indicating renewed buying pressure.
• Reversal Confirmation: Rejection wicks and bullish candles confirm demand reaction.
• Supply Zone (Resistance): Overhead supply remains the key obstacle. A break and close above it could trigger a strong rally toward the next resistance.
Trade Setup
Parameter Level (Approx.) Description
Entry (Buy Zone) 4,230.34 Reaction from demand zone
Take Profit 1 (TP1) 4,501.59 Conservative target
Take Profit 2 (TP2) 4,576.74 Extended target
Stop Loss (SL) ~4,200.00 Below demand zone
Market Outlook
As long as the demand zone holds, the bullish structure remains valid.
A confirmed break above the supply zone could invite strong momentum toward higher targets.
Failure to hold the demand base may trigger a corrective move lower — hence, risk management remains crucial.
Bias: 🟢 Bullish
Timeframe: 4H
Strategy: Supply & Demand | Market Structure | Price Action

Gold 1H – Can Gold Hold Above 4247 as Powell Takes the Stage?XAUUSD – Intraday Trading Plan | by Ryan_TitanTrader
📈 Market Context
Gold holds firm near $4,230, with traders cautiously awaiting U.S. Retail Sales data and Fed Chair Powell’s remarks later today.
After a series of softer inflation reports, market sentiment has tilted mildly dovish — yet the U.S. dollar remains steady as investors hesitate to price in early rate cuts.
The Fed’s tone today will be critical: a hawkish Powell could trigger short-term profit-taking on gold, while any dovish signals may reignite safe-haven bids.
Expect choppy intraday movement with liquidity sweeps around key zones before a confirmed directional move emerges.
🔎 Technical Analysis (1H / SMC Style)
• The structure remains bullish, confirmed by previous Breaks of Structure (BOS) and a Change of Character (ChoCH) earlier in the week.
• Price is now approaching a premium supply zone at 4247–4249, where potential short-term sell reactions could appear before retracement.
• Below, the discount demand zone at 4184–4186 aligns with prior BOS support and acts as a high-probability reaccumulation area.
• If price revisits the buy zone and forms bullish confirmation on M15, continuation toward new highs around 4260+ is favored.
🔴 Sell Setup: 4247 – 4249
SL: 4255 – 4257
TP targets: 4210 → 4195
🟢 Buy Setup: 4184 – 4186
SL: 4174
TP targets: 4210 → 4245 → 4260+
⚠️ Risk Management Tips
• Wait for M15 BOS/ChoCH confirmation before executing either setup.
• Watch for volatility spikes around Powell’s speech and U.S. Retail Sales release — spreads may widen.
• Consider partial profits at intra-day liquidity points and trail stops once structure confirms.
✅ Summary
XAUUSD maintains its bullish structure but may face a liquidity sweep above 4247–4249 before a deeper retracement into 4184–4186.
Institutional activity could drive accumulation near the discount zone if macro data supports dovish sentiment.
The intraday bias remains “Buy the Dip”, with tactical sells possible at premium resistance for short-term scalps.

Gold 1H – Slight Correction or Bullish Reaccumulation Ahead?XAUUSD – Intraday Trading Plan | by Ryan_TitanTrader
📈 Market Context
Gold extends its rebound near $4 250 as traders weigh the recent uptick in U.S. Treasury yields against growing expectations of a softer Federal Reserve stance.
After the latest mixed U.S. economic data, markets are leaning toward a mildly dovish outlook — rate-cut bets for early 2026 are gaining traction, while the dollar remains steady.
Today’s focus centers on U.S. housing-starts and jobless-claims data, which could steer short-term volatility.
A stronger-than-expected report may trigger temporary selling pressure on gold, while weaker figures could revive safe-haven demand and extend the rally toward $4 380 +.
Expect liquidity hunts before any clear directional move, as institutional players refine positions near the week’s range extremes.
🔎 Technical Analysis (1H / SMC Style)
• Market structure remains bullish, with previous Breaks of Structure (BOS) confirming continuation after the earlier accumulation phase.
• A short-term Change of Character (ChoCH) signals corrective movement — likely a liquidity sweep before the next bullish leg.
• Liquidity resting below $4 200 has already been taken, aligning with the discount zone around $4 196 – $4 198.
• A potential re-accumulation is forming; buyers may look for confirmation (M15 BOS/ChoCH) inside this demand zone.
• Upside liquidity targets cluster near $4 375 – $4 380, coinciding with a premium supply zone where sellers might re-enter.
🔴 Sell Setup
Entry: 4378 – 4376
Stop-Loss: 4386
Take-Profit Targets: 4325 → 4260
🟢 Buy Setup
Entry: 4196 – 4198
Stop-Loss: 4190
Take-Profit Targets: 4250 → 4370 → 4380 +
⚠️ Risk Management Tips
• Wait for lower-timeframe BOS/ChoCH confirmation before execution.
• Be cautious around U.S. macro data releases — spreads and volatility can widen temporarily.
• Use partial take-profits at nearby liquidity zones and trail stops once market structure confirms continuation.
✅ Summary
Gold maintains its bullish bias above $4 200 after sweeping liquidity.
A short-term correction could retest $4 196 – $4 198 for fresh buy entries, while the broader trend remains upward.
Only a clean structural break below $4 190 would invalidate the bullish continuation scenario.
FOLLOW RYAN FOR MORE USEFUL TRADING IDEAS!!!

XAG/USD – SELL Entry (H1- Wedge Breakout Pattern)The XAG/USD Pair, Price has been trading within a Wedge Pattern on the H1 chart, forming consistent higher highs and higher lows. Price action is now testing the upper boundary of the Pattern, signalling a possible breakout. OANDA:XAGUSD
✅Market Context:
1️⃣Strong Upward Structure Inside the Pattern.
2️⃣Buyers are showing strength near Resistance.
3️⃣Breakout above the Trendline indicates Momentum continuation toward higher zones.
✅Trade Plan:
Entry: Buy after Confirmed Breakout above the Resistance (H1 candle close above trendline or retest of the breakout).
💰Take Profit (TP): At the Key Zone – a Major Resistance area identified ahead.
🛑Stop Loss (SL): Below the Pattern Structure.
✅Psychological Discipline :
1️⃣Stick to plan – No Revenge Trades.
2️⃣Accept losing trades as Part of the Strategy.
3️⃣Risk only 1–2% of your account balance per trade.
💬 Support the community: If you found this useful, drop a 👍 like and share your thoughts in the comments!
⚠️ Disclaimer: This analysis is for educational purposes only and does not constitute financial advice. Forex trading involves high risk. Trade only with capital you can afford to lose and always do your own research.

GOLD Will Go Up From Support! Long!
Here is our detailed technical review for GOLD.
Time Frame: 15m
Current Trend: Bullish
Sentiment: Oversold (based on 7-period RSI)
Forecast: Bullish
The market is on a crucial zone of demand 4,269.79.
The oversold market condition in a combination with key structure gives us a relatively strong bullish signal with goal 4,298.66 level.
P.S
The term oversold refers to a condition where an asset has traded lower in price and has the potential for a price bounce.
Overbought refers to market scenarios where the instrument is traded considerably higher than its fair value. Overvaluation is caused by market sentiments when there is positive news.
Like and subscribe and comment my ideas if you enjoy them!

Gold Price Analysis – October 21, 2025Gold Price Analysis – October 21, 2025 | Key Zones & Potential Reversal Setup
Gold (XAU/USD) remains in a dominant bullish trend but is currently undergoing a corrective phase within its uptrend channel. On the H1 timeframe, the market has recently formed a double-bottom pattern, signaling potential exhaustion from sellers and a possible short-term reversal.
Technical Overview
Trend Direction: Bullish (still above the long-term ascending trendline)
Immediate Support Zone: 4,260 – 4,270
Demand Zone: 4,185 – 4,200 (confluence with previous base structure)
Resistance Levels: 4,300 – 4,320 and 4,340 – 4,360
Market Context: After a sharp correction from the recent high, gold is now retesting a key support area where a bounce could trigger a new bullish leg.
Pattern Insight
The “W” reversal structure (double bottom) on the chart suggests that buying pressure may be returning. A confirmed breakout above 4,304 could validate a bullish continuation, targeting the 4,340 – 4,360 region.
Trading Plan
Primary Scenario – Buy on Confirmation:
Wait for price to reclaim 4,300–4,304 with bullish candle confirmation.
Entry: 4,304
Target: 4,340 → 4,360
Stop Loss: Below 4,185
Alternative Scenario – Deeper Pullback:
If price fails to hold 4,260, a deeper retracement toward 4,185 could occur before the next impulse wave resumes.
Outlook
Overall momentum remains bullish as long as gold stays above the long-term trendline. The correction phase could soon give way to another upward expansion, provided the market maintains structure above 4,185.
Stay alert for confirmation signals before entering new long positions.
Follow for more daily gold insights and high-probability setups.

GOLD Sellers In Panic! BUY!
My dear followers,
This is my opinion on the GOLD next move:
The asset is approaching an important pivot point 4265.9
Bias - Bullish
Safe Stop Loss - 4248.0
Technical Indicators: Supper Trend generates a clear long signal while Pivot Point HL is currently determining the overall Bullish trend of the market.
Goal - 4300.3
About Used Indicators:
For more efficient signals, super-trend is used in combination with other indicators like Pivot Points.
Disclosure: I am part of Trade Nation's Influencer program and receive a monthly fee for using their TradingView charts in my analysis.
———————————
WISH YOU ALL LUCK

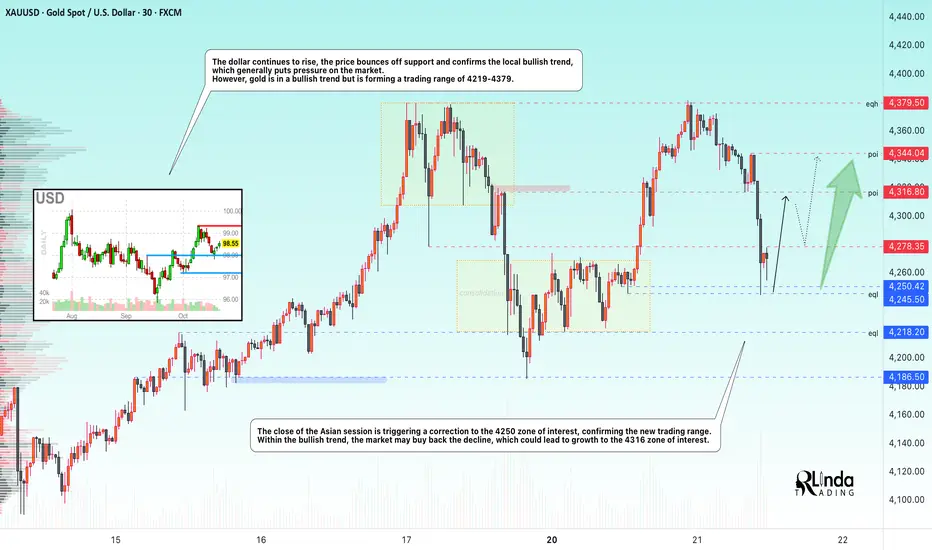
GOLD → The correction forms a trading range. Growth?FX:XAUUSD is adjusting to $4250 after retesting the all-time high of 4380. Short-term pressure is linked to hopes for an easing of the trade war between the US and China, but the bullish trend remains intact.
Key factors: Bentsen's meeting with the Chinese Vice Premier this week has revived optimism for a deal. The reduction in trade risks is temporarily supporting the USD. Hassett's statements about the imminent resumption of government work have reinforced risk-on sentiment.
Support for gold: The threat of tariffs rising to 155% from November 1 reminds us of the risks. Two rate cuts before the end of the year remain in focus. Friday's inflation data release and US corporate earnings reports are keeping demand for hedging alive.
Accordingly, the correction in gold is a temporary pause. The uptrend will remain unchanged as long as macro uncertainty persists.
Support levels: 4250, 4218
Resistance levels: 4278, 4316
Within the bullish trend, the price is forming a trading range. A retest of support could end in a recovery, with the fundamental background favoring the bulls. A retest of 4245 could trigger growth, as could a breakout of 4278 (closing above resistance).
Best regards, R. Linda!
GOLD Moonshot An idea for gold suggesting a massive further breakout of this triangle, similar to the first move up into the triangle.
The triangle encompasses a massive period of time for gold on this Weekly timeframe
I would call it an ascending triangle. Or a bullish rising wedge.
Hard to call the top.

GOLD M30 | Bullish Reversal in ProgressThe price is reacting off the buy entry at 4,266.82, which is a pullback support that lines up with the 61.8% Fibonacci retracement and could rise from this level to the take profit.
Stop loss is at 4,223.78, whichis a pullback support that lines up with the 78.6% Fibonacci retracement.
Take profit is at 4,323.15, whichis a pullback resistance that is slightly below the 61.8% Fibonacci retracement.
High Risk Investment Warning
Trading Forex/CFDs on margin carries a high level of risk and may not be suitable for all investors. Leverage can work against you.
Stratos Markets Limited (tradu.com ):
CFDs are complex instruments and come with a high risk of losing money rapidly due to leverage. 65% of retail investor accounts lose money when trading CFDs with this provider. You should consider whether you understand how CFDs work and whether you can afford to take the high risk of losing your money.
Stratos Europe Ltd (tradu.com ):
CFDs are complex instruments and come with a high risk of losing money rapidly due to leverage. 66% of retail investor accounts lose money when trading CFDs with this provider. You should consider whether you understand how CFDs work and whether you can afford to take the high risk of losing your money.
Stratos Global LLC (tradu.com ):
Losses can exceed deposits.
Please be advised that the information presented on TradingView is provided to Tradu (‘Company’, ‘we’) by a third-party provider (‘TFA Global Pte Ltd’). Please be reminded that you are solely responsible for the trading decisions on your account. There is a very high degree of risk involved in trading. Any information and/or content is intended entirely for research, educational and informational purposes only and does not constitute investment or consultation advice or investment strategy. The information is not tailored to the investment needs of any specific person and therefore does not involve a consideration of any of the investment objectives, financial situation or needs of any viewer that may receive it. Kindly also note that past performance is not a reliable indicator of future results. Actual results may differ materially from those anticipated in forward-looking or past performance statements. We assume no liability as to the accuracy or completeness of any of the information and/or content provided herein and the Company cannot be held responsible for any omission, mistake nor for any loss or damage including without limitation to any loss of profit which may arise from reliance on any information supplied by TFA Global Pte Ltd.
The speaker(s) is neither an employee, agent nor representative of Tradu and is therefore acting independently. The opinions given are their own, constitute general market commentary, and do not constitute the opinion or advice of Tradu or any form of personal or investment advice. Tradu neither endorses nor guarantees offerings of third-party speakers, nor is Tradu responsible for the content, veracity or opinions of third-party speakers, presenters or participants.

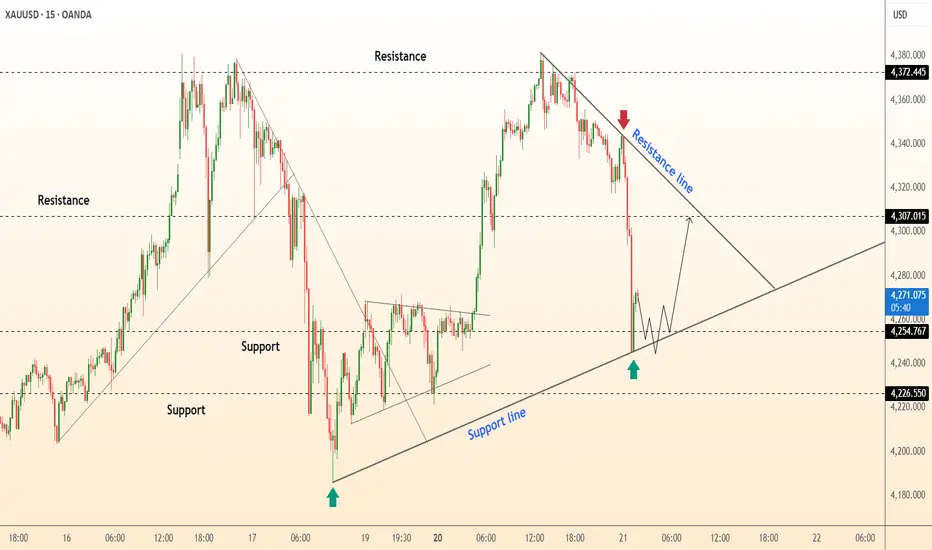
DeGRAM | GOLD held the support line📊 Technical Analysis
● XAU/USD rebounded from the 4,226 support area, confirming the strength of the rising trendline and signaling a potential short-term recovery.
● A break above 4,254 could trigger a bullish continuation toward 4,307, with the upward trajectory supported by a well-formed correction structure after the recent drop.
💡 Fundamental Analysis
● Gold gains support from weaker U.S. yields and safe-haven demand amid ongoing geopolitical concerns and Fed policy uncertainty.
✨ Summary
● Long bias above 4,226; targets 4,254–4,307. Trendline support and improving fundamentals favor a short-term bullish rebound.
-------------------
Share your opinion in the comments and support the idea with a like. Thanks for your support!
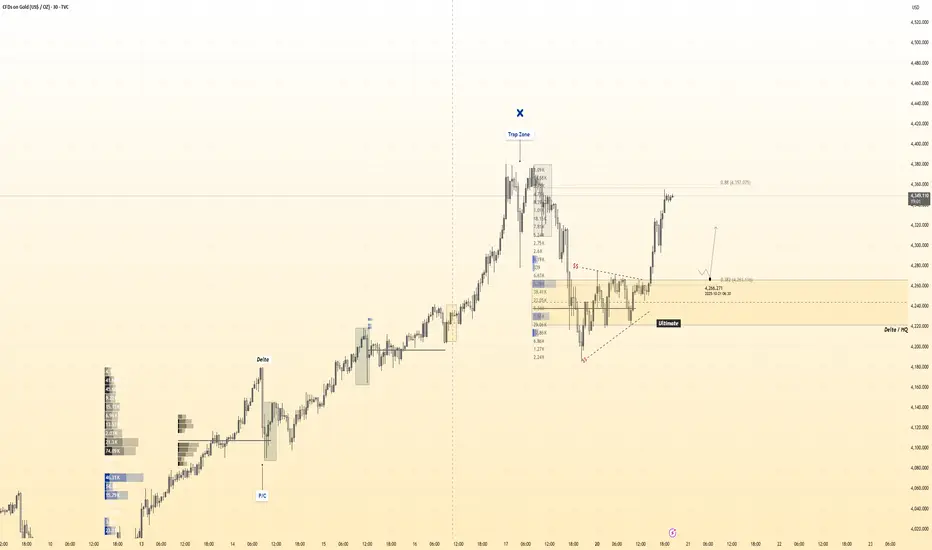
( HANZO Gold Protocol ) Bullish Reversal DetectedStatus: Active Reversal Protocol
Symbol: Gold
Session: London–New York Overlap (Smart Exit Window)
➕Bias: Bullish Reversal
Goal: Controlled with minimal drawdown
Tactical Edge: Reversal Protocol through liquidity engineering
Confidence Level: ★★★★★ (Smart Money Aligned)
☄️4270 Bullish Reversal Zone — Full Breakdown
1️⃣ Fixed Range HVN Alignment
The 4270 level aligns perfectly with the High Volume Node from the previous accumulation phase — a sign of institutional absorption where orders were heavily exchanged before breakout.
2️⃣ Volume Gap Above, Density Below
Below 4270 we have heavy volume clusters, while above it the profile becomes thin — confirming that 4270 is the last defended zone before liquidity imbalance.
3️⃣ Liquidity Trap Confirmation
The sharp push below 4300 earlier collected stop-loss liquidity, making 4270 the smart money re-entry zone after clearing out retail buyers.
4️⃣ Fibonacci Alignment (0.382–0.5 Zone)
4270 sits inside the 38.2% retracement of the impulsive move, which is a premium re-entry level used by institutional models.
5️⃣ Structural Confluence (Old Resistance → Support)
Previous breakout base and trend compression aligned with 4270 mark it as a flip zone — the structural confirmation of a reversal block.
6️⃣ Delta HQ Reversal Indicator
At the base of the move (near 4270) the Delta HQ showed negative absorption turning neutral, meaning sell volume failed to push price lower — a key reversal trigger.
7️⃣ Session Logic
The level coincides with the post-10:30 session retest window (smart money re-entry timing), fitting your 10:30–10:30 volume cycle.
8️⃣ Trap Zone Above (Liquidity Vacuum)
The upper “Trap Zone” confirms that price already engineered liquidity above, freeing up path for bullish continuation from 4270 upward.
9️⃣ Internal Trendline Compression Break
The descending pattern leading into 4270 forms a bullish breakout wedge — clear compression followed by volume breakout.
🔟 Institutional Behavior Evidence
Sharp imbalance candle after 4270 test shows controlled accumulation — classic smart money re-entry behavior before next expansion.
🎯 Summary (Hanzo Logic)
4270 = Delta Reversal + HVN Defense + Liquidity Reset + Fib Precision
A high-confidence engineered re-entry zone built by smart money to refill positions before bullish continuation.
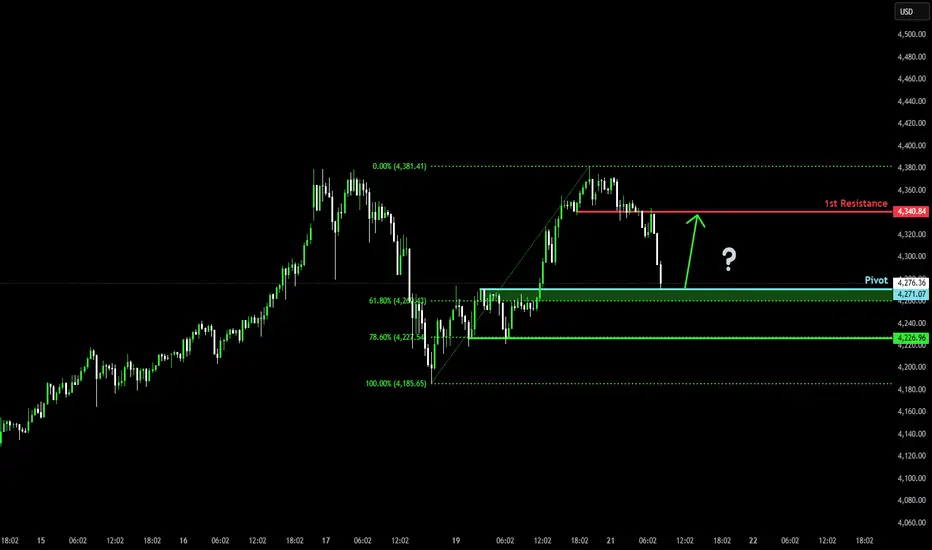
Could we see a bounce on Gold?The price is reacting off the pivot which is a pullback support and could bounce to the 1st resistance which acts as a pullback resistance.
Pivot: 4,271.07
1st Support: 4,226.96
1st Resistance: 4,340.84
Disclaimer:
The above opinions given constitute general market commentary, and do not constitute the opinion or advice of IC Markets or any form of personal or investment advice.
Any opinions, news, research, analyses, prices, other information, or links to third-party sites contained on this website are provided on an "as-is" basis, are intended only to be informative, is not an advice nor a recommendation, nor research, or a record of our trading prices, or an offer of, or solicitation for a transaction in any financial instrument and thus should not be treated as such. The information provided does not involve any specific investment objectives, financial situation and needs of any specific person who may receive it. Please be aware, that past performance is not a reliable indicator of future performance and/or results. Past Performance or Forward-looking scenarios based upon the reasonable beliefs of the third-party provider are not a guarantee of future performance. Actual results may differ materially from those anticipated in forward-looking or past performance statements. IC Markets makes no representation or warranty and assumes no liability as to the accuracy or completeness of the information provided, nor any loss arising from any investment based on a recommendation, forecast or any information supplied by any third-party.
Gold last push up? 18/Oct/25XAUUSD will its recently scary exciting 1500++ (pips/meter) roller coaster ride end soon? Probably is the beginning?! That Roller Coaster just moving into standby position at 4125 "meter" height before climbing slowly to the Height of 4430 And finally "rolling down"!!??

Gold Tests Broken TrendGold is extending toward the broken trendline and could face rejection around this level. For the stop, I’ll place it just above the previous highs. This setup is riskier than the previous one, so if the trade moves in my favor, I’ll consider moving the stop to the entry point to eliminate the chance of a loss.

GBP/USD 2-hour chart Pattern....GBP/USD 2-hour chart, here’s the detailed target analysis
---
📊 Chart Overview
Pair: GBP/USD
Timeframe: 2-hour
Indicators: Ichimoku Cloud
Price Zone: 1.3387 (current area)
Support Zone: Around 1.3340 – 1.3360 (white box area)
Resistance Zones (Targets): Marked as “Target Points” on my chart
---
🎯 Target Levels
1. First Target Point (Short-term):
Around 1.3440 – 1.3460
This aligns with the first marked “Target Point” on your chart.
Price likely to react here since it’s near the top of the Ichimoku cloud and past resistance.
2. Second Target Point (Extended Target):
Around 1.3515 – 1.3520
This matches the upper “Target Point” zone shown on my chart.
If bullish momentum continues and price breaks 1.3460, this level could be reached.
---
🧭 Summary
Target Type Price Level Notes
🎯 TP1 1.3440 – 1.3460 First strong resistance zone
🎯 TP2 1.3515 – 1.3520 Extended bullish target
🛑 Support 1.3340 – 1.3360 Key demand area (entry zone confirmation)
---

Gold Setup You Can’t IgnoreHey everyone, Erik here !
Gold is quietly preparing for its next move. After a strong rally, price didn’t collapse as many expected. Instead, it’s been building a smooth accumulation structure — the classic Cup and Handle that often signals continuation in a healthy uptrend.
This setup tells a deeper story about market psychology. Sellers are running out of strength, while buyers keep absorbing every pullback with patience and confidence. Momentum is quietly shifting, and pressure beneath the surface is growing.
If a clean breakout confirms this formation, gold could enter its next bullish leg. A move toward 4500 looks not just possible, but reasonable based on the current market structure.
Until that confirmation comes, patience remains the key. Waiting for a clear breakout with strong volume helps filter out false signals and keeps you aligned with the dominant trend.

Gold setup: The retracement that could spark the next rallyOANDA:XAUUSD continues to trade confidently within a well-defined ascending channel, maintaining a clear and healthy bullish structure. After testing the upper boundary, the price pulled back to the mid-zone, where a strong rejection candle appeared, confirming that buyers are still defending key levels with conviction and keeping the upward momentum alive.
This kind of market behavior often signals renewed strength before the next move higher. If the bullish momentum holds, the price could break above the upper boundary of the channel and push toward new highs. Given the current technical setup and positive sentiment across the market, a move toward 4,500 seems both realistic and consistent with the ongoing trend.
Even so, caution remains important. A daily close below the lower boundary of the channel would weaken the bullish structure and could trigger a short-term correction before the trend resumes.
From a broader perspective, the bullish outlook for gold continues to be supported by geopolitical tensions, global uncertainty over interest rate policies, and the weakening US dollar. With central banks maintaining strong demand for gold as a hedge against economic instability, the precious metal remains one of the most attractive safe-haven assets in today’s volatile market.
