Sell XAU and buy BTCBitcoin’s been creeping up on gold for years. Every dip gets bought. Every lower high gets higher. Now we’re sitting right under that line again.
This looks like the kind of setup that prints history books later. Gold’s had its time.
Not saying to dump your gold chains. Just saying... if you still think gold is the move in 2025, you’re missing the bigger picture.
The world’s changing. So is money.
Gold

Gold (XAUUSD): wait for pullback and then buy againGold (XAUUSD): wait for pullback and then buy again. Price needs some correction before hitting tp2

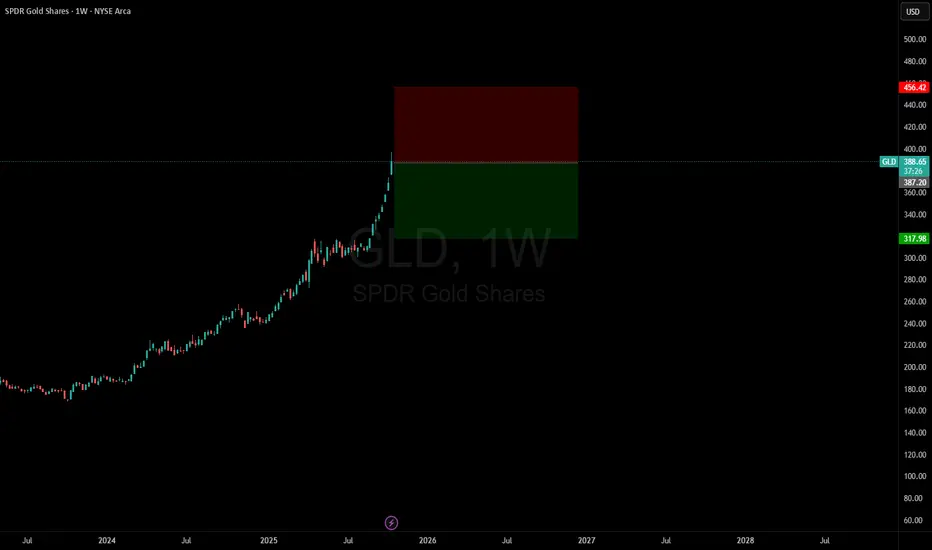
Gold at a vertical angle and requiring the passage of timeWhat is not known about the trend that has been developing since the early 1970s is a transition from the upward swings!
What is more striking is the speed with which these swings have occurred!
Good luck!

Short GLDGold is now over $4,200 and I believe there is a trade to the down-side.
Understand, it VERY hard to call a top in such a powerful bull market move. Most of the time, you WILL lose this trade.
Even when you do win these type of trades, the price action will usually go against you before it goes in the right direction.
It is a market. You WILL be tested.
That’s how price discovery works.
The truth is that if you're trying to outperform market-level returns, you MUST take risks.

CAD/JPY (1H timeframe)...CAD/JPY (1H timeframe) — I'm using the Ichimoku Cloud and a downtrend resistance line that’s just being tested.
Here’s the technical breakdown 👇
🔍 Analysis:
Price is currently around 107.12–107.20, testing the descending trendline.
The Ichimoku cloud (yellow area) is above current price, acting as resistance.
The marked “Target Points” in my chart show potential bullish breakout levels if the price successfully closes above the cloud and trendline.
🎯 Target Levels:
1. First Target (Short-term): ≈ 108.00 – 108.10
→ This aligns with the lower horizontal “Target Point” shown and matches the bottom of the next resistance zone.
2. Second Target (Extended / Medium-term): ≈ 108.90 – 109.00
→ This is my higher “Target Point” on the chart, aligning with prior structural resistance and top of the projected move.
📉 If rejection occurs:
If price fails to break above 107.20–107.30 (trendline resistance), expect a pullback toward 106.80 as short-term support.
---
✅ Summary:
Buy breakout confirmation: Above 107.30
Targets:
TP1 → 108.00
TP2 → 109.00
Support: 106.80

Gold testing session lowsGold finally succumbed to profit-taking pressure today as it sold off nearly $180 from its intraday record high of $4380, representing a sizeable drop. Hardly a surprise to be fair, with the market being so severely overbought. Potentially it is not the end of the trend, but a large bearish engulfing candle at the peak here does point to at least a temp top, which wouldnt be a bad thing. Anyway, the metal has rolled over and the metal was now trading near $4200, on track for its worst day in a LONG time. Let's see how it closes the session, but i wouldn't be surprised if it were to head back down to $4K in the week ahead, before potentially consolidating.
By Fawad Razaqzda, market analyst with FOREX.com

GOLD 4H CHART ROUTE MAP Hey Everyone,
This is an extended 4H chart idea, continuing from our previous analysis, now with the added Goldturn levels above, allowing us to continue to track ongoing movement.
After completing the 4212 move, price continued to push upward, leaving a small gap near 4383 before facing rejection. We’re now seeing price retest the lower Goldturn levels for support, with a current test around the 4212 Goldturn. The 4212–4154 zone remains a key weighted area, and as long as price holds above this zone, we may see a potential bounce.
We’ll return on Sunday with our multi-timeframe roadmap and trading plans for the week ahead. Thank you all once again for your continued support, likes, and comments, we truly appreciate it.
Mr. Gold
GoldViewFX

(Gold 2H – XAU/USD):(Gold 2H – XAU/USD):
✅ Breakdown confirmed: Price has clearly broken below the ascending trendline and retested it (marked by the red circle).
✅ Support zone: Price is sitting just below the previous support box (~4,250–4,230).
✅ Ichimoku Cloud: Next visible support lies inside the Kumo (blue shaded area).
🎯 Target Levels (Downside)
1. First target: 4,180 – 4,170 → top of the Ichimoku cloud.
2. Main target: 4,130 – 4,110 → the “Target Point” you have marked (bottom of the cloud and horizontal support).
3. Extended target (if momentum continues): 4,070 – 4,050 → next structural support zone.
📈 Summary
Entry: After the retest near 4,250.
TP1: 4,180
TP2: 4,130
SL: Above 4,270 (trendline retest).
So, my main target zone = 4,130 ±20 (as drawn on my chart).

Platinum- While everyone is chasing Gold’s rally, I’ve got my eyes on Platinum.
- That doesn’t mean Gold is a bad investment, it just means it’s already had its moment.
- Platinum feels “delayed,” but its time is coming.
- Observe closely, this simple graph reveals a tightening triangle.
Remember my first rule: Buy the blood, not the moon.
Stay sharp. Diversify. Never go all in.
Happy Tr4Ding

Gold Vs MoneySupply: a chart Peter Schiff Doesn't want u to seegold has upside.. expecting it to push toward its real valuation all time high..
over time gold has performed poorly at preserving capital. but academically recognized inflationary environments could be what was missing.

Gold Near 4,280 as US–China Tensions Fuel Flight to Safety!Hey Traders,
In today’s session, we’re monitoring XAUUSD for a buying opportunity around the 4,280 zone. Gold remains in a strong uptrend, with price currently correcting toward a key structural support area where buyers may look to re-enter.
From a fundamental standpoint, rising US–China geopolitical tensions have pushed investors toward safe-haven assets. Market sentiment is tilting defensive, and Gold — already hovering near all-time highs — continues to reflect that global risk aversion.
A sustained bid above 4,280 could reinforce bullish momentum and potentially open the path toward new highs if uncertainty persists.
Key level: 4,280 (support / trend confluence)
Bias: Bullish while above this level
Trade safe,
Joe.

GOLD Set To Grow! BUY!
My dear subscribers,
GOLD looks like it will make a good move, and here are the details:
The market is trading on 4307.6 pivot level.
Bias - Bullish
My Stop Loss - 4291.5
Technical Indicators: Both Super Trend & Pivot HL indicate a highly probable Bullish continuation.
Target - 4335.3
About Used Indicators:
The average true range (ATR) plays an important role in 'Supertrend' as the indicator uses ATR to calculate its value. The ATR indicator signals the degree of price volatility.
Disclosure: I am part of Trade Nation's Influencer program and receive a monthly fee for using their TradingView charts in my analysis.
———————————
WISH YOU ALL LUCK

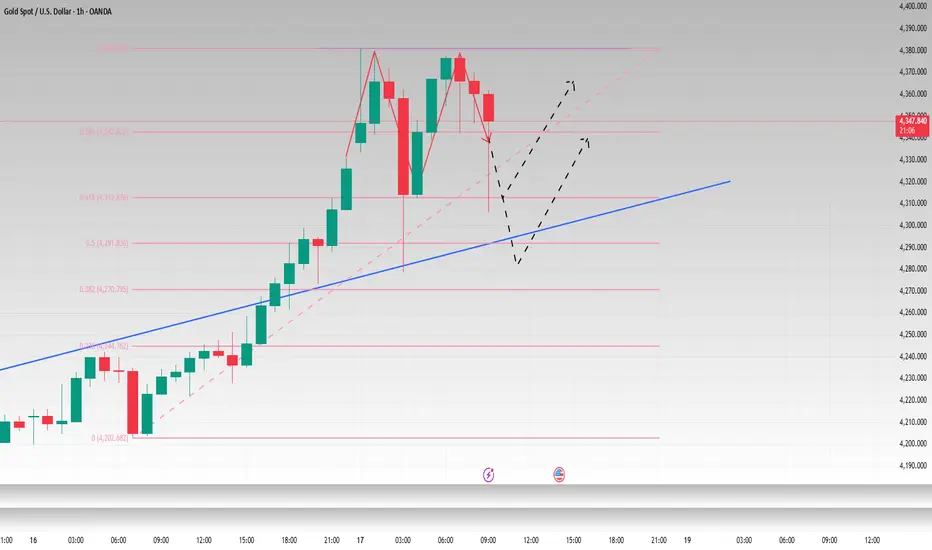
XAUUSD: Rally can Reach new ATH - $4520 pointsHello everyone, here is my breakdown of the current Gold setup.
Market Analysis
Gold has been in a very strong and complex uptrend. We saw the price break out of an initial range and then establish a major Trend Line that has guided it higher, breaking through key levels like Support 2 at 3670 and Support 1 at 4020.
Currently, the most significant event is that the price has broken out above its main Trend Line. After this powerful move, the market has entered a natural corrective phase and is pulling back towards this broken line for a classic retest. This is a critical area to watch.
My Scenario & Strategy
I'm looking for the price to complete its correction down to this main ascending trend line. The key signal for me would be a confirmed and strong bounce from this dynamic support, which would tell me the pullback is over and the primary trend is ready to accelerate.
Therefore, the strategy is to watch for this bounce. A successful defense of the trend line would validate the long scenario. My new target for the next impulsive wave higher is 4520, which would represent a new ATH.
That's the setup I'm tracking. Thank you for your attention, and always manage your risk.

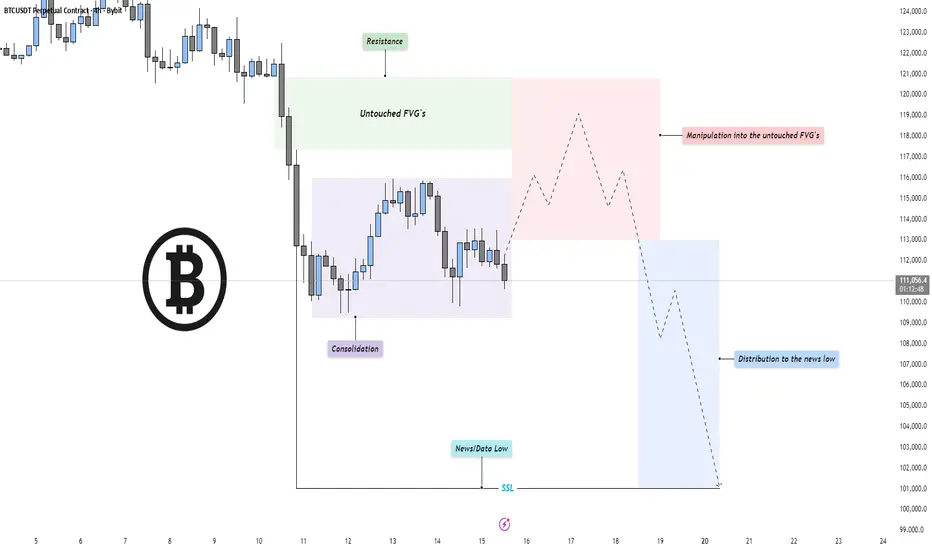
BTC - Perfect Power of 3 setup!Market Context
Bitcoin has entered a phase of compression after an extended bearish leg, with price currently consolidating near recent lows. The previous selloff created a clean structure of inefficiencies and untouched fair value gaps (FVGs) above, now acting as potential magnet zones for short-term retracements. The broader context remains bearish until those imbalances are efficiently mitigated.
Fair Value Gaps & Manipulation Zones
A clear pocket of untouched FVGs sits above the current range, aligning with resistance from prior breakdown points. Price could engineer a manipulation move into this zone, enticing late buyers before resuming the macro bearish direction. Such a move would serve as a liquidity grab and offer premium pricing for distribution before continuation lower.
Liquidity Dynamics
The market structure shows resting sell-side liquidity (SSL) below the recent “news/data low,” marked as a potential target for a deeper sweep. Once manipulation into the upper inefficiencies completes, the market could shift momentum to the downside, distributing into that liquidity and seeking new lows for rebalancing.
Final Thoughts
The current structure points toward a classic bearish continuation setup: consolidation, manipulation into premium inefficiencies, and a drive toward sell-side liquidity. Unless price breaks decisively above the untouched FVG chain, the expectation remains for a redistribution phase leading into the news low or beyond.
If this breakdown helped frame your bias, a like goes a long way — do you think price runs the FVG first, or dives straight into the liquidity below?
It is not a reversal callback correction to continue to buyGold gapped up at the opening, touched 4379 and then plunged nearly $100 before rebounding quickly. The fluctuations in the Asian session alone are so drastic. In addition, today is Friday and there is a risk of market closure, so intraday trading needs to be more cautious.
From the news perspective, the expectation of a Fed rate cut provides liquidity support, Sino-US trade tensions and geopolitical risks stimulate safe-haven demand, and the weakening of the US dollar and economic uncertainty amplify the appeal of gold. Many investors continue to increase their holdings of safe-haven assets in a complex macroeconomic context, providing solid and strong support for the rise of gold.
Although short-term prices fluctuate frequently, they have not fallen below the daily MA5 and MA10 moving averages. Therefore, it should not be regarded as a trend reversal, but a market shakeout. Therefore, we maintain a trading strategy that is mainly bullish and supplemented by short selling.
From a fundamental perspective, multiple rebound attempts failed to break through, making the upper 4380-4400 range a short-term resistance range. The short-term trend has the tendency to form an M top, so I will give several long trading opportunities during the day.
First of all, we should pay attention to the first support formed by 4315-4305 below, which is also the 61.8% retracement position of gold. If it repeatedly circles this position in the short term without breaking, we can try to go long on gold. For the second chance, I would give the support level of 4290-4280 below, which is near the trend suppression and the 50% dividing line, as well as the 4H MA10 moving average. I think we can try to go long on gold again within this range. The last chance I would give is around 4200, the starting point of this round of rise. Even if gold retaliates and falls, we can still maintain good trading opportunities.
During the day, we can go long on gold in batches according to the strength of gold's retracement.
OANDA:XAUUSD
XAUUSD: Market Analysis and Strategy for October 17Gold Technical Analysis
Daily Resistance: 4500, Support: 4059
4-Hour Resistance: 4380, Support: 4176
1-Hour Resistance: 4380, Support: 4280
Gold continued to rise by over $100 yesterday, reaching a high of 4380 in today's Asian session. At this rate, the next move is 4500.
Of course, this won't be the final target of this market rally.
In the short term, although there was a sharp drop of $100 in Friday's Asian session, it was quickly recovered, resulting in a V-shaped reversal, indicating that bullish sentiment has not subsided. The probability of setting a new high today, or even reaching 4400, remains high.
Operationally, continue to look for buying opportunities today. If the decline can be halted around 4330 or 4300, then continue to enter the market.
BUY:4330near
BUY:4300near
BUY:4280near

Use Average as Resistance for GoldGold is rising rapidly, making this a risky trade. The 21-period EMA usually works well for gold on the 15-minute timeframe. With a trailing stop set just above the moving average, I’m planning to target the trendline.

Gold flight to safety tradeThe Gold remains in a bullish trend, with recent price action showing signs of a continuation breakout within the broader uptrend.
Support Zone: 4260 – a key level from previous consolidation. Price is currently testing or approaching this level.
A bullish rebound from 4260 would confirm ongoing upside momentum, with potential targets at:
4400 – initial resistance
4450 – psychological and structural level
4500 – extended resistance on the longer-term chart
Bearish Scenario:
A confirmed break and daily close below 4260 would weaken the bullish outlook and suggest deeper downside risk toward:
4200 – minor support
4160 – stronger support and potential demand zone
Outlook:
A bullish bias remains intact while the Gold holds above 4260. A sustained break below this level could shift momentum to the downside in the short term.
This communication is for informational purposes only and should not be viewed as any form of recommendation as to a particular course of action or as investment advice. It is not intended as an offer or solicitation for the purchase or sale of any financial instrument or as an official confirmation of any transaction. Opinions, estimates and assumptions expressed herein are made as of the date of this communication and are subject to change without notice. This communication has been prepared based upon information, including market prices, data and other information, believed to be reliable; however, Trade Nation does not warrant its completeness or accuracy. All market prices and market data contained in or attached to this communication are indicative and subject to change without notice.

GOLD Is Bearish! Short!
Take a look at our analysis for GOLD.
Time Frame: 4h
Current Trend: Bearish
Sentiment: Overbought (based on 7-period RSI)
Forecast: Bearish
The price is testing a key resistance 4,338.72.
Taking into consideration the current market trend & overbought RSI, chances will be high to see a bearish movement to the downside at least to 4,203.99 level.
P.S
We determine oversold/overbought condition with RSI indicator.
When it drops below 30 - the market is considered to be oversold.
When it bounces above 70 - the market is considered to be overbought.
Like and subscribe and comment my ideas if you enjoy them!

GOLD → Positive backdrop. Consolidation before growth?FX:XAUUSD is consolidating after a shake-down in the Asian and Pacific sessions. The price hit a new low of 4278, but bulls are aggressively buying up two liquidations (manipulation?). The metal is preparing for its ninth consecutive week in positive territory, with an 8% increase over the week.
Key drivers: Fed members confirmed their readiness to cut rates in October and pointed to risks for the labor market. The situation with the trade war between China and the US is still tense.
However, negotiations between the presidents of three countries on the conflict in Eastern Europe have raised hopes for de-escalation, which has temporarily reduced demand for defensive assets. The shutdown continues, which supports the price of gold.
The correction in gold is a temporary pause, and any decline will be used for purchases.
Technically, the focus is on the global trading range of 4280-4380, with consolidation within 4350-4330. A breakout of the accumulation zone could trigger a move in the direction of the breakout
Resistance levels: 4350, 4380
Support levels: 4320, 4300, 4280
Technically, before rising, the price may test the liquidity zone located below the specified support zones. However, it is also worth watching the 4350 trigger—a breakout of resistance and a close above this level could trigger continued growth within the current bullish trend.
Best regards, R. Linda!

BTCUSD/XAUUSD where is the probability of equilibrium? 17/Oct/25BTCUSDXAUUSD ratio chart shown there is multi top pattern near 41 raio with price breaking the long term uptrend line. The Next major support could be at 1?! Gosh! BTC (fake money/ digital gold) same value with Gold ( real money /analog gold)?! WT....

Bitcoin. Oh mine! On Par with Gold by 2027? 17/Oct/25BTCUSD probably completed its cycle 7 (purple) high and now trending multi year low until till near 2027 which is cycle 8 (purple ) low. Based on EW pattern BTC could form a long-term flat pattern which price could go down to 3000 +/- by the time Gold which could be at around 3000?
