DeGRAM | GOLD reached the resistance line📊 Technical Analysis
● XAU/USD reached the upper boundary of the ascending channel near 4,168, where a bearish takeover pattern formed, signaling potential exhaustion.
● A breakdown below 4,092 could confirm the start of a correction toward 4,034 and possibly 3,950 as price retests prior support within the channel.
💡 Fundamental Analysis
● Gold faces pressure as U.S. Treasury yields stabilize and the dollar strengthens amid hawkish Fed outlooks.
✨ Summary
● Short bias below 4,168; targets 4,034–3,950. Technical rejection and dollar strength favor short-term downside correction.
-------------------
Share your opinion in the comments and support the idea with a like. Thanks for your support!
Gold

Setting new highs, it is right to go long on the pullbackI reminded everyone yesterday that once the W-shaped formation is confirmed and structural support is provided for the bulls, the upward trend will continue. The final result is in line with our expectations again. Gold is still fluctuating upward. If this trend continues, it is expected to reach 4210-4230.
As the price of gold continues to rise and returns to a unilateral upward trend, the short-term highs and support are also moving up. From the perspective of the big cycle trend, the current daily MA5 moving average and the 4H middle track have also come to around 4088-4090, which is also the position that short-term bulls need to focus on defending. Before failing to effectively fall below this position, we can still maintain the bullish trend unchanged, and any decline can be regarded as an opportunity for bulls to enter the market.
Judging from the hourly chart, the current gold price has reached the 42,000 integer mark. The continuous upward fluctuation has caused the current technical indicators to enter the overbought risk zone. Do not blindly chase the rise in the short term and be alert to the market's potential correction demand. The short-term support can be seen at 4180-4165. If gold subsequently falls back to this short-term support, we can consider continuing to go long on gold.
OANDA:XAUUSD
Is Gold XAUUSD due for a Retrace? VWAP & Volume Profile Plan🏆 Gold (XAUUSD) Market Update 🏆
Gold (XAUUSD) has rallied strongly and is now pushing into new highs 📈. In my view, price looks overextended — when applying the VWAP indicator, we can clearly see that price has stretched three deviations away from VWAP ⚖️.
I’m also analyzing the Volume Profile to identify value areas that could serve as key support zones on any retracement 🔍. While my overall bias remains bullish, I’d like to see price return to equilibrium — roughly the 50% retrace of the recent price swing (on the 4-hour timeframe, measured from the order block low) 📊.
Additionally, I’m observing a potential Three-Drive Pattern forming, which could hint at a short-term correction before any continuation higher 🔄.
⚠️ Disclaimer: This content is for educational purposes only and not financial advice.

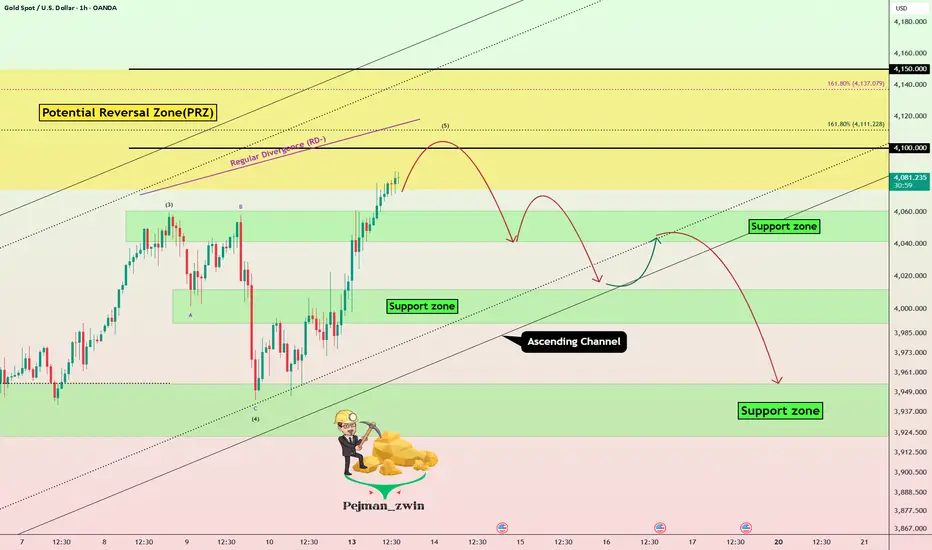
Gold Near $4,100 PRZ – Time for a Reversal?Just like we discussed last week, Gold ( OANDA:XAUUSD ) moved exactly as expected and hit its targets .
Now, as we start the new week, Gold is continuing to form a New All-Time High(ATH) and is currently near a Potential Reversal Zone(PRZ) and the $4,100 round number .
From an Elliott Wave perspective , it looks like Gold is completing wave 5, which could top out in this PRZ.
We’re also seeing a Regular Divergence(RD-) between the two consecutive peaks , which suggests that Gold might start a correction soon.
I expect Gold to begin a correction and at least drop down to the lower line of the ascending channel after breaking the Support zone($4,061 – $4,041) .
Note: If Gold breaks the lower line of that ascending channel, we can expect further downside.
Note: Also, keep in mind that Powell speaks tomorrow, which could influence Gold’s movement. As I mentioned, a bullish DXY outlook could also help push Gold lower.
Second Target: $3,963
Stop Loss(SL): $4,153(Worst)
Please respect each other's ideas and express them politely if you agree or disagree.
Gold Analyze (XAUUSD), 1-hour time frame.
Be sure to follow the updated ideas.
Do not forget to put a Stop loss for your positions (For every position you want to open).
Please follow your strategy; this is just my idea, and I will gladly see your ideas in this post.
Please do not forget the ✅ ' like ' ✅ button 🙏😊 & Share it with your friends; thanks, and Trade safe.
XRPUSDT (1H) chart, here’s a full technical read:XRPUSDT (1H) chart, here’s a full technical read:
---
🔍 Chart Observations
Current price: around $2.50
The price is trading above an ascending trendline, showing bullish structure.
It’s sitting on top of the Ichimoku Cloud, suggesting ongoing bullish momentum.
Two target zones are already drawn on my chart:
The first target around $2.65
The second (main) target near $2.85
The support zone (red box below) is around $2.42–2.45
---
🎯 Target Levels
Based on my chart and price action:
1. Target 1: $2.65 → previous resistance area (first TP / partial take-profit zone)
2. Target 2: $2.83–2.85 → main target, aligns with strong resistance from earlier breakdown level
---
🛑 Stop-Loss Suggestion
Below the rising trendline or the Ichimoku cloud: around $2.42
(A clean break below that invalidates the bullish setup.)
---
⚖ Trade Plan Summary
Type Entry Stop Target 1 Target 2 Risk:Reward
Long $2.50–2.52 $2.42 $2.65 $2.85 ~1:2.5–1:3
---
📈 Summary:
Trend = Bullish (supported by Kumo + trendline)
Entry = $2.50–2.52
Target 1 = $2.65
Target 2 = $2.85
Stop = $2.42

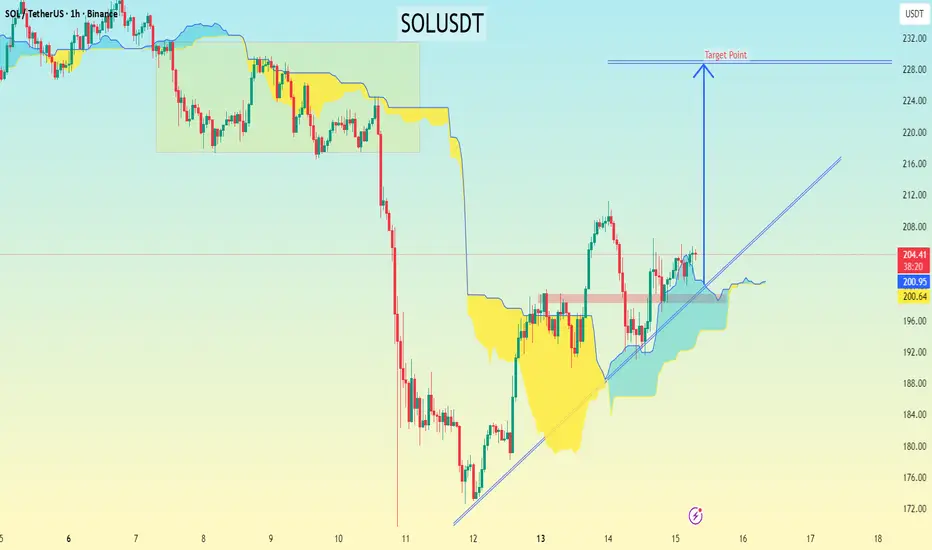
SOLUSDT chart (1-hour timeframe)...SOLUSDT chart (1-hour timeframe), here’s a detailed breakdown of the setup and the potential target based on the price structure and Ichimoku setup:
---
🔍 Chart Observations
Current price: around $205
The price has broken above the Ichimoku Cloud, confirming a short-term bullish bias.
A rising trendline from the $180 area is providing strong support.
The “Target Point” label I have drawn sits roughly around $230–232.
The cloud (Kumo) is bullish and widening, suggesting potential continuation upward.
---
🎯 Target Levels
Based on structure and Ichimoku confirmation:
1. First target (short-term): $212 — local resistance area / psychological level
2. Main target: $228–232 — aligns perfectly with my chart’s “Target Point” label and previous swing-high zone
3. Extended target (if momentum continues): $240 — strong resistance from the last consolidation before the drop
---
🛑 Stop-Loss Suggestion
Below the trendline or the Kumo support: around $198–200
(A clean break below this would invalidate the bullish setup.)
---
⚖ Trade Plan Summary
Type Entry Stop Target 1 Target 2 Risk:Reward
Long $204–206 $198 $212 $228–232 ~1:2.5–1:3
---
📈 Summary:
Trend = Bullish
Entry = On retest of $202–205 area
Target = $228–232
Stop = Below $198
USDJPY 4-hour chart Pattern..USDJPY 4-hour chart with Ichimoku Cloud
🔍 Observations:
Current price: around 151.02.
The price recently pulled back into the Ichimoku Cloud (Kumo), suggesting potential support.
A bullish bounce from the cloud is forming.
I marked an arrow pointing upward toward a target region around 153.00–153.50.
A support zone (red rectangle) is visible near 150.80–151.00.
🎯 Target Analysis:
If the bullish structure continues (price stays above the cloud and holds 150.80 support):
Short-term target: 152.30 (previous local high / minor resistance)
Main target: 153.00 – 153.50 (major resistance / top of previous swing)
Aggressive extension: 154.00 if momentum remains strong and USD strength continues.
🛑 Stop Loss Suggestion:
Below the red zone or bottom of the cloud → around 150.50 (gives structure-based protection).
⚖ Trade Plan Summary:
Type Entry Stop Target 1 Target 2 Risk:Reward
Long 151.00–151.20 150.50 152.30 153.30 ~1:2.5

GOLD → Correction to 4090. What could this mean?FX:XAUUSD , after updating its high to 4180, formed a correction and descended to the support zone of 4090, forming an intermediate bottom. We have a trading range...
Key drivers: China has introduced controls on rare earth metal exports, and the parties are holding consultations. A meeting between Trump and Xi Jinping is scheduled for the end of October.
Expectations of two rate cuts before the end of the year are strengthening gold's position. The ongoing government shutdown is fueling demand for safe-haven assets.
Today, attention is focused on Powell's speech, which could set the tone for the market.
The bullish trend for gold continues. The absence of bearish factors and ongoing macro risks continue to push the price up. Corrections are seen as an opportunity to buy.
Resistance levels: 4150, 4180
Support levels: 4117, 4090, 4059
The price is testing the 4150 liquidity zone, which could trigger a pullback within the range. A retest of support at 4117-4090 could support the market, and a change in imbalance could lead to another rally to 4180 - 4200
Best regards, R. Linda!

SELL XAUUSDIn todays session and next few days we are monitoring gold for sell set ups. Our entry at current price 4070 and stops above 4120. Target is 3870. Tight stops just incase. Use proper risk management.

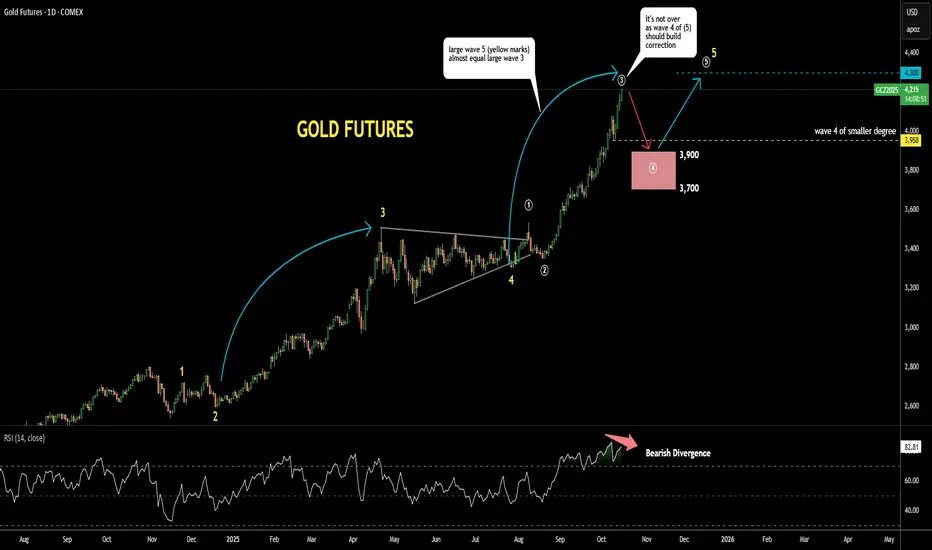
Gold Update 15OCT2025: RSI Hints at CorrectionGold continues to dominate headlines, printing new all-time highs one after another
The 4-hour Bearish Divergence earlier failed to halt the rally
Now, a Bearish Divergence has appeared on the daily time frame, as the latest price high was not confirmed by RSI
This signals that a peak may be forming
A corrective phase could soon unfold as wave 4 within the larger wave (5) structure
The expected retracement could reach the 38.2–61.8% Fibonacci zone of wave 3 of (5), targeting the pink box between $3,700 and $3,900
The low of the previous minor wave 4, near $3,958, may serve as initial support during the pullback
It is worth noting that the magnitude of wave (5) so far mirrors that of the prior large wave (3)
Therefore, the projected target for the final wave 5 of (5) remains around $4,300 as a conservative objective
However, if momentum extends further, wave 5 could evolve into an extended move and drive prices toward new record highs beyond that level
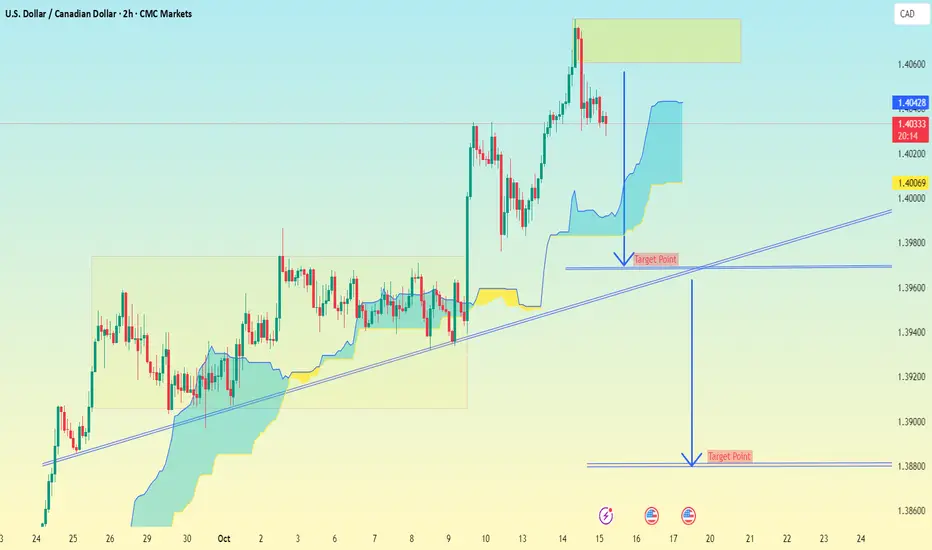
USDCAD 2-hour chart Pattern..USDCAD 2-hour chart, here’s what can be observed and inferred technically:
🔍 Chart Analysis Summary:
Pair: USD/CAD
Timeframe: 2H (2-hour)
Current price: ~1.4033
Trendline: Upward sloping (acting as dynamic support)
Recent action: Price broke out from consolidation, reached resistance near 1.4060–1.4080 zone, and started to pull back.
Cloud (Ichimoku): Currently price is above the Kumo cloud, but appears to be testing or potentially dipping into it.
---
🎯 Target Areas (based on your annotations and market structure)
1. Short-term target:
First Target Point: Around 1.4000–1.4009
This matches my chart annotation just above the ascending trendline.
Likely corresponds to minor support and a retest of the trendline area.
2. Extended / Swing Target:
Second Target Point: Around 1.3880–1.3890
This is marked as the lower "Target Point" on my chart.
It aligns with a deeper correction scenario if the trendline breaks cleanly and the bearish momentum extends.
That would fill the “measured move” drawn on my chart (projected from the previous range height).
---
⚠ Key Levels to Watch
Level Type Note
1.4080 Resistance Previous high / Supply zone
1.4000 Support / Target 1 Trendline + psychological round number
1.3880 Target 2 Full measured move projection
1.4060–1.4080 Sell Zone Potential retest area if price bounces
---
📉 Bias:
If the price breaks below 1.4000 (trendline support) and holds under the Kumo cloud, a move toward 1.3880 looks likely.
If it holds above 1.4000 and rebounds, the short-term correction could end there.
AAPL (Apple Inc.) on a 4-hour timeframe.AAPL (Apple Inc.) on a 4-hour timeframe.
Here’s what the chart shows:
The current price is around $247.80.
There is an uptrend line supporting the price.
Two target levels are marked on the chart with arrows pointing upward.
The Ichimoku cloud shows bullish momentum (price above the cloud).
📈 Marked Target Levels on Chart:
1. First Target: Around $256
2. Second Target: Around $268
📝 Analysis Context (from the chart)
The trend is bullish, supported by higher highs and higher lows.
Price is riding the trendline, and the cloud provides support.
First target seems to be a short-term breakout level, second is more medium-term.
⚠ Important Note:
These are technical analysis targets, not guaranteed future prices. Real market movement can differ due to macroeconomic news, earnings, or broader market sentiment.

GOLD (XAUUSD): The Next Resistances
Here are the next potentially significant psychological resistances
too look at on Gold for pullback.
Resistance 1: 2198 - 2203 area
Resistance 2: 2248 - 2253 area
Resistance 3: 2298 - 2303 area
In case of a start of a bearish move,
consider the underlined supports for buying.
❤️Please, support my work with like, thank you!❤️
I am part of Trade Nation's Influencer program and receive a monthly fee for using their TradingView charts in my analysis.

Gold (xauusd): still bullishHello guys!
Gold (XAU/USD) is showing a strong bullish trend on the 30-minute chart, but we can see that the upward trendline has recently been broken. Despite this, the price is approaching a key support zone between 4,086 and 4,058 (highlighted in blue), which has held as a strong buying area in the past.
Currently, the market could play out in two scenarios:
Blue scenario – A shallow pullback from the current price down to the support zone, followed by a rebound.
Red scenario – A slightly deeper retracement, touching the lower end of the support zone before buyers step in.
In both cases, this support area is likely to act as a strong demand zone, providing a good opportunity to enter long positions . The overall bullish trend remains intact, so the expectation is that after this retracement, the price will continue upward toward 4,180 and beyond.
✅ Key levels to watch:
Support: 4,086 – 4,058
Resistance: near 4,180 (next target)
Trading plan: Wait for the price to approach the blue support area and look for bullish confirmation (reversal candlestick, bullish engulfing, or strong buying volume) to enter long positions.
Disclaimer: As part of ThinkMarkets’ Influencer Program, I am sponsored to share and publish their charts in my analysis.

Gold Is on Fire: Can XAU/USD Hit $4130 Gold’s price is really strong right now. As long as gold stays above $4000, it can move up to $4130. But if gold drops below $4000, it could slow down or even start to fall.
What do you think will happen next, do you think gold will keep going up or fall back down? Have you ever watched gold make a big move before?
If you want to know what to do or have any questions, just ask me! Sometimes a simple question can help you learn something new about trading gold. What do you want to know about gold today?
Mindbloome Exchange
Trade Smarter Live Better

GOLD Intraday Chart Update for 15 Oct 25GOOD Morning Traders,
As long as GOLD sustains above 4080 FMP Level it will remains bullish however the only way to join Trend Rally is following Psychological Levels with 3080 chain
Major Support zone for the day is located @ 4130-4150 below this zone GOLD will move Towards 4100 or even 4080
Above 4150 Psychological Level GOLD Next Target will be 4230 FMP Level or even 4250
Disclaimer: Forex is Risky

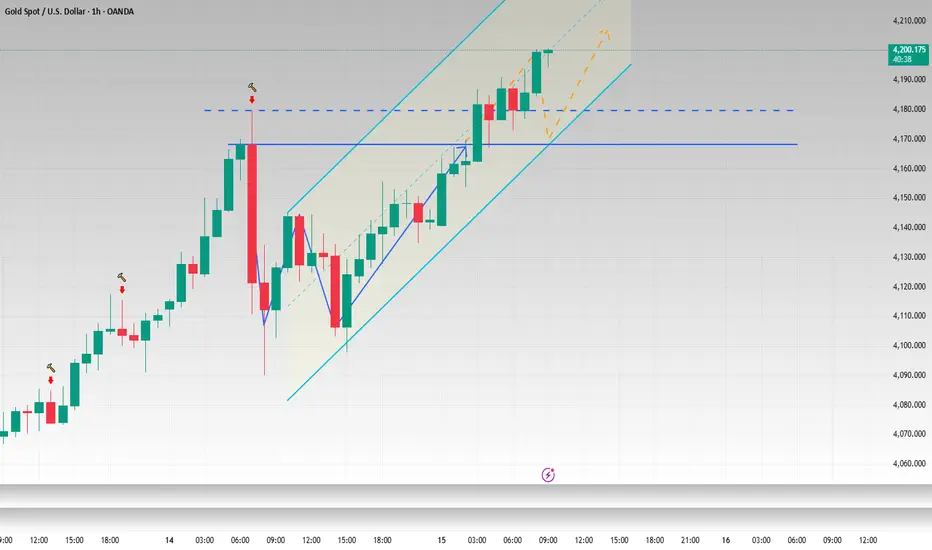
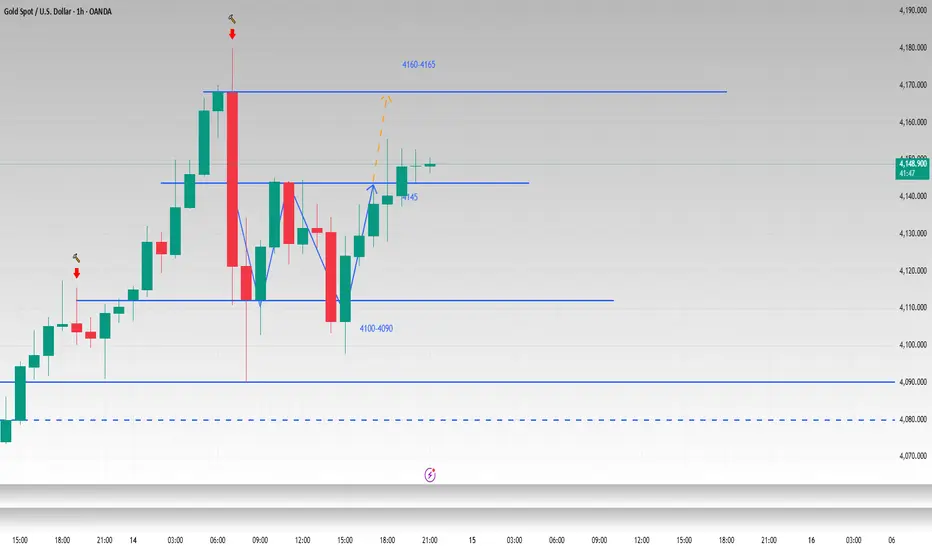
Momentum Breakout into Strength | D-H Flip ConfirmedStrong continuation from last session’s impulsive push.
I caught my move during the Tokyo impulsive hour after price broke cleanly above 4175 — confirming a momentum breakout setup on the 15-min chart.
The previous Daily High (4191.2) has now flipped into solid support, reinforcing the bullish narrative I’ve been tracking since the start of the week.
My original weekly target was 4200 — we’ve exceeded that level now, and the momentum still looks healthy.
Price action is slowing ahead of the London session, which could set the stage for another expansion leg. If bullish pressure holds, I’m watching 4230–4250 next, with 4500 as a stretch target.
💡 Key Notes:
Setup: Momentum Breakout
Bias: Bullish
Entry: 4177.3 | Exit: 4185.1
Result: +$386 (5 Contracts)
Time in Trade: 42m
Context: Daily High Flip + Strong Impulse Continuation
#Gold #Futures #DayTrading #PriceAction #Breakout #TradingView #MGC #Trader #NoFOMO #Discipline #MomentumBreakout #ICTInspired

W pattern is established and the bullish pattern remain unchangeI have said before that gold is in a fluctuating upward state whether viewed from the weekly or daily charts, and there is no reversal signal. I mentioned in my previous post that from the hourly chart, gold has the prototype of a W shape, and the neckline is at 4145. In the evening of the US session, gold successfully broke through the neckline and touched around 4155. Although the bullish momentum of gold has stagnated slightly after a slow rise, I am still optimistic that gold will reach 4160-4165. If it falls back to around 4145-4135 again, we can still consider trying to go long on gold.
OANDA:XAUUSD
XAUUSD (Gold): buy setupXAUUSD (Gold): buy setup. Wait for a close in 1H and check for volume confirmation.
Cheers

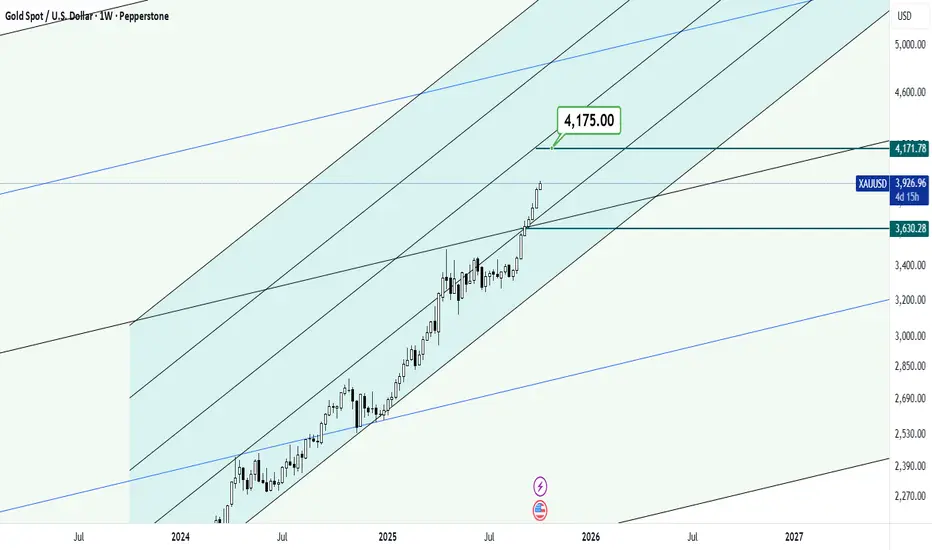
How can I justify this price?Whatever you understand, that was your concept!
Well, we are rapidly approaching the end of the gold bull run and prices are facing a much steeper slope in the weekly and monthly timeframes!
The target price at 4175 is not far away, but I think it is scary!
Good luck
Gold → Ready for the Next Bullish WaveGold (XAUUSD) continues to gain momentum as shifting global conditions drive investors toward safer assets. The ongoing uncertainty in financial markets, coupled with renewed concerns over U.S. fiscal policy and interest rate adjustments, has strengthened gold’s long-term appeal.
Recent market behavior reflects consistent institutional demand, with traders positioning ahead of potential monetary easing cycles. As confidence in traditional currencies weakens, gold remains a preferred store of value for both investors and central banks.
Structurally, the market is maintaining a healthy uptrend, showing controlled corrections within a broader bullish framework. The latest price movements suggest that momentum is building for another upward phase, possibly targeting new historical zones if global instability persists.
In summary, gold’s outlook stays constructive — supported by both macroeconomic sentiment and steady technical momentum.
How do you see the XAUUSD trajectory evolving — continuation of growth or a major pause ahead?

GOLD 4H CHART ROUTE MAP UPDATE & TRADING PLAN FOR THE WEEKHey Everyone,
Please see our updated 4h chart levels and targets for the coming week.
We are seeing price play between two weighted levels with a gap above at 4041 and a gap below at 3978. We will need to see ema5 cross and lock on either weighted level to determine the next range.
We will see levels tested side by side until one of the weighted levels break and lock to confirm direction for the next range.
We will keep the above in mind when taking buys from dips. Our updated levels and weighted levels will allow us to track the movement down and then catch bounces up.
We will continue to buy dips using our support levels taking 20 to 40 pips. As stated before each of our level structures give 20 to 40 pip bounces, which is enough for a nice entry and exit. If you back test the levels we shared every week for the past 24 months, you can see how effectively they were used to trade with or against short/mid term swings and trends.
The swing range give bigger bounces then our weighted levels that's the difference between weighted levels and swing ranges.
BULLISH TARGET
4041
EMA5 CROSS AND LOCK ABOVE 4041 WILL OPEN THE FOLLOWING BULLISH TARGETS
4099
EMA5 CROSS AND LOCK ABOVE 4099 WILL OPEN THE FOLLOWING BULLISH TARGET
4154
EMA5 CROSS AND LOCK ABOVE 4154 WILL OPEN THE FOLLOWING BULLISH TARGET
4212
BEARISH TARGETS
3978
EMA5 CROSS AND LOCK BELOW 3978 WILL OPEN THE FOLLOWING BEARISH TARGET
3916
EMA5 CROSS AND LOCK BELOW 3916 WILL OPEN THE SWING RANGE
3840
3767
EMA5 CROSS AND LOCK BELOW 3767 WILL OPEN THE SECONDARY SWING RANGE
3689
3632
As always, we will keep you all updated with regular updates throughout the week and how we manage the active ideas and setups. Thank you all for your likes, comments and follows, we really appreciate it!
Mr Gold
GoldViewFX

NZD/USD 30-minute chart Pattern...NZD/USD 30-minute chart, here’s a breakdown of what the setup shows:
The chart depicts a downtrend, but price is currently forming a potential reversal from a support zone (the rectangular box at the bottom).
A downtrend line has been broken or is about to be broken to the upside.
The Ichimoku cloud (yellow area) is overhead — suggesting resistance near that zone, but also my target point is drawn above the cloud.
Current price is around 0.5709.
✅ My target (as shown on the chart):
The “Target Point” is drawn near 0.5750–0.5760.
So the likely target zone for this bullish move is:
👉 0.5750 – 0.5760
⚠ Trading notes:
A clear break and close above 0.5715–0.5720 would confirm bullish momentum.
First resistance: 0.5730
Final target: 0.5750–0.5760
A logical stop-loss could be below 0.5690, beneath the recent support zone.
